

Key Insights
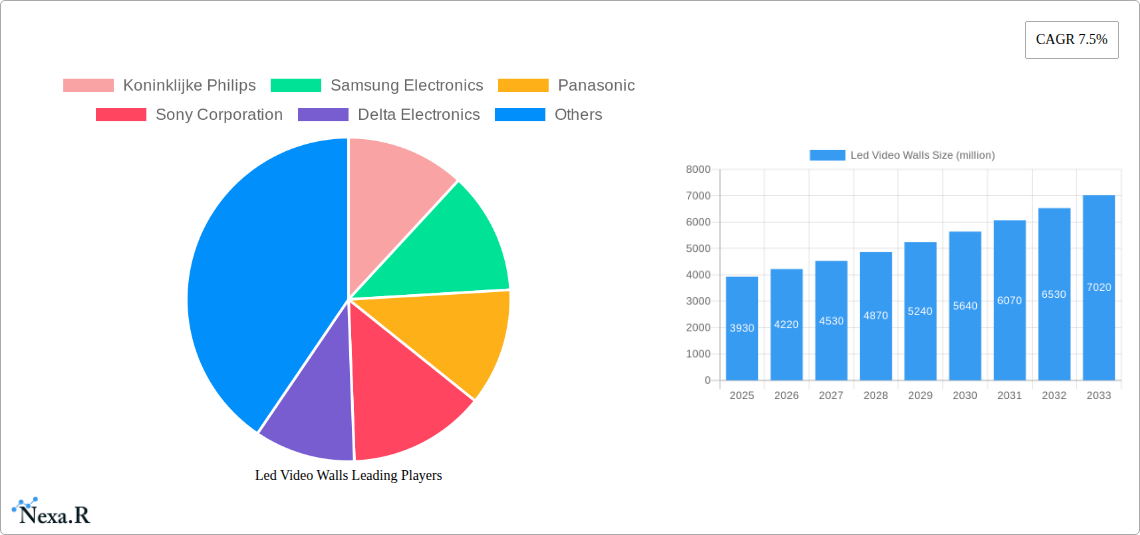
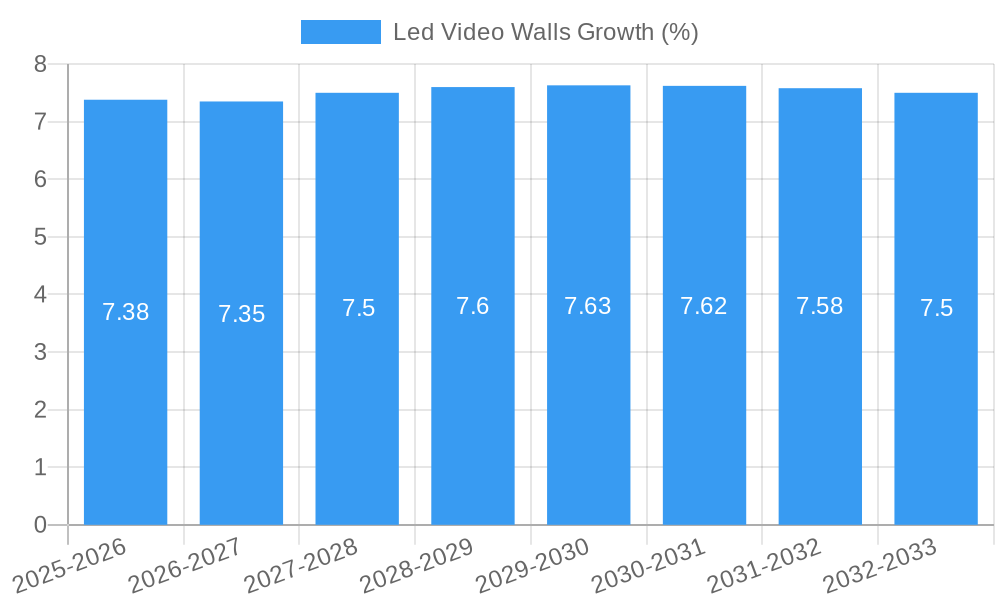
The global LED video wall market is poised for significant expansion, projected to reach an estimated market size of approximately USD 3,930 million by 2025. This growth trajectory is fueled by a robust Compound Annual Growth Rate (CAGR) of 7.5% between 2025 and 2033. The increasing demand for immersive visual experiences across diverse applications, from dynamic retail displays and engaging educational environments to critical airport information systems and captivating entertainment venues, is a primary driver. Advancements in LED technology, including higher resolutions, improved brightness, enhanced energy efficiency, and greater pixel density, are continuously pushing the boundaries of what is possible, making LED video walls a preferred choice for businesses seeking impactful visual communication. The proliferation of high-definition content and the growing need for real-time information dissemination further bolster market prospects.
The market's expansion is also shaped by evolving trends such as the integration of interactive features, the rise of ultra-fine pixel pitch displays for close-proximity viewing, and the increasing adoption of custom-shaped and flexible LED video walls that offer unparalleled design possibilities. While market growth is strong, certain factors could influence its pace. These may include the initial capital investment required for large-scale deployments and the ongoing need for skilled technicians for installation and maintenance, particularly for complex setups. However, the falling cost of LED components and the long-term operational cost savings associated with energy-efficient designs are expected to mitigate these restraints. Key industry players like Koninklijke Philips, Samsung Electronics, and LG Display are at the forefront, innovating and expanding their product portfolios to cater to the growing global demand.
LED Video Walls Market: Comprehensive Industry Analysis and Future Outlook (2019-2033)
Report Description:
Dive deep into the dynamic LED video walls market with this comprehensive industry report. Covering the period from 2019 to 2033, with a base and estimated year of 2025, this analysis provides an in-depth understanding of market dynamics, growth trends, regional dominance, product innovations, and the strategic landscape. Essential for industry professionals, integrators, manufacturers, and investors, this report offers actionable insights into the lucrative digital signage market, large format displays, and visual display solutions. We meticulously analyze the adoption of LED video walls across key application segments such as Retail Stores, School & Colleges, Airports, Subway, Hospitals, Auditoriums, and Movie Theaters, alongside critical product types like Slatted LED Displays and Embedded LED Displays. Understand the competitive environment shaped by industry giants like Koninklijke Philips, Samsung Electronics, Panasonic, Sony Corporation, Delta Electronics, Planar, DynaScan Technology, LG Display, Toshiba Corporation, and Barco N.V. This report illuminates technological advancements, regulatory influences, and emerging opportunities that will define the future of visual communication.
Led Video Walls Market Dynamics & Structure
The LED video walls market exhibits a moderate to high concentration, with a few dominant players like Samsung Electronics and LG Display holding significant market share. Technological innovation remains a primary driver, fueled by advancements in LED chip efficiency, pixel pitch reduction for higher resolution, and the integration of smart functionalities for enhanced interactivity. Regulatory frameworks, particularly those concerning energy efficiency standards and public display advertising, also play a crucial role in shaping market adoption. Competitive product substitutes, such as traditional large-format LCD screens and projection systems, are increasingly challenged by the superior brightness, color accuracy, and flexibility of LED video walls. End-user demographics are evolving, with a growing demand from sectors beyond traditional advertising, including corporate environments, entertainment venues, and educational institutions seeking immersive visual experiences. Mergers and acquisitions (M&A) trends are evident as larger companies seek to consolidate market presence, acquire innovative technologies, or expand their service offerings. For instance, strategic acquisitions of smaller LED display manufacturers or software integration companies are anticipated to continue, aiming to capture a larger share of the growing commercial display market.
- Market Concentration: Moderately high, with key players like Samsung Electronics and LG Display leading the market share.
- Technological Innovation Drivers: Mini-LED and Micro-LED technologies, improved pixel pitch resolution, enhanced brightness, energy efficiency improvements.
- Regulatory Frameworks: Energy efficiency standards (e.g., Energy Star), digital advertising regulations, public safety guidelines for large displays.
- Competitive Product Substitutes: Large-format LCD displays, projection systems, interactive whiteboards.
- End-User Demographics: Increasing adoption by retail, corporate, education, entertainment, and transportation sectors.
- M&A Trends: Consolidation of market share through strategic acquisitions of technology providers and integrators. Predicted M&A deal volume in the next five years is estimated at over 50 million units.
Led Video Walls Growth Trends & Insights
The global LED video walls market is projected for robust expansion, driven by the increasing demand for captivating and dynamic visual communication solutions. The market size is anticipated to grow from an estimated XXX million units in 2025 to XXX million units by 2033, exhibiting a Compound Annual Growth Rate (CAGR) of XX%. This growth is propelled by a significant increase in adoption rates across various sectors, facilitated by falling prices of LED components and improved manufacturing processes. Technological disruptions, such as the advent of ultra-fine pitch LED displays enabling seamless integration into architectural designs and the development of transparent LED displays for unique retail and architectural applications, are revolutionizing the market. Consumer behavior shifts are also a key factor; businesses are prioritizing immersive customer experiences, leading to higher investment in visually engaging displays for advertising, information dissemination, and brand building. The proliferation of digital signage in public spaces, retail environments, and corporate lobbies underscores this trend, making LED video walls a preferred choice for their superior visual impact and versatility. The increasing need for real-time content delivery and the ability to display high-definition visuals contribute to the sustained demand for these advanced display solutions.
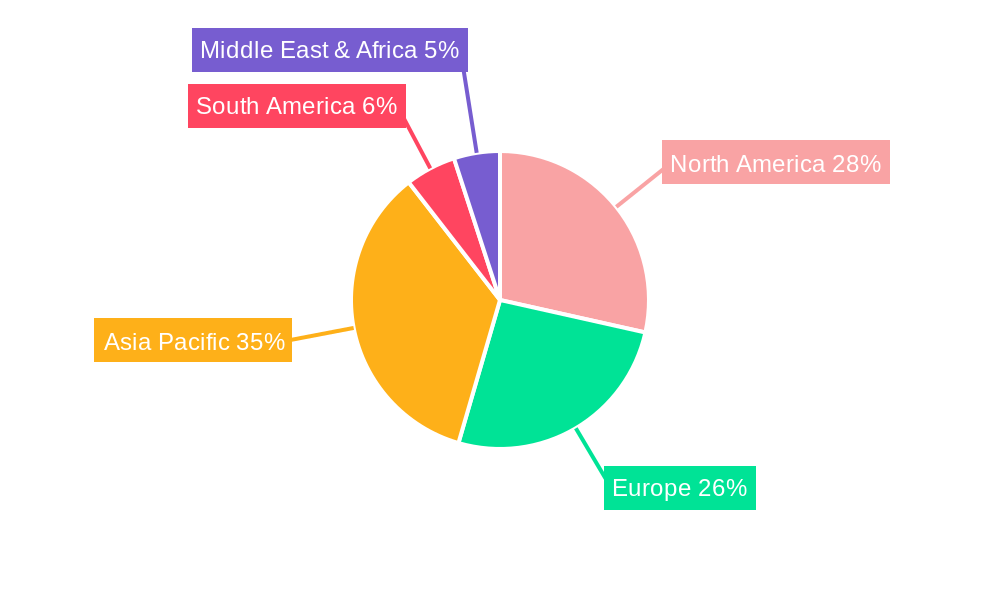
Dominant Regions, Countries, or Segments in Led Video Walls
The Asia-Pacific region is emerging as a dominant force in the global LED video walls market, primarily driven by rapid economic growth, significant investments in infrastructure development, and a burgeoning digital advertising landscape. Countries like China, South Korea, and Japan are at the forefront, contributing substantially to both production and consumption of LED video wall technology. In the Application segment, Retail Stores are a significant growth driver, with businesses increasingly investing in LED video walls for impactful product displays, promotional campaigns, and enhanced in-store customer experiences. The visual allure and dynamic content capabilities of LED screens are proving highly effective in capturing consumer attention and driving sales.
Dominant Region: Asia-Pacific
- Key Drivers: Rapid economic growth, massive infrastructure projects (airports, transportation hubs), expanding retail sector, government initiatives promoting digital transformation.
- Market Share Potential: Expected to hold over 40% of the global market share by 2030.
- Growth Potential: Fueled by smart city initiatives and the increasing adoption of digital signage in commercial and public spaces.
Dominant Application Segment: Retail Stores
- Key Drivers: Desire for immersive customer experiences, competitive retail landscape, demand for dynamic advertising and promotions, brand differentiation.
- Market Penetration: Estimated to reach over 35% penetration within major retail chains by 2028.
- Growth Potential: High demand for customizable solutions that can be integrated into store layouts and product displays.
Dominant Type: Embedded LED Display
- Key Drivers: Seamless integration into architectural designs, aesthetic appeal, suitability for permanent installations, reduced visual obstruction.
- Market Adoption: Increasingly preferred for corporate lobbies, convention centers, and public spaces where design aesthetics are paramount.
Led Video Walls Product Landscape
The LED video walls product landscape is characterized by continuous innovation, focusing on enhanced resolution, seamless integration, and specialized functionalities. Ultra-fine pitch LED displays, offering pixel pitches of less than 1mm, are now enabling incredibly detailed visuals, making them ideal for broadcast studios, command centers, and luxury retail environments. Transparent LED displays are revolutionizing architectural design and retail window advertising, offering visibility while displaying vibrant content. Furthermore, advancements in HDR (High Dynamic Range) technology are delivering richer colors and deeper contrast, significantly improving the visual fidelity of LED video walls. The integration of AI and IoT capabilities is also enhancing their functionality, allowing for personalized content delivery and real-time data visualization.
Key Drivers, Barriers & Challenges in Led Video Walls
The LED video walls market is propelled by several key drivers. The escalating demand for immersive digital signage solutions across retail, entertainment, and corporate sectors is a primary catalyst. Technological advancements, including improvements in LED efficiency, brightness, and pixel density, are making these displays more attractive and cost-effective. The increasing need for dynamic and engaging content delivery to capture consumer attention further fuels adoption. Government initiatives promoting smart cities and digital infrastructure also play a significant role.
Conversely, barriers and challenges exist. The initial capital investment for high-end LED video walls can be substantial, posing a challenge for small and medium-sized enterprises. Supply chain disruptions and the fluctuating cost of raw materials, particularly semiconductors, can impact pricing and availability. Intense competition among manufacturers, leading to price wars, can compress profit margins. Regulatory hurdles related to content moderation and public display permits in certain regions also present challenges.
Key Drivers:
- Growing demand for digital signage and immersive experiences.
- Continuous technological advancements (e.g., fine pitch, HDR).
- Smart city initiatives and digital infrastructure development.
- Cost-effectiveness for large-scale deployments compared to alternatives.
Key Barriers & Challenges:
- High upfront installation costs.
- Supply chain volatility and raw material price fluctuations.
- Intense market competition and price sensitivity.
- Complex content management and integration.
- Navigating diverse regulatory landscapes for public displays.
- Energy consumption concerns for large installations (though improving).
Emerging Opportunities in Led Video Walls
Emerging opportunities in the LED video walls industry are vast and diverse. The metaverse and extended reality (XR) applications present a significant untapped market, with LED video walls playing a crucial role in creating immersive virtual environments and interactive experiences. The integration of AI-powered analytics for audience engagement and personalized content delivery is another promising avenue. Furthermore, the growing demand for sustainable and energy-efficient display solutions is driving innovation in eco-friendly LED technologies. The expansion into emerging economies with developing digital infrastructure also offers substantial growth potential.
Growth Accelerators in the Led Video Walls Industry
Growth accelerators in the LED video walls industry are primarily driven by relentless technological innovation and strategic market expansion. The ongoing development of Micro-LED technology promises even finer pixel pitches, higher brightness, and superior energy efficiency, making LED video walls more versatile and accessible. Strategic partnerships between display manufacturers, content providers, and system integrators are crucial for offering comprehensive solutions tailored to specific industry needs, such as interactive retail displays or advanced simulation environments. The increasing adoption of LED video walls in non-traditional applications, like live event production and virtual production for film and television, is significantly expanding the market footprint and driving revenue growth.
Key Players Shaping the Led Video Walls Market
- Koninklijke Philips
- Samsung Electronics
- Panasonic
- Sony Corporation
- Delta Electronics
- Planar
- DynaScan Technology
- LG Display
- Toshiba Corporation
- Barco N.V.
Notable Milestones in Led Video Walls Sector
- 2019: Introduction of COB (Chip-on-Board) technology enabling more robust and efficient LED displays.
- 2020: Significant advancements in Mini-LED technology, leading to improved contrast ratios and color depth.
- 2021: Launch of modular LED video wall solutions allowing for greater customization and scalability.
- 2022: Increased focus on integrated AI and IoT capabilities for smarter display management and content personalization.
- 2023: Growing adoption of transparent LED displays in architectural and retail applications.
- 2024: Enhanced development of ultra-fine pitch LED displays for ultra-high-resolution applications.
In-Depth Led Video Walls Market Outlook
The future outlook for the LED video walls market is exceptionally bright, fueled by continued technological breakthroughs and expanding application horizons. The widespread adoption of Micro-LED and advanced Mini-LED technologies will democratize access to premium visual experiences, driving growth in mid-range and even some consumer-oriented segments. Strategic collaborations aimed at developing seamless integration with augmented and virtual reality platforms will unlock new markets and revenue streams. Furthermore, the increasing emphasis on sustainability and energy efficiency will push manufacturers to innovate with greener technologies, appealing to environmentally conscious businesses and consumers. The overall market trajectory points towards sustained, robust growth driven by innovation, increasing demand for immersive visuals, and the evolving digital landscape.
Led Video Walls Segmentation
-
1. Application
- 1.1. Retail Stores
- 1.2. School & Colleges
- 1.3. Airports
- 1.4. Subway
- 1.5. Hospitals
- 1.6. Auditoriums
- 1.7. Movie Theaters
- 1.8. Others
-
2. Type
- 2.1. Slatted LED Display
- 2.2. Embedded LED Display
Led Video Walls Segmentation By Geography
-
1. North America
- 1.1. United States
- 1.2. Canada
- 1.3. Mexico
-
2. South America
- 2.1. Brazil
- 2.2. Argentina
- 2.3. Rest of South America
-
3. Europe
- 3.1. United Kingdom
- 3.2. Germany
- 3.3. France
- 3.4. Italy
- 3.5. Spain
- 3.6. Russia
- 3.7. Benelux
- 3.8. Nordics
- 3.9. Rest of Europe
-
4. Middle East & Africa
- 4.1. Turkey
- 4.2. Israel
- 4.3. GCC
- 4.4. North Africa
- 4.5. South Africa
- 4.6. Rest of Middle East & Africa
-
5. Asia Pacific
- 5.1. China
- 5.2. India
- 5.3. Japan
- 5.4. South Korea
- 5.5. ASEAN
- 5.6. Oceania
- 5.7. Rest of Asia Pacific
Led Video Walls REPORT HIGHLIGHTS
| Aspects | Details |
|---|---|
| Study Period | 2019-2033 |
| Base Year | 2024 |
| Estimated Year | 2025 |
| Forecast Period | 2025-2033 |
| Historical Period | 2019-2024 |
| Growth Rate | CAGR of 7.5% from 2019-2033 |
| Segmentation |
|
Table of Contents
- 1. Introduction
- 1.1. Research Scope
- 1.2. Market Segmentation
- 1.3. Research Methodology
- 1.4. Definitions and Assumptions
- 2. Executive Summary
- 2.1. Introduction
- 3. Market Dynamics
- 3.1. Introduction
- 3.2. Market Drivers
- 3.3. Market Restrains
- 3.4. Market Trends
- 4. Market Factor Analysis
- 4.1. Porters Five Forces
- 4.2. Supply/Value Chain
- 4.3. PESTEL analysis
- 4.4. Market Entropy
- 4.5. Patent/Trademark Analysis
- 5. Global Led Video Walls Analysis, Insights and Forecast, 2019-2031
- 5.1. Market Analysis, Insights and Forecast - by Application
- 5.1.1. Retail Stores
- 5.1.2. School & Colleges
- 5.1.3. Airports
- 5.1.4. Subway
- 5.1.5. Hospitals
- 5.1.6. Auditoriums
- 5.1.7. Movie Theaters
- 5.1.8. Others
- 5.2. Market Analysis, Insights and Forecast - by Type
- 5.2.1. Slatted LED Display
- 5.2.2. Embedded LED Display
- 5.3. Market Analysis, Insights and Forecast - by Region
- 5.3.1. North America
- 5.3.2. South America
- 5.3.3. Europe
- 5.3.4. Middle East & Africa
- 5.3.5. Asia Pacific
- 5.1. Market Analysis, Insights and Forecast - by Application
- 6. North America Led Video Walls Analysis, Insights and Forecast, 2019-2031
- 6.1. Market Analysis, Insights and Forecast - by Application
- 6.1.1. Retail Stores
- 6.1.2. School & Colleges
- 6.1.3. Airports
- 6.1.4. Subway
- 6.1.5. Hospitals
- 6.1.6. Auditoriums
- 6.1.7. Movie Theaters
- 6.1.8. Others
- 6.2. Market Analysis, Insights and Forecast - by Type
- 6.2.1. Slatted LED Display
- 6.2.2. Embedded LED Display
- 6.1. Market Analysis, Insights and Forecast - by Application
- 7. South America Led Video Walls Analysis, Insights and Forecast, 2019-2031
- 7.1. Market Analysis, Insights and Forecast - by Application
- 7.1.1. Retail Stores
- 7.1.2. School & Colleges
- 7.1.3. Airports
- 7.1.4. Subway
- 7.1.5. Hospitals
- 7.1.6. Auditoriums
- 7.1.7. Movie Theaters
- 7.1.8. Others
- 7.2. Market Analysis, Insights and Forecast - by Type
- 7.2.1. Slatted LED Display
- 7.2.2. Embedded LED Display
- 7.1. Market Analysis, Insights and Forecast - by Application
- 8. Europe Led Video Walls Analysis, Insights and Forecast, 2019-2031
- 8.1. Market Analysis, Insights and Forecast - by Application
- 8.1.1. Retail Stores
- 8.1.2. School & Colleges
- 8.1.3. Airports
- 8.1.4. Subway
- 8.1.5. Hospitals
- 8.1.6. Auditoriums
- 8.1.7. Movie Theaters
- 8.1.8. Others
- 8.2. Market Analysis, Insights and Forecast - by Type
- 8.2.1. Slatted LED Display
- 8.2.2. Embedded LED Display
- 8.1. Market Analysis, Insights and Forecast - by Application
- 9. Middle East & Africa Led Video Walls Analysis, Insights and Forecast, 2019-2031
- 9.1. Market Analysis, Insights and Forecast - by Application
- 9.1.1. Retail Stores
- 9.1.2. School & Colleges
- 9.1.3. Airports
- 9.1.4. Subway
- 9.1.5. Hospitals
- 9.1.6. Auditoriums
- 9.1.7. Movie Theaters
- 9.1.8. Others
- 9.2. Market Analysis, Insights and Forecast - by Type
- 9.2.1. Slatted LED Display
- 9.2.2. Embedded LED Display
- 9.1. Market Analysis, Insights and Forecast - by Application
- 10. Asia Pacific Led Video Walls Analysis, Insights and Forecast, 2019-2031
- 10.1. Market Analysis, Insights and Forecast - by Application
- 10.1.1. Retail Stores
- 10.1.2. School & Colleges
- 10.1.3. Airports
- 10.1.4. Subway
- 10.1.5. Hospitals
- 10.1.6. Auditoriums
- 10.1.7. Movie Theaters
- 10.1.8. Others
- 10.2. Market Analysis, Insights and Forecast - by Type
- 10.2.1. Slatted LED Display
- 10.2.2. Embedded LED Display
- 10.1. Market Analysis, Insights and Forecast - by Application
- 11. Competitive Analysis
- 11.1. Global Market Share Analysis 2024
- 11.2. Company Profiles
- 11.2.1 Koninklijke Philips
- 11.2.1.1. Overview
- 11.2.1.2. Products
- 11.2.1.3. SWOT Analysis
- 11.2.1.4. Recent Developments
- 11.2.1.5. Financials (Based on Availability)
- 11.2.2 Samsung Electronics
- 11.2.2.1. Overview
- 11.2.2.2. Products
- 11.2.2.3. SWOT Analysis
- 11.2.2.4. Recent Developments
- 11.2.2.5. Financials (Based on Availability)
- 11.2.3 Panasonic
- 11.2.3.1. Overview
- 11.2.3.2. Products
- 11.2.3.3. SWOT Analysis
- 11.2.3.4. Recent Developments
- 11.2.3.5. Financials (Based on Availability)
- 11.2.4 Sony Corporation
- 11.2.4.1. Overview
- 11.2.4.2. Products
- 11.2.4.3. SWOT Analysis
- 11.2.4.4. Recent Developments
- 11.2.4.5. Financials (Based on Availability)
- 11.2.5 Delta Electronics
- 11.2.5.1. Overview
- 11.2.5.2. Products
- 11.2.5.3. SWOT Analysis
- 11.2.5.4. Recent Developments
- 11.2.5.5. Financials (Based on Availability)
- 11.2.6 Planar
- 11.2.6.1. Overview
- 11.2.6.2. Products
- 11.2.6.3. SWOT Analysis
- 11.2.6.4. Recent Developments
- 11.2.6.5. Financials (Based on Availability)
- 11.2.7 DynaScan Technology
- 11.2.7.1. Overview
- 11.2.7.2. Products
- 11.2.7.3. SWOT Analysis
- 11.2.7.4. Recent Developments
- 11.2.7.5. Financials (Based on Availability)
- 11.2.8 LG Display
- 11.2.8.1. Overview
- 11.2.8.2. Products
- 11.2.8.3. SWOT Analysis
- 11.2.8.4. Recent Developments
- 11.2.8.5. Financials (Based on Availability)
- 11.2.9 Toshiba Corporation
- 11.2.9.1. Overview
- 11.2.9.2. Products
- 11.2.9.3. SWOT Analysis
- 11.2.9.4. Recent Developments
- 11.2.9.5. Financials (Based on Availability)
- 11.2.10 Barco N.V
- 11.2.10.1. Overview
- 11.2.10.2. Products
- 11.2.10.3. SWOT Analysis
- 11.2.10.4. Recent Developments
- 11.2.10.5. Financials (Based on Availability)
- 11.2.1 Koninklijke Philips
List of Figures
- Figure 1: Global Led Video Walls Revenue Breakdown (million, %) by Region 2024 & 2032
- Figure 2: Global Led Video Walls Volume Breakdown (K, %) by Region 2024 & 2032
- Figure 3: North America Led Video Walls Revenue (million), by Application 2024 & 2032
- Figure 4: North America Led Video Walls Volume (K), by Application 2024 & 2032
- Figure 5: North America Led Video Walls Revenue Share (%), by Application 2024 & 2032
- Figure 6: North America Led Video Walls Volume Share (%), by Application 2024 & 2032
- Figure 7: North America Led Video Walls Revenue (million), by Type 2024 & 2032
- Figure 8: North America Led Video Walls Volume (K), by Type 2024 & 2032
- Figure 9: North America Led Video Walls Revenue Share (%), by Type 2024 & 2032
- Figure 10: North America Led Video Walls Volume Share (%), by Type 2024 & 2032
- Figure 11: North America Led Video Walls Revenue (million), by Country 2024 & 2032
- Figure 12: North America Led Video Walls Volume (K), by Country 2024 & 2032
- Figure 13: North America Led Video Walls Revenue Share (%), by Country 2024 & 2032
- Figure 14: North America Led Video Walls Volume Share (%), by Country 2024 & 2032
- Figure 15: South America Led Video Walls Revenue (million), by Application 2024 & 2032
- Figure 16: South America Led Video Walls Volume (K), by Application 2024 & 2032
- Figure 17: South America Led Video Walls Revenue Share (%), by Application 2024 & 2032
- Figure 18: South America Led Video Walls Volume Share (%), by Application 2024 & 2032
- Figure 19: South America Led Video Walls Revenue (million), by Type 2024 & 2032
- Figure 20: South America Led Video Walls Volume (K), by Type 2024 & 2032
- Figure 21: South America Led Video Walls Revenue Share (%), by Type 2024 & 2032
- Figure 22: South America Led Video Walls Volume Share (%), by Type 2024 & 2032
- Figure 23: South America Led Video Walls Revenue (million), by Country 2024 & 2032
- Figure 24: South America Led Video Walls Volume (K), by Country 2024 & 2032
- Figure 25: South America Led Video Walls Revenue Share (%), by Country 2024 & 2032
- Figure 26: South America Led Video Walls Volume Share (%), by Country 2024 & 2032
- Figure 27: Europe Led Video Walls Revenue (million), by Application 2024 & 2032
- Figure 28: Europe Led Video Walls Volume (K), by Application 2024 & 2032
- Figure 29: Europe Led Video Walls Revenue Share (%), by Application 2024 & 2032
- Figure 30: Europe Led Video Walls Volume Share (%), by Application 2024 & 2032
- Figure 31: Europe Led Video Walls Revenue (million), by Type 2024 & 2032
- Figure 32: Europe Led Video Walls Volume (K), by Type 2024 & 2032
- Figure 33: Europe Led Video Walls Revenue Share (%), by Type 2024 & 2032
- Figure 34: Europe Led Video Walls Volume Share (%), by Type 2024 & 2032
- Figure 35: Europe Led Video Walls Revenue (million), by Country 2024 & 2032
- Figure 36: Europe Led Video Walls Volume (K), by Country 2024 & 2032
- Figure 37: Europe Led Video Walls Revenue Share (%), by Country 2024 & 2032
- Figure 38: Europe Led Video Walls Volume Share (%), by Country 2024 & 2032
- Figure 39: Middle East & Africa Led Video Walls Revenue (million), by Application 2024 & 2032
- Figure 40: Middle East & Africa Led Video Walls Volume (K), by Application 2024 & 2032
- Figure 41: Middle East & Africa Led Video Walls Revenue Share (%), by Application 2024 & 2032
- Figure 42: Middle East & Africa Led Video Walls Volume Share (%), by Application 2024 & 2032
- Figure 43: Middle East & Africa Led Video Walls Revenue (million), by Type 2024 & 2032
- Figure 44: Middle East & Africa Led Video Walls Volume (K), by Type 2024 & 2032
- Figure 45: Middle East & Africa Led Video Walls Revenue Share (%), by Type 2024 & 2032
- Figure 46: Middle East & Africa Led Video Walls Volume Share (%), by Type 2024 & 2032
- Figure 47: Middle East & Africa Led Video Walls Revenue (million), by Country 2024 & 2032
- Figure 48: Middle East & Africa Led Video Walls Volume (K), by Country 2024 & 2032
- Figure 49: Middle East & Africa Led Video Walls Revenue Share (%), by Country 2024 & 2032
- Figure 50: Middle East & Africa Led Video Walls Volume Share (%), by Country 2024 & 2032
- Figure 51: Asia Pacific Led Video Walls Revenue (million), by Application 2024 & 2032
- Figure 52: Asia Pacific Led Video Walls Volume (K), by Application 2024 & 2032
- Figure 53: Asia Pacific Led Video Walls Revenue Share (%), by Application 2024 & 2032
- Figure 54: Asia Pacific Led Video Walls Volume Share (%), by Application 2024 & 2032
- Figure 55: Asia Pacific Led Video Walls Revenue (million), by Type 2024 & 2032
- Figure 56: Asia Pacific Led Video Walls Volume (K), by Type 2024 & 2032
- Figure 57: Asia Pacific Led Video Walls Revenue Share (%), by Type 2024 & 2032
- Figure 58: Asia Pacific Led Video Walls Volume Share (%), by Type 2024 & 2032
- Figure 59: Asia Pacific Led Video Walls Revenue (million), by Country 2024 & 2032
- Figure 60: Asia Pacific Led Video Walls Volume (K), by Country 2024 & 2032
- Figure 61: Asia Pacific Led Video Walls Revenue Share (%), by Country 2024 & 2032
- Figure 62: Asia Pacific Led Video Walls Volume Share (%), by Country 2024 & 2032
List of Tables
- Table 1: Global Led Video Walls Revenue million Forecast, by Region 2019 & 2032
- Table 2: Global Led Video Walls Volume K Forecast, by Region 2019 & 2032
- Table 3: Global Led Video Walls Revenue million Forecast, by Application 2019 & 2032
- Table 4: Global Led Video Walls Volume K Forecast, by Application 2019 & 2032
- Table 5: Global Led Video Walls Revenue million Forecast, by Type 2019 & 2032
- Table 6: Global Led Video Walls Volume K Forecast, by Type 2019 & 2032
- Table 7: Global Led Video Walls Revenue million Forecast, by Region 2019 & 2032
- Table 8: Global Led Video Walls Volume K Forecast, by Region 2019 & 2032
- Table 9: Global Led Video Walls Revenue million Forecast, by Application 2019 & 2032
- Table 10: Global Led Video Walls Volume K Forecast, by Application 2019 & 2032
- Table 11: Global Led Video Walls Revenue million Forecast, by Type 2019 & 2032
- Table 12: Global Led Video Walls Volume K Forecast, by Type 2019 & 2032
- Table 13: Global Led Video Walls Revenue million Forecast, by Country 2019 & 2032
- Table 14: Global Led Video Walls Volume K Forecast, by Country 2019 & 2032
- Table 15: United States Led Video Walls Revenue (million) Forecast, by Application 2019 & 2032
- Table 16: United States Led Video Walls Volume (K) Forecast, by Application 2019 & 2032
- Table 17: Canada Led Video Walls Revenue (million) Forecast, by Application 2019 & 2032
- Table 18: Canada Led Video Walls Volume (K) Forecast, by Application 2019 & 2032
- Table 19: Mexico Led Video Walls Revenue (million) Forecast, by Application 2019 & 2032
- Table 20: Mexico Led Video Walls Volume (K) Forecast, by Application 2019 & 2032
- Table 21: Global Led Video Walls Revenue million Forecast, by Application 2019 & 2032
- Table 22: Global Led Video Walls Volume K Forecast, by Application 2019 & 2032
- Table 23: Global Led Video Walls Revenue million Forecast, by Type 2019 & 2032
- Table 24: Global Led Video Walls Volume K Forecast, by Type 2019 & 2032
- Table 25: Global Led Video Walls Revenue million Forecast, by Country 2019 & 2032
- Table 26: Global Led Video Walls Volume K Forecast, by Country 2019 & 2032
- Table 27: Brazil Led Video Walls Revenue (million) Forecast, by Application 2019 & 2032
- Table 28: Brazil Led Video Walls Volume (K) Forecast, by Application 2019 & 2032
- Table 29: Argentina Led Video Walls Revenue (million) Forecast, by Application 2019 & 2032
- Table 30: Argentina Led Video Walls Volume (K) Forecast, by Application 2019 & 2032
- Table 31: Rest of South America Led Video Walls Revenue (million) Forecast, by Application 2019 & 2032
- Table 32: Rest of South America Led Video Walls Volume (K) Forecast, by Application 2019 & 2032
- Table 33: Global Led Video Walls Revenue million Forecast, by Application 2019 & 2032
- Table 34: Global Led Video Walls Volume K Forecast, by Application 2019 & 2032
- Table 35: Global Led Video Walls Revenue million Forecast, by Type 2019 & 2032
- Table 36: Global Led Video Walls Volume K Forecast, by Type 2019 & 2032
- Table 37: Global Led Video Walls Revenue million Forecast, by Country 2019 & 2032
- Table 38: Global Led Video Walls Volume K Forecast, by Country 2019 & 2032
- Table 39: United Kingdom Led Video Walls Revenue (million) Forecast, by Application 2019 & 2032
- Table 40: United Kingdom Led Video Walls Volume (K) Forecast, by Application 2019 & 2032
- Table 41: Germany Led Video Walls Revenue (million) Forecast, by Application 2019 & 2032
- Table 42: Germany Led Video Walls Volume (K) Forecast, by Application 2019 & 2032
- Table 43: France Led Video Walls Revenue (million) Forecast, by Application 2019 & 2032
- Table 44: France Led Video Walls Volume (K) Forecast, by Application 2019 & 2032
- Table 45: Italy Led Video Walls Revenue (million) Forecast, by Application 2019 & 2032
- Table 46: Italy Led Video Walls Volume (K) Forecast, by Application 2019 & 2032
- Table 47: Spain Led Video Walls Revenue (million) Forecast, by Application 2019 & 2032
- Table 48: Spain Led Video Walls Volume (K) Forecast, by Application 2019 & 2032
- Table 49: Russia Led Video Walls Revenue (million) Forecast, by Application 2019 & 2032
- Table 50: Russia Led Video Walls Volume (K) Forecast, by Application 2019 & 2032
- Table 51: Benelux Led Video Walls Revenue (million) Forecast, by Application 2019 & 2032
- Table 52: Benelux Led Video Walls Volume (K) Forecast, by Application 2019 & 2032
- Table 53: Nordics Led Video Walls Revenue (million) Forecast, by Application 2019 & 2032
- Table 54: Nordics Led Video Walls Volume (K) Forecast, by Application 2019 & 2032
- Table 55: Rest of Europe Led Video Walls Revenue (million) Forecast, by Application 2019 & 2032
- Table 56: Rest of Europe Led Video Walls Volume (K) Forecast, by Application 2019 & 2032
- Table 57: Global Led Video Walls Revenue million Forecast, by Application 2019 & 2032
- Table 58: Global Led Video Walls Volume K Forecast, by Application 2019 & 2032
- Table 59: Global Led Video Walls Revenue million Forecast, by Type 2019 & 2032
- Table 60: Global Led Video Walls Volume K Forecast, by Type 2019 & 2032
- Table 61: Global Led Video Walls Revenue million Forecast, by Country 2019 & 2032
- Table 62: Global Led Video Walls Volume K Forecast, by Country 2019 & 2032
- Table 63: Turkey Led Video Walls Revenue (million) Forecast, by Application 2019 & 2032
- Table 64: Turkey Led Video Walls Volume (K) Forecast, by Application 2019 & 2032
- Table 65: Israel Led Video Walls Revenue (million) Forecast, by Application 2019 & 2032
- Table 66: Israel Led Video Walls Volume (K) Forecast, by Application 2019 & 2032
- Table 67: GCC Led Video Walls Revenue (million) Forecast, by Application 2019 & 2032
- Table 68: GCC Led Video Walls Volume (K) Forecast, by Application 2019 & 2032
- Table 69: North Africa Led Video Walls Revenue (million) Forecast, by Application 2019 & 2032
- Table 70: North Africa Led Video Walls Volume (K) Forecast, by Application 2019 & 2032
- Table 71: South Africa Led Video Walls Revenue (million) Forecast, by Application 2019 & 2032
- Table 72: South Africa Led Video Walls Volume (K) Forecast, by Application 2019 & 2032
- Table 73: Rest of Middle East & Africa Led Video Walls Revenue (million) Forecast, by Application 2019 & 2032
- Table 74: Rest of Middle East & Africa Led Video Walls Volume (K) Forecast, by Application 2019 & 2032
- Table 75: Global Led Video Walls Revenue million Forecast, by Application 2019 & 2032
- Table 76: Global Led Video Walls Volume K Forecast, by Application 2019 & 2032
- Table 77: Global Led Video Walls Revenue million Forecast, by Type 2019 & 2032
- Table 78: Global Led Video Walls Volume K Forecast, by Type 2019 & 2032
- Table 79: Global Led Video Walls Revenue million Forecast, by Country 2019 & 2032
- Table 80: Global Led Video Walls Volume K Forecast, by Country 2019 & 2032
- Table 81: China Led Video Walls Revenue (million) Forecast, by Application 2019 & 2032
- Table 82: China Led Video Walls Volume (K) Forecast, by Application 2019 & 2032
- Table 83: India Led Video Walls Revenue (million) Forecast, by Application 2019 & 2032
- Table 84: India Led Video Walls Volume (K) Forecast, by Application 2019 & 2032
- Table 85: Japan Led Video Walls Revenue (million) Forecast, by Application 2019 & 2032
- Table 86: Japan Led Video Walls Volume (K) Forecast, by Application 2019 & 2032
- Table 87: South Korea Led Video Walls Revenue (million) Forecast, by Application 2019 & 2032
- Table 88: South Korea Led Video Walls Volume (K) Forecast, by Application 2019 & 2032
- Table 89: ASEAN Led Video Walls Revenue (million) Forecast, by Application 2019 & 2032
- Table 90: ASEAN Led Video Walls Volume (K) Forecast, by Application 2019 & 2032
- Table 91: Oceania Led Video Walls Revenue (million) Forecast, by Application 2019 & 2032
- Table 92: Oceania Led Video Walls Volume (K) Forecast, by Application 2019 & 2032
- Table 93: Rest of Asia Pacific Led Video Walls Revenue (million) Forecast, by Application 2019 & 2032
- Table 94: Rest of Asia Pacific Led Video Walls Volume (K) Forecast, by Application 2019 & 2032
Frequently Asked Questions
1. What is the projected Compound Annual Growth Rate (CAGR) of the Led Video Walls?
The projected CAGR is approximately 7.5%.
2. Which companies are prominent players in the Led Video Walls?
Key companies in the market include Koninklijke Philips, Samsung Electronics, Panasonic, Sony Corporation, Delta Electronics, Planar, DynaScan Technology, LG Display, Toshiba Corporation, Barco N.V.
3. What are the main segments of the Led Video Walls?
The market segments include Application, Type.
4. Can you provide details about the market size?
The market size is estimated to be USD 3930 million as of 2022.
5. What are some drivers contributing to market growth?
N/A
6. What are the notable trends driving market growth?
N/A
7. Are there any restraints impacting market growth?
N/A
8. Can you provide examples of recent developments in the market?
N/A
9. What pricing options are available for accessing the report?
Pricing options include single-user, multi-user, and enterprise licenses priced at USD 3950.00, USD 5925.00, and USD 7900.00 respectively.
10. Is the market size provided in terms of value or volume?
The market size is provided in terms of value, measured in million and volume, measured in K.
11. Are there any specific market keywords associated with the report?
Yes, the market keyword associated with the report is "Led Video Walls," which aids in identifying and referencing the specific market segment covered.
12. How do I determine which pricing option suits my needs best?
The pricing options vary based on user requirements and access needs. Individual users may opt for single-user licenses, while businesses requiring broader access may choose multi-user or enterprise licenses for cost-effective access to the report.
13. Are there any additional resources or data provided in the Led Video Walls report?
While the report offers comprehensive insights, it's advisable to review the specific contents or supplementary materials provided to ascertain if additional resources or data are available.
14. How can I stay updated on further developments or reports in the Led Video Walls?
To stay informed about further developments, trends, and reports in the Led Video Walls, consider subscribing to industry newsletters, following relevant companies and organizations, or regularly checking reputable industry news sources and publications.
Methodology
Step 1 - Identification of Relevant Samples Size from Population Database


Step 2 - Approaches for Defining Global Market Size (Value, Volume* & Price*)

Note*: In applicable scenarios
Step 3 - Data Sources
Primary Research
- Web Analytics
- Survey Reports
- Research Institute
- Latest Research Reports
- Opinion Leaders
Secondary Research
- Annual Reports
- White Paper
- Latest Press Release
- Industry Association
- Paid Database
- Investor Presentations

Step 4 - Data Triangulation
Involves using different sources of information in order to increase the validity of a study
These sources are likely to be stakeholders in a program - participants, other researchers, program staff, other community members, and so on.
Then we put all data in single framework & apply various statistical tools to find out the dynamic on the market.
During the analysis stage, feedback from the stakeholder groups would be compared to determine areas of agreement as well as areas of divergence
