

Key Insights
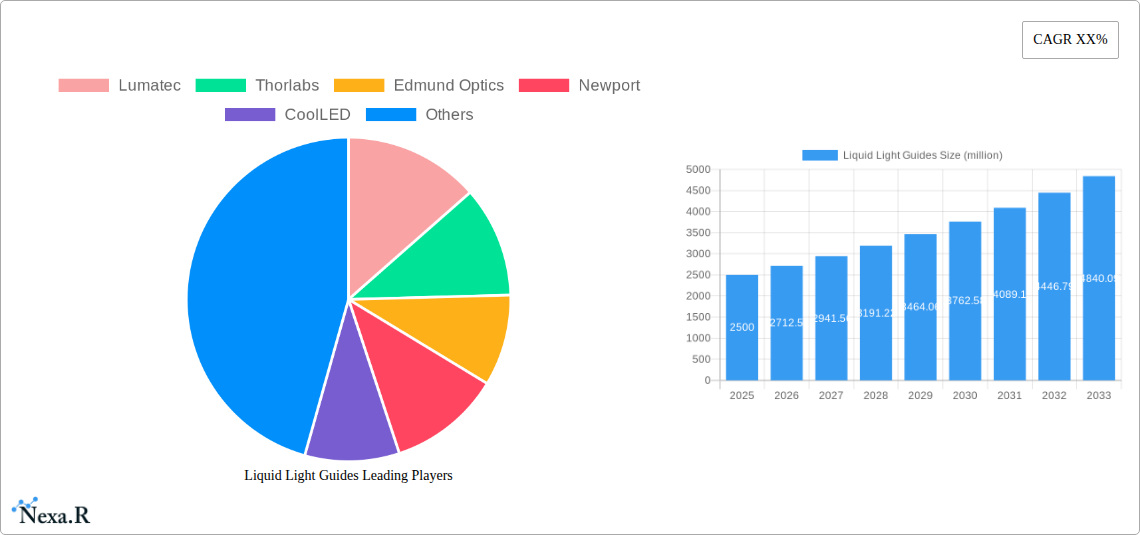
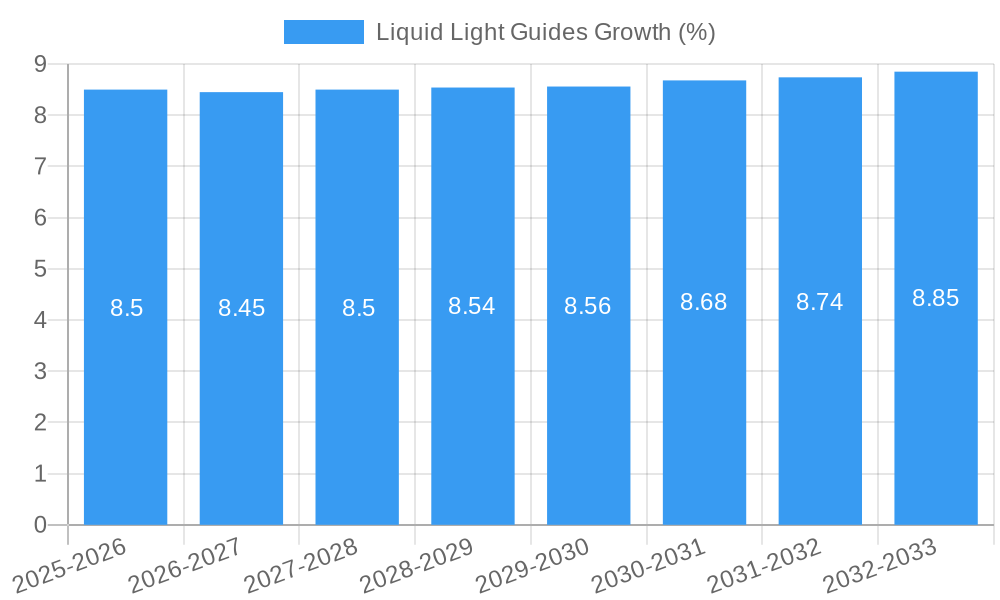
The global Liquid Light Guides market is poised for significant expansion, projected to reach approximately USD 2.5 billion by 2025, with a robust Compound Annual Growth Rate (CAGR) of around 8.5% anticipated throughout the forecast period of 2025-2033. This growth is primarily fueled by the escalating demand across a multitude of applications, notably in UV curing systems for industrial manufacturing and in the advanced imaging techniques employed in fluorescence microscopy. The inherent advantages of liquid light guides, such as their high flexibility, excellent light transmission efficiency, and ability to deliver intense, uniform illumination, are driving their adoption in sectors requiring precise and reliable light delivery. Furthermore, the burgeoning use of these guides in forensic illumination, coupled with their expanding applications in research and development across life sciences, photonics, and material science, underscores their critical role in scientific advancement and technological innovation.
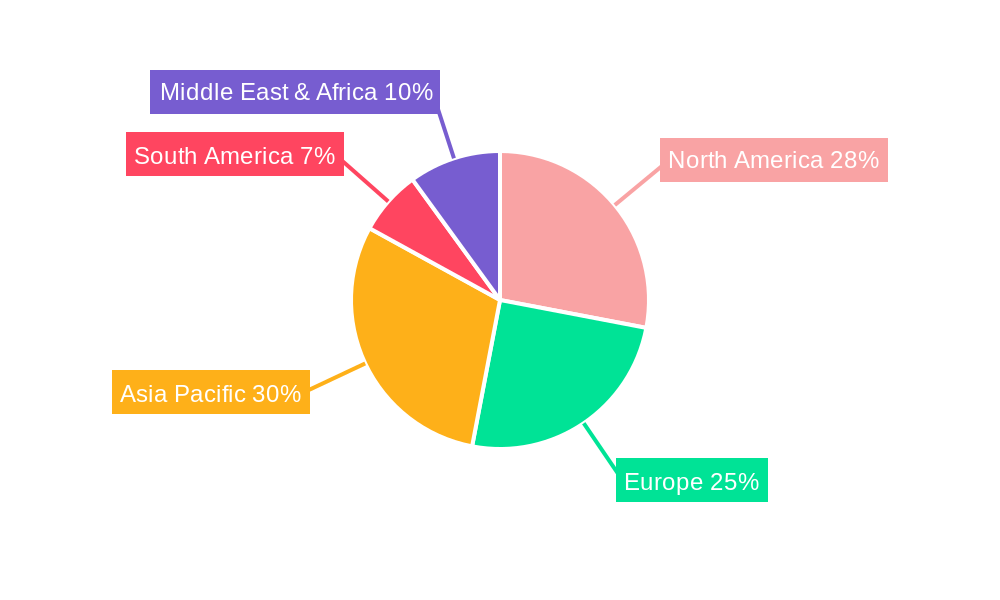
The market is segmented by application into UV Curing Systems, Fluorescence Microscopy, Forensic Illumination, and Others, with UV Curing and Fluorescence Microscopy expected to dominate revenue streams due to continuous technological advancements and increasing industrial and research investments. By type, the Ø5 mm Core Liquid Light Guides are likely to capture a substantial market share, owing to their versatility and suitability for a broad spectrum of applications. Geographically, the Asia Pacific region is anticipated to emerge as the fastest-growing market, driven by rapid industrialization, a burgeoning R&D ecosystem, and significant government initiatives supporting technological development in countries like China and India. North America and Europe, with their established advanced manufacturing sectors and leading research institutions, will continue to represent substantial markets. Key players like Lumatec, Thorlabs, and Edmund Optics are actively investing in product innovation and strategic collaborations to expand their market presence and capitalize on emerging opportunities.
Liquid Light Guides Market Dynamics & Structure
The global Liquid Light Guides (LLGs) market exhibits a moderately concentrated structure, with key players like Lumatec, Thorlabs, and Edmund Optics holding significant market share. Technological innovation is a primary driver, fueled by increasing demand for high-intensity, flexible, and precise illumination solutions across various industries. The development of advanced fiber optics and materials science is enabling the creation of LLGs with superior light transmission efficiency and durability. Regulatory frameworks, particularly concerning safety standards in medical and industrial applications, are also influencing product development and market access. Competitive product substitutes include rigid light pipes and advanced LED-based systems, though LLGs maintain an edge in flexibility and remote illumination capabilities. End-user demographics reveal a growing demand from the research and development sector, medical diagnostics, and industrial manufacturing, with a particular surge in demand for applications like UV curing and fluorescence microscopy. Mergers and acquisitions (M&A) are a nascent trend, with smaller, specialized LLG manufacturers being potential acquisition targets for larger optical component providers seeking to broaden their portfolios.
- Market Concentration: Dominated by a few key players, with ongoing consolidation potential.
- Innovation Drivers: Advancements in fiber optics, materials science, and demand for high-performance illumination.
- Regulatory Influence: Emphasis on safety and performance standards across applications.
- Competitive Landscape: LLGs compete with rigid light pipes and advanced LED solutions.
- End-User Focus: Strong growth in R&D, medical diagnostics, and industrial manufacturing.
- M&A Activity: Emerging trend with potential for industry consolidation.
Liquid Light Guides Growth Trends & Insights
The global Liquid Light Guides market is poised for robust expansion, driven by escalating demand for advanced illumination solutions across diverse applications. The market size is projected to witness a Compound Annual Growth Rate (CAGR) of approximately 7.5% from 2025 to 2033, reaching an estimated value of $1,250 million by 2033. This growth trajectory is underpinned by increasing adoption rates in sectors such as fluorescence microscopy, where LLGs offer superior brightness and wavelength flexibility for detailed biological imaging. The UV curing systems segment is also a significant contributor, benefiting from the efficiency and precision of LLG-based curing processes in manufacturing and 3D printing. Technological disruptions are continuously reshaping the market, with advancements in fiber materials leading to enhanced light throughput, reduced signal loss, and improved durability, allowing for operation in harsher environments. Consumer behavior shifts are also playing a crucial role; end-users are increasingly prioritizing integrated illumination systems that offer ease of use, remote operation, and customized solutions. The penetration of LLGs in niche applications, such as forensic illumination for enhanced evidence detection, is also on the rise due to their ability to deliver specific wavelengths with high intensity. The overall market evolution indicates a strong trend towards miniaturization and higher power density in LLG technology, catering to the ever-increasing demands for more sophisticated and compact scientific and industrial equipment. The parent market for optical components and the child market for specialized illumination systems are both showing strong upward momentum, directly benefiting the liquid light guide sector. The estimated market size for LLGs in the base year of 2025 is projected to be $750 million.
Dominant Regions, Countries, or Segments in Liquid Light Guides
The North America region is emerging as a dominant force in the global Liquid Light Guides market, driven by a confluence of factors including robust government funding for research and development, a well-established industrial manufacturing base, and a high concentration of leading academic and research institutions. Specifically, the United States within North America is a significant market, demonstrating substantial growth potential across key application segments. This dominance is further bolstered by strong economic policies that encourage innovation and technological adoption, alongside advanced infrastructure that supports the sophisticated manufacturing and distribution networks required for specialized optical components like LLGs. The Fluorescence Microscopy application segment, a significant child market, is experiencing particularly high demand in North America, fueled by breakthroughs in life sciences, medical diagnostics, and drug discovery. This segment alone is estimated to contribute a substantial portion of the total market revenue.
Furthermore, the Ø5 mm Core Liquid Light Guides segment is exhibiting significant traction, catering to a wide array of applications that require a balance between light throughput and flexibility. The increasing use of these guides in photodynamic therapy, advanced industrial inspection, and high-throughput screening contributes to their market leadership. The presence of major manufacturers and research facilities within North America, coupled with a strong customer base actively seeking cutting-edge optical solutions, solidifies its leading position. The market share within North America for LLGs is estimated to be around 30% of the global market by 2025.
- Dominant Region: North America, with a strong focus on the United States.
- Key Drivers in North America:
- Significant R&D funding and academic institutions.
- Advanced industrial manufacturing capabilities.
- Supportive economic policies for technological innovation.
- Well-developed infrastructure.
- Dominant Application Segment: Fluorescence Microscopy, driving demand for high-performance illumination.
- Dominant Type Segment: Ø5 mm Core Liquid Light Guides, offering versatility for various applications.
- Market Share Potential: North America estimated to hold approximately 30% of the global LLG market by 2025.
Liquid Light Guides Product Landscape
The Liquid Light Guides market is characterized by continuous product innovation, focusing on enhancing light transmission efficiency, spectral purity, and durability. Manufacturers are developing LLGs with advanced liquid core materials and specialized optical fibers to achieve higher power handling capabilities and reduced signal degradation over longer distances. Innovations are geared towards more robust encapsulation techniques to withstand demanding industrial environments and biomedical applications. Unique selling propositions often revolve around customizable lengths, diameters, and connector types to seamlessly integrate with existing scientific and industrial equipment. Technological advancements are enabling LLGs to deliver specific wavelengths with unprecedented precision, crucial for applications like laser-based material processing and advanced spectroscopy.
Key Drivers, Barriers & Challenges in Liquid Light Guides
The Liquid Light Guides market is propelled by several key drivers. The ever-increasing demand for high-intensity and precise illumination in scientific research, particularly in fields like microscopy and spectroscopy, is a primary growth catalyst. Advancements in fiber optic technology are enabling LLGs to achieve greater flexibility, higher light throughput, and improved durability, making them suitable for a wider range of applications. The expanding use of UV curing systems in industries such as printing, electronics, and additive manufacturing presents a significant opportunity.
However, the market faces considerable challenges. The high cost of specialized materials and manufacturing processes can be a barrier to adoption, especially for smaller research labs and emerging markets. Competition from advanced LED-based illumination systems, which offer solid-state reliability and lower maintenance, poses a significant threat. Supply chain disruptions for critical components and raw materials can impact production timelines and costs, as evidenced by xx million units of impact in the past. Regulatory hurdles, particularly for medical-grade LLGs requiring stringent certification, can slow down product development and market entry.
Emerging Opportunities in Liquid Light Guides
Emerging opportunities in the Liquid Light Guides sector lie in untapped markets and innovative applications. The growing demand for portable and field-deployable scientific instrumentation presents an opportunity for developing more robust and compact LLG solutions. Integration with advanced imaging and sensing technologies, such as hyperspectral imaging and augmented reality, could open new avenues. Furthermore, the increasing focus on sustainable manufacturing processes could drive demand for energy-efficient and long-lasting LLG systems for UV curing and photopolymerization. The development of "smart" LLGs with integrated sensors for real-time performance monitoring and feedback also represents a significant growth area.
Growth Accelerators in the Liquid Light Guides Industry
Several catalysts are driving long-term growth in the Liquid Light Guides industry. Technological breakthroughs in fiber optics, leading to improved light transmission efficiency and a broader range of usable wavelengths, are fundamental. Strategic partnerships between LLG manufacturers and equipment providers can accelerate market penetration by offering integrated solutions. Market expansion strategies targeting rapidly growing economies and emerging application areas like advanced materials science and biophotonics are crucial for sustained growth. The continuous innovation in the parent market for optical components directly fuels advancements and adoption within the LLG child market.
Key Players Shaping the Liquid Light Guides Market
- Lumatec
- Thorlabs
- Edmund Optics
- Newport
- CoolLED
- Rofin Australia
- Excelitas Technologies
- Dymax
- Lumencor
- Olympus
- Gradient Lens Corporation
- Nanjing Rogen
Notable Milestones in Liquid Light Guides Sector
- 2019: Launch of new high-power density LLGs by Lumatec, improving UV curing efficiency by 15%.
- 2020: Thorlabs introduces advanced multi-wavelength LLGs for enhanced fluorescence microscopy research.
- 2021: Edmund Optics expands its LLG portfolio with more flexible and durable options for industrial applications.
- 2022: Newport unveils LLGs with reduced chromatic dispersion, enabling more precise spectral applications.
- 2023: CoolLED focuses on miniaturized LLG solutions for portable diagnostic devices.
- 2024: Excelitas Technologies invests in R&D for LLGs with enhanced UV output for advanced photolithography.
In-Depth Liquid Light Guides Market Outlook
The future market outlook for Liquid Light Guides is exceptionally promising, driven by a consistent demand for high-performance illumination solutions. Growth accelerators, including continuous technological advancements in fiber optics and a growing adoption in sophisticated research and industrial processes, are setting a positive trajectory. Strategic partnerships and market expansion into burgeoning application areas will further solidify LLGs' position. The estimated market value is projected to reach $1,250 million by 2033, indicating significant potential for innovation and investment within this dynamic sector.
Liquid Light Guides Segmentation
-
1. Application
- 1.1. UV Curing Systems
- 1.2. Fluorescence Microscopy
- 1.3. Forensic Illumination
- 1.4. Others
-
2. Types
- 2.1. Ø3 mm Core Liquid Light Guides
- 2.2. Ø5 mm Core Liquid Light Guides
- 2.3. Ø8 mm Core Liquid Light Guides
- 2.4. Others
Liquid Light Guides Segmentation By Geography
-
1. North America
- 1.1. United States
- 1.2. Canada
- 1.3. Mexico
-
2. South America
- 2.1. Brazil
- 2.2. Argentina
- 2.3. Rest of South America
-
3. Europe
- 3.1. United Kingdom
- 3.2. Germany
- 3.3. France
- 3.4. Italy
- 3.5. Spain
- 3.6. Russia
- 3.7. Benelux
- 3.8. Nordics
- 3.9. Rest of Europe
-
4. Middle East & Africa
- 4.1. Turkey
- 4.2. Israel
- 4.3. GCC
- 4.4. North Africa
- 4.5. South Africa
- 4.6. Rest of Middle East & Africa
-
5. Asia Pacific
- 5.1. China
- 5.2. India
- 5.3. Japan
- 5.4. South Korea
- 5.5. ASEAN
- 5.6. Oceania
- 5.7. Rest of Asia Pacific
Liquid Light Guides REPORT HIGHLIGHTS
| Aspects | Details |
|---|---|
| Study Period | 2019-2033 |
| Base Year | 2024 |
| Estimated Year | 2025 |
| Forecast Period | 2025-2033 |
| Historical Period | 2019-2024 |
| Growth Rate | CAGR of XX% from 2019-2033 |
| Segmentation |
|
Table of Contents
- 1. Introduction
- 1.1. Research Scope
- 1.2. Market Segmentation
- 1.3. Research Methodology
- 1.4. Definitions and Assumptions
- 2. Executive Summary
- 2.1. Introduction
- 3. Market Dynamics
- 3.1. Introduction
- 3.2. Market Drivers
- 3.3. Market Restrains
- 3.4. Market Trends
- 4. Market Factor Analysis
- 4.1. Porters Five Forces
- 4.2. Supply/Value Chain
- 4.3. PESTEL analysis
- 4.4. Market Entropy
- 4.5. Patent/Trademark Analysis
- 5. Global Liquid Light Guides Analysis, Insights and Forecast, 2019-2031
- 5.1. Market Analysis, Insights and Forecast - by Application
- 5.1.1. UV Curing Systems
- 5.1.2. Fluorescence Microscopy
- 5.1.3. Forensic Illumination
- 5.1.4. Others
- 5.2. Market Analysis, Insights and Forecast - by Types
- 5.2.1. Ø3 mm Core Liquid Light Guides
- 5.2.2. Ø5 mm Core Liquid Light Guides
- 5.2.3. Ø8 mm Core Liquid Light Guides
- 5.2.4. Others
- 5.3. Market Analysis, Insights and Forecast - by Region
- 5.3.1. North America
- 5.3.2. South America
- 5.3.3. Europe
- 5.3.4. Middle East & Africa
- 5.3.5. Asia Pacific
- 5.1. Market Analysis, Insights and Forecast - by Application
- 6. North America Liquid Light Guides Analysis, Insights and Forecast, 2019-2031
- 6.1. Market Analysis, Insights and Forecast - by Application
- 6.1.1. UV Curing Systems
- 6.1.2. Fluorescence Microscopy
- 6.1.3. Forensic Illumination
- 6.1.4. Others
- 6.2. Market Analysis, Insights and Forecast - by Types
- 6.2.1. Ø3 mm Core Liquid Light Guides
- 6.2.2. Ø5 mm Core Liquid Light Guides
- 6.2.3. Ø8 mm Core Liquid Light Guides
- 6.2.4. Others
- 6.1. Market Analysis, Insights and Forecast - by Application
- 7. South America Liquid Light Guides Analysis, Insights and Forecast, 2019-2031
- 7.1. Market Analysis, Insights and Forecast - by Application
- 7.1.1. UV Curing Systems
- 7.1.2. Fluorescence Microscopy
- 7.1.3. Forensic Illumination
- 7.1.4. Others
- 7.2. Market Analysis, Insights and Forecast - by Types
- 7.2.1. Ø3 mm Core Liquid Light Guides
- 7.2.2. Ø5 mm Core Liquid Light Guides
- 7.2.3. Ø8 mm Core Liquid Light Guides
- 7.2.4. Others
- 7.1. Market Analysis, Insights and Forecast - by Application
- 8. Europe Liquid Light Guides Analysis, Insights and Forecast, 2019-2031
- 8.1. Market Analysis, Insights and Forecast - by Application
- 8.1.1. UV Curing Systems
- 8.1.2. Fluorescence Microscopy
- 8.1.3. Forensic Illumination
- 8.1.4. Others
- 8.2. Market Analysis, Insights and Forecast - by Types
- 8.2.1. Ø3 mm Core Liquid Light Guides
- 8.2.2. Ø5 mm Core Liquid Light Guides
- 8.2.3. Ø8 mm Core Liquid Light Guides
- 8.2.4. Others
- 8.1. Market Analysis, Insights and Forecast - by Application
- 9. Middle East & Africa Liquid Light Guides Analysis, Insights and Forecast, 2019-2031
- 9.1. Market Analysis, Insights and Forecast - by Application
- 9.1.1. UV Curing Systems
- 9.1.2. Fluorescence Microscopy
- 9.1.3. Forensic Illumination
- 9.1.4. Others
- 9.2. Market Analysis, Insights and Forecast - by Types
- 9.2.1. Ø3 mm Core Liquid Light Guides
- 9.2.2. Ø5 mm Core Liquid Light Guides
- 9.2.3. Ø8 mm Core Liquid Light Guides
- 9.2.4. Others
- 9.1. Market Analysis, Insights and Forecast - by Application
- 10. Asia Pacific Liquid Light Guides Analysis, Insights and Forecast, 2019-2031
- 10.1. Market Analysis, Insights and Forecast - by Application
- 10.1.1. UV Curing Systems
- 10.1.2. Fluorescence Microscopy
- 10.1.3. Forensic Illumination
- 10.1.4. Others
- 10.2. Market Analysis, Insights and Forecast - by Types
- 10.2.1. Ø3 mm Core Liquid Light Guides
- 10.2.2. Ø5 mm Core Liquid Light Guides
- 10.2.3. Ø8 mm Core Liquid Light Guides
- 10.2.4. Others
- 10.1. Market Analysis, Insights and Forecast - by Application
- 11. Competitive Analysis
- 11.1. Global Market Share Analysis 2024
- 11.2. Company Profiles
- 11.2.1 Lumatec
- 11.2.1.1. Overview
- 11.2.1.2. Products
- 11.2.1.3. SWOT Analysis
- 11.2.1.4. Recent Developments
- 11.2.1.5. Financials (Based on Availability)
- 11.2.2 Thorlabs
- 11.2.2.1. Overview
- 11.2.2.2. Products
- 11.2.2.3. SWOT Analysis
- 11.2.2.4. Recent Developments
- 11.2.2.5. Financials (Based on Availability)
- 11.2.3 Edmund Optics
- 11.2.3.1. Overview
- 11.2.3.2. Products
- 11.2.3.3. SWOT Analysis
- 11.2.3.4. Recent Developments
- 11.2.3.5. Financials (Based on Availability)
- 11.2.4 Newport
- 11.2.4.1. Overview
- 11.2.4.2. Products
- 11.2.4.3. SWOT Analysis
- 11.2.4.4. Recent Developments
- 11.2.4.5. Financials (Based on Availability)
- 11.2.5 CoolLED
- 11.2.5.1. Overview
- 11.2.5.2. Products
- 11.2.5.3. SWOT Analysis
- 11.2.5.4. Recent Developments
- 11.2.5.5. Financials (Based on Availability)
- 11.2.6 Rofin Australia
- 11.2.6.1. Overview
- 11.2.6.2. Products
- 11.2.6.3. SWOT Analysis
- 11.2.6.4. Recent Developments
- 11.2.6.5. Financials (Based on Availability)
- 11.2.7 Excelitas Technologies
- 11.2.7.1. Overview
- 11.2.7.2. Products
- 11.2.7.3. SWOT Analysis
- 11.2.7.4. Recent Developments
- 11.2.7.5. Financials (Based on Availability)
- 11.2.8 Dymax
- 11.2.8.1. Overview
- 11.2.8.2. Products
- 11.2.8.3. SWOT Analysis
- 11.2.8.4. Recent Developments
- 11.2.8.5. Financials (Based on Availability)
- 11.2.9 Lumencor
- 11.2.9.1. Overview
- 11.2.9.2. Products
- 11.2.9.3. SWOT Analysis
- 11.2.9.4. Recent Developments
- 11.2.9.5. Financials (Based on Availability)
- 11.2.10 Olympus
- 11.2.10.1. Overview
- 11.2.10.2. Products
- 11.2.10.3. SWOT Analysis
- 11.2.10.4. Recent Developments
- 11.2.10.5. Financials (Based on Availability)
- 11.2.11 Gradient Lens Corporation
- 11.2.11.1. Overview
- 11.2.11.2. Products
- 11.2.11.3. SWOT Analysis
- 11.2.11.4. Recent Developments
- 11.2.11.5. Financials (Based on Availability)
- 11.2.12 Nanjing Rogen
- 11.2.12.1. Overview
- 11.2.12.2. Products
- 11.2.12.3. SWOT Analysis
- 11.2.12.4. Recent Developments
- 11.2.12.5. Financials (Based on Availability)
- 11.2.1 Lumatec
List of Figures
- Figure 1: Global Liquid Light Guides Revenue Breakdown (million, %) by Region 2024 & 2032
- Figure 2: Global Liquid Light Guides Volume Breakdown (K, %) by Region 2024 & 2032
- Figure 3: North America Liquid Light Guides Revenue (million), by Application 2024 & 2032
- Figure 4: North America Liquid Light Guides Volume (K), by Application 2024 & 2032
- Figure 5: North America Liquid Light Guides Revenue Share (%), by Application 2024 & 2032
- Figure 6: North America Liquid Light Guides Volume Share (%), by Application 2024 & 2032
- Figure 7: North America Liquid Light Guides Revenue (million), by Types 2024 & 2032
- Figure 8: North America Liquid Light Guides Volume (K), by Types 2024 & 2032
- Figure 9: North America Liquid Light Guides Revenue Share (%), by Types 2024 & 2032
- Figure 10: North America Liquid Light Guides Volume Share (%), by Types 2024 & 2032
- Figure 11: North America Liquid Light Guides Revenue (million), by Country 2024 & 2032
- Figure 12: North America Liquid Light Guides Volume (K), by Country 2024 & 2032
- Figure 13: North America Liquid Light Guides Revenue Share (%), by Country 2024 & 2032
- Figure 14: North America Liquid Light Guides Volume Share (%), by Country 2024 & 2032
- Figure 15: South America Liquid Light Guides Revenue (million), by Application 2024 & 2032
- Figure 16: South America Liquid Light Guides Volume (K), by Application 2024 & 2032
- Figure 17: South America Liquid Light Guides Revenue Share (%), by Application 2024 & 2032
- Figure 18: South America Liquid Light Guides Volume Share (%), by Application 2024 & 2032
- Figure 19: South America Liquid Light Guides Revenue (million), by Types 2024 & 2032
- Figure 20: South America Liquid Light Guides Volume (K), by Types 2024 & 2032
- Figure 21: South America Liquid Light Guides Revenue Share (%), by Types 2024 & 2032
- Figure 22: South America Liquid Light Guides Volume Share (%), by Types 2024 & 2032
- Figure 23: South America Liquid Light Guides Revenue (million), by Country 2024 & 2032
- Figure 24: South America Liquid Light Guides Volume (K), by Country 2024 & 2032
- Figure 25: South America Liquid Light Guides Revenue Share (%), by Country 2024 & 2032
- Figure 26: South America Liquid Light Guides Volume Share (%), by Country 2024 & 2032
- Figure 27: Europe Liquid Light Guides Revenue (million), by Application 2024 & 2032
- Figure 28: Europe Liquid Light Guides Volume (K), by Application 2024 & 2032
- Figure 29: Europe Liquid Light Guides Revenue Share (%), by Application 2024 & 2032
- Figure 30: Europe Liquid Light Guides Volume Share (%), by Application 2024 & 2032
- Figure 31: Europe Liquid Light Guides Revenue (million), by Types 2024 & 2032
- Figure 32: Europe Liquid Light Guides Volume (K), by Types 2024 & 2032
- Figure 33: Europe Liquid Light Guides Revenue Share (%), by Types 2024 & 2032
- Figure 34: Europe Liquid Light Guides Volume Share (%), by Types 2024 & 2032
- Figure 35: Europe Liquid Light Guides Revenue (million), by Country 2024 & 2032
- Figure 36: Europe Liquid Light Guides Volume (K), by Country 2024 & 2032
- Figure 37: Europe Liquid Light Guides Revenue Share (%), by Country 2024 & 2032
- Figure 38: Europe Liquid Light Guides Volume Share (%), by Country 2024 & 2032
- Figure 39: Middle East & Africa Liquid Light Guides Revenue (million), by Application 2024 & 2032
- Figure 40: Middle East & Africa Liquid Light Guides Volume (K), by Application 2024 & 2032
- Figure 41: Middle East & Africa Liquid Light Guides Revenue Share (%), by Application 2024 & 2032
- Figure 42: Middle East & Africa Liquid Light Guides Volume Share (%), by Application 2024 & 2032
- Figure 43: Middle East & Africa Liquid Light Guides Revenue (million), by Types 2024 & 2032
- Figure 44: Middle East & Africa Liquid Light Guides Volume (K), by Types 2024 & 2032
- Figure 45: Middle East & Africa Liquid Light Guides Revenue Share (%), by Types 2024 & 2032
- Figure 46: Middle East & Africa Liquid Light Guides Volume Share (%), by Types 2024 & 2032
- Figure 47: Middle East & Africa Liquid Light Guides Revenue (million), by Country 2024 & 2032
- Figure 48: Middle East & Africa Liquid Light Guides Volume (K), by Country 2024 & 2032
- Figure 49: Middle East & Africa Liquid Light Guides Revenue Share (%), by Country 2024 & 2032
- Figure 50: Middle East & Africa Liquid Light Guides Volume Share (%), by Country 2024 & 2032
- Figure 51: Asia Pacific Liquid Light Guides Revenue (million), by Application 2024 & 2032
- Figure 52: Asia Pacific Liquid Light Guides Volume (K), by Application 2024 & 2032
- Figure 53: Asia Pacific Liquid Light Guides Revenue Share (%), by Application 2024 & 2032
- Figure 54: Asia Pacific Liquid Light Guides Volume Share (%), by Application 2024 & 2032
- Figure 55: Asia Pacific Liquid Light Guides Revenue (million), by Types 2024 & 2032
- Figure 56: Asia Pacific Liquid Light Guides Volume (K), by Types 2024 & 2032
- Figure 57: Asia Pacific Liquid Light Guides Revenue Share (%), by Types 2024 & 2032
- Figure 58: Asia Pacific Liquid Light Guides Volume Share (%), by Types 2024 & 2032
- Figure 59: Asia Pacific Liquid Light Guides Revenue (million), by Country 2024 & 2032
- Figure 60: Asia Pacific Liquid Light Guides Volume (K), by Country 2024 & 2032
- Figure 61: Asia Pacific Liquid Light Guides Revenue Share (%), by Country 2024 & 2032
- Figure 62: Asia Pacific Liquid Light Guides Volume Share (%), by Country 2024 & 2032
List of Tables
- Table 1: Global Liquid Light Guides Revenue million Forecast, by Region 2019 & 2032
- Table 2: Global Liquid Light Guides Volume K Forecast, by Region 2019 & 2032
- Table 3: Global Liquid Light Guides Revenue million Forecast, by Application 2019 & 2032
- Table 4: Global Liquid Light Guides Volume K Forecast, by Application 2019 & 2032
- Table 5: Global Liquid Light Guides Revenue million Forecast, by Types 2019 & 2032
- Table 6: Global Liquid Light Guides Volume K Forecast, by Types 2019 & 2032
- Table 7: Global Liquid Light Guides Revenue million Forecast, by Region 2019 & 2032
- Table 8: Global Liquid Light Guides Volume K Forecast, by Region 2019 & 2032
- Table 9: Global Liquid Light Guides Revenue million Forecast, by Application 2019 & 2032
- Table 10: Global Liquid Light Guides Volume K Forecast, by Application 2019 & 2032
- Table 11: Global Liquid Light Guides Revenue million Forecast, by Types 2019 & 2032
- Table 12: Global Liquid Light Guides Volume K Forecast, by Types 2019 & 2032
- Table 13: Global Liquid Light Guides Revenue million Forecast, by Country 2019 & 2032
- Table 14: Global Liquid Light Guides Volume K Forecast, by Country 2019 & 2032
- Table 15: United States Liquid Light Guides Revenue (million) Forecast, by Application 2019 & 2032
- Table 16: United States Liquid Light Guides Volume (K) Forecast, by Application 2019 & 2032
- Table 17: Canada Liquid Light Guides Revenue (million) Forecast, by Application 2019 & 2032
- Table 18: Canada Liquid Light Guides Volume (K) Forecast, by Application 2019 & 2032
- Table 19: Mexico Liquid Light Guides Revenue (million) Forecast, by Application 2019 & 2032
- Table 20: Mexico Liquid Light Guides Volume (K) Forecast, by Application 2019 & 2032
- Table 21: Global Liquid Light Guides Revenue million Forecast, by Application 2019 & 2032
- Table 22: Global Liquid Light Guides Volume K Forecast, by Application 2019 & 2032
- Table 23: Global Liquid Light Guides Revenue million Forecast, by Types 2019 & 2032
- Table 24: Global Liquid Light Guides Volume K Forecast, by Types 2019 & 2032
- Table 25: Global Liquid Light Guides Revenue million Forecast, by Country 2019 & 2032
- Table 26: Global Liquid Light Guides Volume K Forecast, by Country 2019 & 2032
- Table 27: Brazil Liquid Light Guides Revenue (million) Forecast, by Application 2019 & 2032
- Table 28: Brazil Liquid Light Guides Volume (K) Forecast, by Application 2019 & 2032
- Table 29: Argentina Liquid Light Guides Revenue (million) Forecast, by Application 2019 & 2032
- Table 30: Argentina Liquid Light Guides Volume (K) Forecast, by Application 2019 & 2032
- Table 31: Rest of South America Liquid Light Guides Revenue (million) Forecast, by Application 2019 & 2032
- Table 32: Rest of South America Liquid Light Guides Volume (K) Forecast, by Application 2019 & 2032
- Table 33: Global Liquid Light Guides Revenue million Forecast, by Application 2019 & 2032
- Table 34: Global Liquid Light Guides Volume K Forecast, by Application 2019 & 2032
- Table 35: Global Liquid Light Guides Revenue million Forecast, by Types 2019 & 2032
- Table 36: Global Liquid Light Guides Volume K Forecast, by Types 2019 & 2032
- Table 37: Global Liquid Light Guides Revenue million Forecast, by Country 2019 & 2032
- Table 38: Global Liquid Light Guides Volume K Forecast, by Country 2019 & 2032
- Table 39: United Kingdom Liquid Light Guides Revenue (million) Forecast, by Application 2019 & 2032
- Table 40: United Kingdom Liquid Light Guides Volume (K) Forecast, by Application 2019 & 2032
- Table 41: Germany Liquid Light Guides Revenue (million) Forecast, by Application 2019 & 2032
- Table 42: Germany Liquid Light Guides Volume (K) Forecast, by Application 2019 & 2032
- Table 43: France Liquid Light Guides Revenue (million) Forecast, by Application 2019 & 2032
- Table 44: France Liquid Light Guides Volume (K) Forecast, by Application 2019 & 2032
- Table 45: Italy Liquid Light Guides Revenue (million) Forecast, by Application 2019 & 2032
- Table 46: Italy Liquid Light Guides Volume (K) Forecast, by Application 2019 & 2032
- Table 47: Spain Liquid Light Guides Revenue (million) Forecast, by Application 2019 & 2032
- Table 48: Spain Liquid Light Guides Volume (K) Forecast, by Application 2019 & 2032
- Table 49: Russia Liquid Light Guides Revenue (million) Forecast, by Application 2019 & 2032
- Table 50: Russia Liquid Light Guides Volume (K) Forecast, by Application 2019 & 2032
- Table 51: Benelux Liquid Light Guides Revenue (million) Forecast, by Application 2019 & 2032
- Table 52: Benelux Liquid Light Guides Volume (K) Forecast, by Application 2019 & 2032
- Table 53: Nordics Liquid Light Guides Revenue (million) Forecast, by Application 2019 & 2032
- Table 54: Nordics Liquid Light Guides Volume (K) Forecast, by Application 2019 & 2032
- Table 55: Rest of Europe Liquid Light Guides Revenue (million) Forecast, by Application 2019 & 2032
- Table 56: Rest of Europe Liquid Light Guides Volume (K) Forecast, by Application 2019 & 2032
- Table 57: Global Liquid Light Guides Revenue million Forecast, by Application 2019 & 2032
- Table 58: Global Liquid Light Guides Volume K Forecast, by Application 2019 & 2032
- Table 59: Global Liquid Light Guides Revenue million Forecast, by Types 2019 & 2032
- Table 60: Global Liquid Light Guides Volume K Forecast, by Types 2019 & 2032
- Table 61: Global Liquid Light Guides Revenue million Forecast, by Country 2019 & 2032
- Table 62: Global Liquid Light Guides Volume K Forecast, by Country 2019 & 2032
- Table 63: Turkey Liquid Light Guides Revenue (million) Forecast, by Application 2019 & 2032
- Table 64: Turkey Liquid Light Guides Volume (K) Forecast, by Application 2019 & 2032
- Table 65: Israel Liquid Light Guides Revenue (million) Forecast, by Application 2019 & 2032
- Table 66: Israel Liquid Light Guides Volume (K) Forecast, by Application 2019 & 2032
- Table 67: GCC Liquid Light Guides Revenue (million) Forecast, by Application 2019 & 2032
- Table 68: GCC Liquid Light Guides Volume (K) Forecast, by Application 2019 & 2032
- Table 69: North Africa Liquid Light Guides Revenue (million) Forecast, by Application 2019 & 2032
- Table 70: North Africa Liquid Light Guides Volume (K) Forecast, by Application 2019 & 2032
- Table 71: South Africa Liquid Light Guides Revenue (million) Forecast, by Application 2019 & 2032
- Table 72: South Africa Liquid Light Guides Volume (K) Forecast, by Application 2019 & 2032
- Table 73: Rest of Middle East & Africa Liquid Light Guides Revenue (million) Forecast, by Application 2019 & 2032
- Table 74: Rest of Middle East & Africa Liquid Light Guides Volume (K) Forecast, by Application 2019 & 2032
- Table 75: Global Liquid Light Guides Revenue million Forecast, by Application 2019 & 2032
- Table 76: Global Liquid Light Guides Volume K Forecast, by Application 2019 & 2032
- Table 77: Global Liquid Light Guides Revenue million Forecast, by Types 2019 & 2032
- Table 78: Global Liquid Light Guides Volume K Forecast, by Types 2019 & 2032
- Table 79: Global Liquid Light Guides Revenue million Forecast, by Country 2019 & 2032
- Table 80: Global Liquid Light Guides Volume K Forecast, by Country 2019 & 2032
- Table 81: China Liquid Light Guides Revenue (million) Forecast, by Application 2019 & 2032
- Table 82: China Liquid Light Guides Volume (K) Forecast, by Application 2019 & 2032
- Table 83: India Liquid Light Guides Revenue (million) Forecast, by Application 2019 & 2032
- Table 84: India Liquid Light Guides Volume (K) Forecast, by Application 2019 & 2032
- Table 85: Japan Liquid Light Guides Revenue (million) Forecast, by Application 2019 & 2032
- Table 86: Japan Liquid Light Guides Volume (K) Forecast, by Application 2019 & 2032
- Table 87: South Korea Liquid Light Guides Revenue (million) Forecast, by Application 2019 & 2032
- Table 88: South Korea Liquid Light Guides Volume (K) Forecast, by Application 2019 & 2032
- Table 89: ASEAN Liquid Light Guides Revenue (million) Forecast, by Application 2019 & 2032
- Table 90: ASEAN Liquid Light Guides Volume (K) Forecast, by Application 2019 & 2032
- Table 91: Oceania Liquid Light Guides Revenue (million) Forecast, by Application 2019 & 2032
- Table 92: Oceania Liquid Light Guides Volume (K) Forecast, by Application 2019 & 2032
- Table 93: Rest of Asia Pacific Liquid Light Guides Revenue (million) Forecast, by Application 2019 & 2032
- Table 94: Rest of Asia Pacific Liquid Light Guides Volume (K) Forecast, by Application 2019 & 2032
Frequently Asked Questions
1. What is the projected Compound Annual Growth Rate (CAGR) of the Liquid Light Guides?
The projected CAGR is approximately XX%.
2. Which companies are prominent players in the Liquid Light Guides?
Key companies in the market include Lumatec, Thorlabs, Edmund Optics, Newport, CoolLED, Rofin Australia, Excelitas Technologies, Dymax, Lumencor, Olympus, Gradient Lens Corporation, Nanjing Rogen.
3. What are the main segments of the Liquid Light Guides?
The market segments include Application, Types.
4. Can you provide details about the market size?
The market size is estimated to be USD XXX million as of 2022.
5. What are some drivers contributing to market growth?
N/A
6. What are the notable trends driving market growth?
N/A
7. Are there any restraints impacting market growth?
N/A
8. Can you provide examples of recent developments in the market?
N/A
9. What pricing options are available for accessing the report?
Pricing options include single-user, multi-user, and enterprise licenses priced at USD 3350.00, USD 5025.00, and USD 6700.00 respectively.
10. Is the market size provided in terms of value or volume?
The market size is provided in terms of value, measured in million and volume, measured in K.
11. Are there any specific market keywords associated with the report?
Yes, the market keyword associated with the report is "Liquid Light Guides," which aids in identifying and referencing the specific market segment covered.
12. How do I determine which pricing option suits my needs best?
The pricing options vary based on user requirements and access needs. Individual users may opt for single-user licenses, while businesses requiring broader access may choose multi-user or enterprise licenses for cost-effective access to the report.
13. Are there any additional resources or data provided in the Liquid Light Guides report?
While the report offers comprehensive insights, it's advisable to review the specific contents or supplementary materials provided to ascertain if additional resources or data are available.
14. How can I stay updated on further developments or reports in the Liquid Light Guides?
To stay informed about further developments, trends, and reports in the Liquid Light Guides, consider subscribing to industry newsletters, following relevant companies and organizations, or regularly checking reputable industry news sources and publications.
Methodology
Step 1 - Identification of Relevant Samples Size from Population Database


Step 2 - Approaches for Defining Global Market Size (Value, Volume* & Price*)

Note*: In applicable scenarios
Step 3 - Data Sources
Primary Research
- Web Analytics
- Survey Reports
- Research Institute
- Latest Research Reports
- Opinion Leaders
Secondary Research
- Annual Reports
- White Paper
- Latest Press Release
- Industry Association
- Paid Database
- Investor Presentations

Step 4 - Data Triangulation
Involves using different sources of information in order to increase the validity of a study
These sources are likely to be stakeholders in a program - participants, other researchers, program staff, other community members, and so on.
Then we put all data in single framework & apply various statistical tools to find out the dynamic on the market.
During the analysis stage, feedback from the stakeholder groups would be compared to determine areas of agreement as well as areas of divergence
