

Key Insights
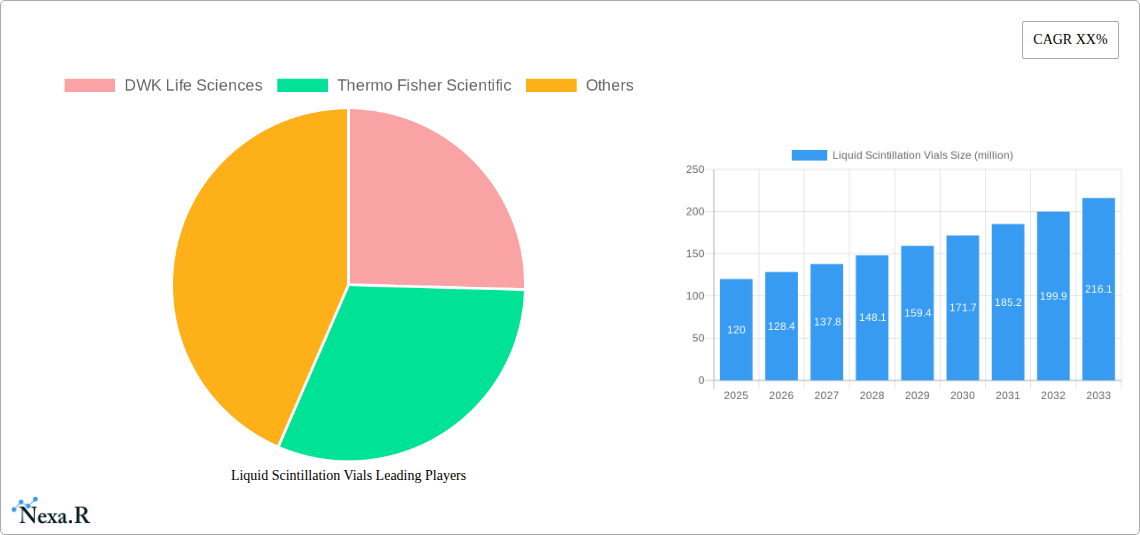
The global Liquid Scintillation Vials market is experiencing robust growth, projected to reach an estimated value of USD 120 million by 2025, with a Compound Annual Growth Rate (CAGR) of 7.5% expected from 2025 to 2033. This expansion is primarily fueled by the increasing demand for advanced diagnostic and research tools across various life science sectors. Key applications, such as Liquid Scintillation Counting (LSC) and Beta/Gamma Counting, are witnessing significant adoption due to their critical role in radioisotope detection and quantification, essential for drug discovery, environmental monitoring, and biomedical research. The market's segmentation by type, with Borosilicate, HDPE, and PET vials catering to different handling and storage requirements, reflects a mature market offering diverse solutions. Major players like DWK Life Sciences and Thermo Fisher Scientific are instrumental in driving innovation and market penetration through their extensive product portfolios and global distribution networks.
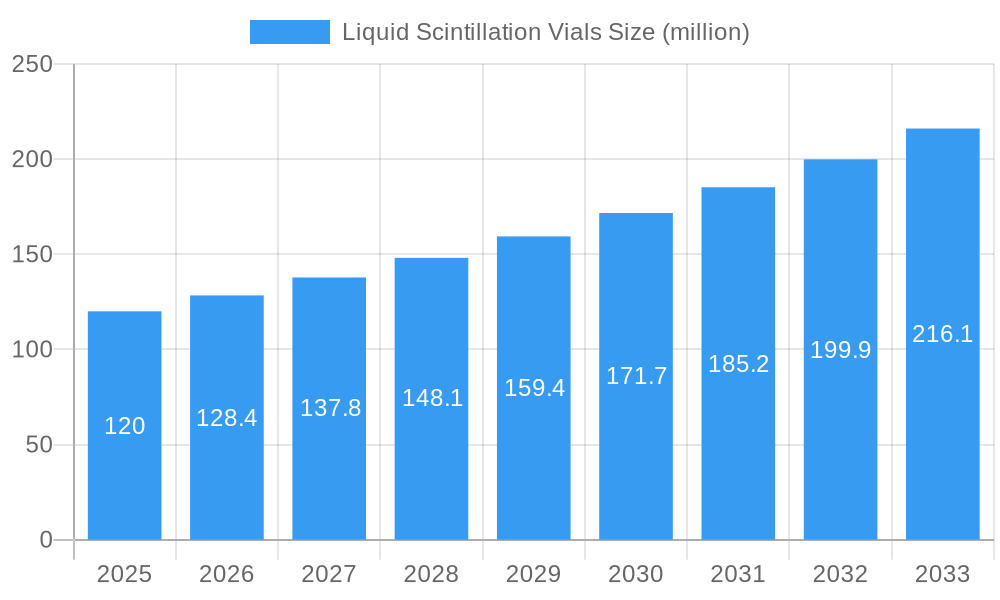
Liquid Scintillation Vials Market Size (In Million)
The market is further propelled by the rising prevalence of chronic diseases, necessitating more sophisticated research and development, and a growing emphasis on nuclear medicine. Technological advancements in vial materials, enhancing sample integrity and reducing background radiation, also contribute to market dynamics. However, the market faces certain restraints, including the high cost of advanced scintillation counting equipment and stringent regulatory frameworks governing radioactive material handling, which could temper growth in specific regions. Despite these challenges, the sustained investment in life sciences research and the increasing utility of radioisotopes in scientific exploration are expected to maintain a positive trajectory for the Liquid Scintillation Vials market throughout the forecast period, especially within key regions like North America and Europe, which are at the forefront of scientific innovation and application.
Liquid Scintillation Vials Company Market Share
Comprehensive Report: Liquid Scintillation Vials Market Analysis 2019–2033
This in-depth report provides a detailed analysis of the global Liquid Scintillation Vials market, covering its dynamics, growth trends, regional dominance, product landscape, key drivers, challenges, emerging opportunities, and major players. Leveraging extensive historical data and forward-looking projections, this report offers critical insights for stakeholders, researchers, and industry professionals. The study encompasses the historical period from 2019 to 2024, with the base year set at 2025 and a forecast period extending to 2033.
Liquid Scintillation Vials Market Dynamics & Structure
The global Liquid Scintillation Vials market exhibits a moderate concentration, with key players like DWK Life Sciences and Thermo Fisher Scientific holding significant influence. Technological innovation is a primary driver, fueled by the increasing demand for high-sensitivity and accuracy in radioisotope detection across diverse scientific disciplines. Stringent regulatory frameworks governing radiation handling and sample integrity in nuclear medicine, research, and environmental monitoring also shape market development. While direct substitutes for liquid scintillation counting vials are limited, advancements in alternative detection technologies present a competitive challenge. End-user demographics are primarily composed of research institutions, pharmaceutical and biotechnology companies, environmental testing laboratories, and healthcare facilities. Mergers and acquisitions (M&A) trends, though not extensively documented in terms of deal volumes, indicate strategic consolidations aimed at expanding product portfolios and market reach. For instance, companies are actively seeking to integrate vial manufacturing with scintillation cocktail production for a more comprehensive offering. Innovation barriers include the high cost of specialized manufacturing equipment and the need for rigorous quality control to meet precise performance specifications.
- Market Concentration: Moderate, with dominance by a few key players.
- Technological Innovation Drivers: Demand for higher sensitivity and accuracy, miniaturization.
- Regulatory Frameworks: Strict guidelines for radiation safety and sample integrity.
- Competitive Product Substitutes: Emerging alternative detection technologies.
- End-User Demographics: Research institutions, pharma/biotech, environmental labs, healthcare.
- M&A Trends: Strategic consolidations for portfolio expansion.
- Innovation Barriers: High manufacturing costs, rigorous quality control requirements.
Liquid Scintillation Vials Growth Trends & Insights
The global Liquid Scintillation Vials market has experienced consistent growth, driven by the expanding applications of liquid scintillation counting (LSC) in areas such as drug discovery, environmental monitoring, and biomedical research. The market size is projected to witness a robust Compound Annual Growth Rate (CAGR) of approximately 5.5% during the forecast period. This upward trajectory is underpinned by increasing investments in life sciences R&D and a growing awareness of the need for accurate radioisotope detection in various diagnostic and analytical procedures. Adoption rates are particularly high in developed economies due to advanced healthcare infrastructure and a strong research ecosystem. Technological disruptions, including the development of vials with enhanced chemical resistance and improved light transmission properties, are further stimulating market penetration. Consumer behavior shifts towards demand for more sustainable and cost-effective vial solutions are also influencing product development. The market penetration for specialized LSC vials is estimated to be around 65% globally, with significant room for growth in emerging economies. The increasing prevalence of PET imaging in diagnostics and research directly translates to higher demand for compatible scintillation vials. Furthermore, the development of automated LSC systems necessitates highly standardized and precisely engineered vials.
Dominant Regions, Countries, or Segments in Liquid Scintillation Vials
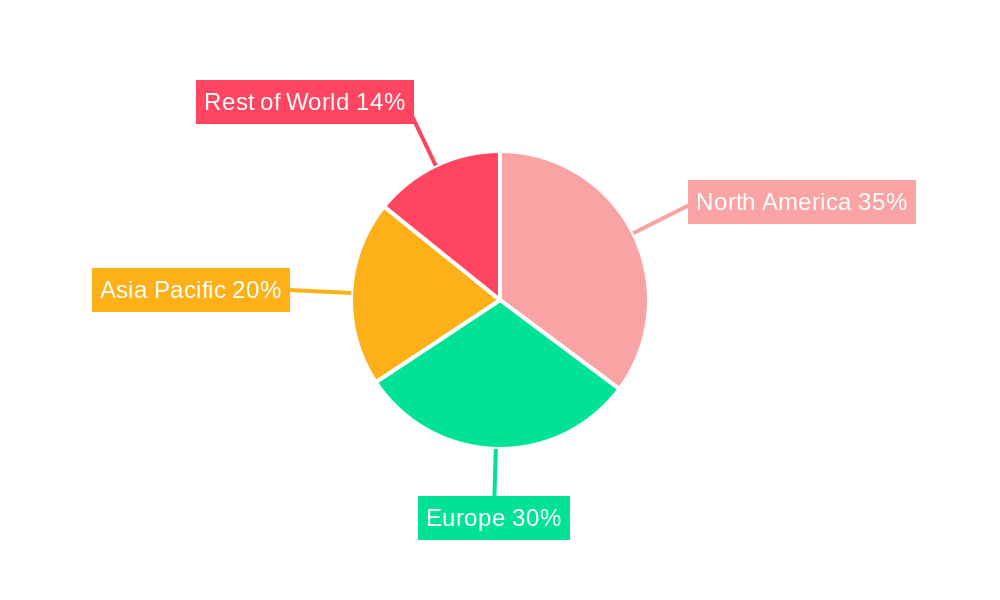
North America is emerging as the dominant region in the Liquid Scintillation Vials market, primarily driven by the robust pharmaceutical and biotechnology sectors in the United States. The substantial investments in life sciences research and development, coupled with a strong presence of academic institutions and contract research organizations (CROs), fuel a consistent demand for LSC vials. Countries like the United States and Canada benefit from advanced healthcare infrastructure and stringent environmental regulations, necessitating regular radioisotope analysis.
Within the Application segment, Liquid Scintillation Counting is the largest and most rapidly growing segment, accounting for an estimated 70% of the market share. This dominance is attributed to its widespread use in drug metabolism and pharmacokinetic (DMPK) studies, environmental radiochemical analysis, and basic research involving radioisotopes. Beta/Gamma Counting represents the second-largest application, driven by nuclear medicine and industrial applications. The Other application segment, encompassing areas like material science and geochronology, is expected to witness moderate growth.
In terms of Types, the Borosilicate Type vials hold a significant market share, estimated at approximately 60%, due to their superior chemical inertness, thermal stability, and resistance to radiation-induced degradation, making them ideal for a wide range of applications and challenging sample matrices. HDPE Type vials are gaining traction due to their shatter-proof nature and cost-effectiveness, particularly for routine applications where extreme chemical resistance is not paramount. PET Type vials offer a balance of clarity and affordability, catering to specific research needs. The growth potential in emerging economies within Asia-Pacific and Latin America is substantial, driven by increasing investments in research infrastructure and a growing number of LSC applications in these regions.
Liquid Scintillation Vials Product Landscape
The Liquid Scintillation Vials product landscape is characterized by ongoing innovation aimed at enhancing performance and user convenience. Manufacturers are focusing on developing vials with superior optical clarity for optimized light yield, increased chemical resistance to accommodate a wider array of sample matrices, and improved sealing capabilities to prevent sample evaporation and contamination. Advanced materials like specialized borosilicate glass and high-density polyethylene (HDPE) are employed to meet specific application requirements. Unique selling propositions include vials designed for automated counters, low-background radiation detection, and compatibility with a diverse range of scintillation cocktails. Technological advancements include the introduction of pre-sterilized vials and vials with enhanced surface treatments to minimize adsorption of radioisotopes.
Key Drivers, Barriers & Challenges in Liquid Scintillation Vials
Key Drivers:
- Expanding R&D Investments: Increased funding in life sciences, particularly in drug discovery and development, drives demand for LSC.
- Advancements in LSC Technology: Development of more sensitive and automated LSC instruments necessitates high-quality vials.
- Growing Environmental Monitoring: The need to detect and quantify radioisotopes in environmental samples fuels market growth.
- Rise of Nuclear Medicine: Increased use of radiopharmaceuticals in diagnostics and therapy boosts demand for related consumables.
Barriers & Challenges:
- High Manufacturing Costs: Specialized equipment and quality control processes lead to higher production expenses.
- Regulatory Compliance: Adhering to strict safety and quality standards can be costly and time-consuming.
- Competition from Alternative Technologies: Newer detection methods can pose a threat to LSC's market share in certain applications.
- Supply Chain Disruptions: Global events can impact the availability of raw materials and finished products, leading to price volatility.
- Stringent Quality Control: Ensuring lot-to-lot consistency and minimal batch variation is crucial and challenging.
Emerging Opportunities in Liquid Scintillation Vials
Emerging opportunities in the Liquid Scintillation Vials market lie in the development of vials for high-throughput screening applications, integrating them with novel scintillation cocktails that offer enhanced performance and reduced toxicity. The growing field of personalized medicine and diagnostics presents a significant opportunity for specialized vials catering to specific biomarker detection. Furthermore, there is a growing demand for sustainable and eco-friendly vial materials and manufacturing processes. Untapped markets in developing economies, driven by increasing investments in research infrastructure, also represent a substantial growth avenue. The integration of LSC with microfluidic devices is another promising area for innovation.
Growth Accelerators in the Liquid Scintillation Vials Industry
Technological breakthroughs in vial material science, leading to enhanced durability and improved signal-to-noise ratios, are significant growth accelerators. Strategic partnerships between vial manufacturers and scintillation cocktail producers can lead to integrated solutions that offer superior performance and broader application ranges. Market expansion strategies focusing on emerging economies, coupled with tailored product offerings, will drive long-term growth. The increasing adoption of automated laboratory systems also creates a demand for standardized and reliable vial formats, accelerating market penetration.
Key Players Shaping the Liquid Scintillation Vials Market
- DWK Life Sciences
- Thermo Fisher Scientific
- Simport Scientific
- GenWipe
- ABC Scientific
- Chemlab Instruments
- Labtron Scientific
- Bellco Glass
- VWR International
Notable Milestones in Liquid Scintillation Vials Sector
- 2019: Introduction of new generation borosilicate vials with enhanced UV transmission for improved detection sensitivity.
- 2020: Launch of shatter-proof HDPE vials designed for increased safety in high-volume laboratory settings.
- 2021: Development of pre-filled LSC vials for specific research applications, streamlining laboratory workflows.
- 2022: Advancements in vial coating technologies to minimize sample adsorption and improve recovery rates.
- 2023: Increased focus on sustainable manufacturing practices and recyclable materials for LSC vials.
- 2024: Introduction of vials with improved chemical resistance for use with a wider range of aggressive solvents and sample matrices.
In-Depth Liquid Scintillation Vials Market Outlook
The future outlook for the Liquid Scintillation Vials market is highly positive, driven by continuous advancements in scientific research and diagnostic technologies. Growth accelerators such as technological breakthroughs in vial materials, strategic collaborations, and expansion into emerging markets will propel sustained growth. The increasing demand for precise and reliable radioisotope detection in life sciences, environmental monitoring, and healthcare ensures a robust and evolving market. Strategic opportunities lie in catering to niche applications, developing user-friendly and cost-effective solutions, and embracing sustainable manufacturing practices to meet the evolving demands of the global scientific community.
Liquid Scintillation Vials Segmentation
-
1. Application
- 1.1. Liquid Scintillation Counting
- 1.2. Beta/Gamma Counting
- 1.3. Other
-
2. Types
- 2.1. Borosilicate Type
- 2.2. HDPE Type
- 2.3. PET Type
Liquid Scintillation Vials Segmentation By Geography
-
1. North America
- 1.1. United States
- 1.2. Canada
- 1.3. Mexico
-
2. South America
- 2.1. Brazil
- 2.2. Argentina
- 2.3. Rest of South America
-
3. Europe
- 3.1. United Kingdom
- 3.2. Germany
- 3.3. France
- 3.4. Italy
- 3.5. Spain
- 3.6. Russia
- 3.7. Benelux
- 3.8. Nordics
- 3.9. Rest of Europe
-
4. Middle East & Africa
- 4.1. Turkey
- 4.2. Israel
- 4.3. GCC
- 4.4. North Africa
- 4.5. South Africa
- 4.6. Rest of Middle East & Africa
-
5. Asia Pacific
- 5.1. China
- 5.2. India
- 5.3. Japan
- 5.4. South Korea
- 5.5. ASEAN
- 5.6. Oceania
- 5.7. Rest of Asia Pacific
Liquid Scintillation Vials Regional Market Share
Geographic Coverage of Liquid Scintillation Vials
Liquid Scintillation Vials REPORT HIGHLIGHTS
| Aspects | Details |
|---|---|
| Study Period | 2020-2034 |
| Base Year | 2025 |
| Estimated Year | 2026 |
| Forecast Period | 2026-2034 |
| Historical Period | 2020-2025 |
| Growth Rate | CAGR of 14.46% from 2020-2034 |
| Segmentation |
|
Table of Contents
- 1. Introduction
- 1.1. Research Scope
- 1.2. Market Segmentation
- 1.3. Research Methodology
- 1.4. Definitions and Assumptions
- 2. Executive Summary
- 2.1. Introduction
- 3. Market Dynamics
- 3.1. Introduction
- 3.2. Market Drivers
- 3.3. Market Restrains
- 3.4. Market Trends
- 4. Market Factor Analysis
- 4.1. Porters Five Forces
- 4.2. Supply/Value Chain
- 4.3. PESTEL analysis
- 4.4. Market Entropy
- 4.5. Patent/Trademark Analysis
- 5. Global Liquid Scintillation Vials Analysis, Insights and Forecast, 2020-2032
- 5.1. Market Analysis, Insights and Forecast - by Application
- 5.1.1. Liquid Scintillation Counting
- 5.1.2. Beta/Gamma Counting
- 5.1.3. Other
- 5.2. Market Analysis, Insights and Forecast - by Types
- 5.2.1. Borosilicate Type
- 5.2.2. HDPE Type
- 5.2.3. PET Type
- 5.3. Market Analysis, Insights and Forecast - by Region
- 5.3.1. North America
- 5.3.2. South America
- 5.3.3. Europe
- 5.3.4. Middle East & Africa
- 5.3.5. Asia Pacific
- 5.1. Market Analysis, Insights and Forecast - by Application
- 6. North America Liquid Scintillation Vials Analysis, Insights and Forecast, 2020-2032
- 6.1. Market Analysis, Insights and Forecast - by Application
- 6.1.1. Liquid Scintillation Counting
- 6.1.2. Beta/Gamma Counting
- 6.1.3. Other
- 6.2. Market Analysis, Insights and Forecast - by Types
- 6.2.1. Borosilicate Type
- 6.2.2. HDPE Type
- 6.2.3. PET Type
- 6.1. Market Analysis, Insights and Forecast - by Application
- 7. South America Liquid Scintillation Vials Analysis, Insights and Forecast, 2020-2032
- 7.1. Market Analysis, Insights and Forecast - by Application
- 7.1.1. Liquid Scintillation Counting
- 7.1.2. Beta/Gamma Counting
- 7.1.3. Other
- 7.2. Market Analysis, Insights and Forecast - by Types
- 7.2.1. Borosilicate Type
- 7.2.2. HDPE Type
- 7.2.3. PET Type
- 7.1. Market Analysis, Insights and Forecast - by Application
- 8. Europe Liquid Scintillation Vials Analysis, Insights and Forecast, 2020-2032
- 8.1. Market Analysis, Insights and Forecast - by Application
- 8.1.1. Liquid Scintillation Counting
- 8.1.2. Beta/Gamma Counting
- 8.1.3. Other
- 8.2. Market Analysis, Insights and Forecast - by Types
- 8.2.1. Borosilicate Type
- 8.2.2. HDPE Type
- 8.2.3. PET Type
- 8.1. Market Analysis, Insights and Forecast - by Application
- 9. Middle East & Africa Liquid Scintillation Vials Analysis, Insights and Forecast, 2020-2032
- 9.1. Market Analysis, Insights and Forecast - by Application
- 9.1.1. Liquid Scintillation Counting
- 9.1.2. Beta/Gamma Counting
- 9.1.3. Other
- 9.2. Market Analysis, Insights and Forecast - by Types
- 9.2.1. Borosilicate Type
- 9.2.2. HDPE Type
- 9.2.3. PET Type
- 9.1. Market Analysis, Insights and Forecast - by Application
- 10. Asia Pacific Liquid Scintillation Vials Analysis, Insights and Forecast, 2020-2032
- 10.1. Market Analysis, Insights and Forecast - by Application
- 10.1.1. Liquid Scintillation Counting
- 10.1.2. Beta/Gamma Counting
- 10.1.3. Other
- 10.2. Market Analysis, Insights and Forecast - by Types
- 10.2.1. Borosilicate Type
- 10.2.2. HDPE Type
- 10.2.3. PET Type
- 10.1. Market Analysis, Insights and Forecast - by Application
- 11. Competitive Analysis
- 11.1. Global Market Share Analysis 2025
- 11.2. Company Profiles
- 11.2.1 DWK Life Sciences
- 11.2.1.1. Overview
- 11.2.1.2. Products
- 11.2.1.3. SWOT Analysis
- 11.2.1.4. Recent Developments
- 11.2.1.5. Financials (Based on Availability)
- 11.2.2 Thermo Fisher Scientific
- 11.2.2.1. Overview
- 11.2.2.2. Products
- 11.2.2.3. SWOT Analysis
- 11.2.2.4. Recent Developments
- 11.2.2.5. Financials (Based on Availability)
- 11.2.1 DWK Life Sciences
List of Figures
- Figure 1: Global Liquid Scintillation Vials Revenue Breakdown (undefined, %) by Region 2025 & 2033
- Figure 2: Global Liquid Scintillation Vials Volume Breakdown (K, %) by Region 2025 & 2033
- Figure 3: North America Liquid Scintillation Vials Revenue (undefined), by Application 2025 & 2033
- Figure 4: North America Liquid Scintillation Vials Volume (K), by Application 2025 & 2033
- Figure 5: North America Liquid Scintillation Vials Revenue Share (%), by Application 2025 & 2033
- Figure 6: North America Liquid Scintillation Vials Volume Share (%), by Application 2025 & 2033
- Figure 7: North America Liquid Scintillation Vials Revenue (undefined), by Types 2025 & 2033
- Figure 8: North America Liquid Scintillation Vials Volume (K), by Types 2025 & 2033
- Figure 9: North America Liquid Scintillation Vials Revenue Share (%), by Types 2025 & 2033
- Figure 10: North America Liquid Scintillation Vials Volume Share (%), by Types 2025 & 2033
- Figure 11: North America Liquid Scintillation Vials Revenue (undefined), by Country 2025 & 2033
- Figure 12: North America Liquid Scintillation Vials Volume (K), by Country 2025 & 2033
- Figure 13: North America Liquid Scintillation Vials Revenue Share (%), by Country 2025 & 2033
- Figure 14: North America Liquid Scintillation Vials Volume Share (%), by Country 2025 & 2033
- Figure 15: South America Liquid Scintillation Vials Revenue (undefined), by Application 2025 & 2033
- Figure 16: South America Liquid Scintillation Vials Volume (K), by Application 2025 & 2033
- Figure 17: South America Liquid Scintillation Vials Revenue Share (%), by Application 2025 & 2033
- Figure 18: South America Liquid Scintillation Vials Volume Share (%), by Application 2025 & 2033
- Figure 19: South America Liquid Scintillation Vials Revenue (undefined), by Types 2025 & 2033
- Figure 20: South America Liquid Scintillation Vials Volume (K), by Types 2025 & 2033
- Figure 21: South America Liquid Scintillation Vials Revenue Share (%), by Types 2025 & 2033
- Figure 22: South America Liquid Scintillation Vials Volume Share (%), by Types 2025 & 2033
- Figure 23: South America Liquid Scintillation Vials Revenue (undefined), by Country 2025 & 2033
- Figure 24: South America Liquid Scintillation Vials Volume (K), by Country 2025 & 2033
- Figure 25: South America Liquid Scintillation Vials Revenue Share (%), by Country 2025 & 2033
- Figure 26: South America Liquid Scintillation Vials Volume Share (%), by Country 2025 & 2033
- Figure 27: Europe Liquid Scintillation Vials Revenue (undefined), by Application 2025 & 2033
- Figure 28: Europe Liquid Scintillation Vials Volume (K), by Application 2025 & 2033
- Figure 29: Europe Liquid Scintillation Vials Revenue Share (%), by Application 2025 & 2033
- Figure 30: Europe Liquid Scintillation Vials Volume Share (%), by Application 2025 & 2033
- Figure 31: Europe Liquid Scintillation Vials Revenue (undefined), by Types 2025 & 2033
- Figure 32: Europe Liquid Scintillation Vials Volume (K), by Types 2025 & 2033
- Figure 33: Europe Liquid Scintillation Vials Revenue Share (%), by Types 2025 & 2033
- Figure 34: Europe Liquid Scintillation Vials Volume Share (%), by Types 2025 & 2033
- Figure 35: Europe Liquid Scintillation Vials Revenue (undefined), by Country 2025 & 2033
- Figure 36: Europe Liquid Scintillation Vials Volume (K), by Country 2025 & 2033
- Figure 37: Europe Liquid Scintillation Vials Revenue Share (%), by Country 2025 & 2033
- Figure 38: Europe Liquid Scintillation Vials Volume Share (%), by Country 2025 & 2033
- Figure 39: Middle East & Africa Liquid Scintillation Vials Revenue (undefined), by Application 2025 & 2033
- Figure 40: Middle East & Africa Liquid Scintillation Vials Volume (K), by Application 2025 & 2033
- Figure 41: Middle East & Africa Liquid Scintillation Vials Revenue Share (%), by Application 2025 & 2033
- Figure 42: Middle East & Africa Liquid Scintillation Vials Volume Share (%), by Application 2025 & 2033
- Figure 43: Middle East & Africa Liquid Scintillation Vials Revenue (undefined), by Types 2025 & 2033
- Figure 44: Middle East & Africa Liquid Scintillation Vials Volume (K), by Types 2025 & 2033
- Figure 45: Middle East & Africa Liquid Scintillation Vials Revenue Share (%), by Types 2025 & 2033
- Figure 46: Middle East & Africa Liquid Scintillation Vials Volume Share (%), by Types 2025 & 2033
- Figure 47: Middle East & Africa Liquid Scintillation Vials Revenue (undefined), by Country 2025 & 2033
- Figure 48: Middle East & Africa Liquid Scintillation Vials Volume (K), by Country 2025 & 2033
- Figure 49: Middle East & Africa Liquid Scintillation Vials Revenue Share (%), by Country 2025 & 2033
- Figure 50: Middle East & Africa Liquid Scintillation Vials Volume Share (%), by Country 2025 & 2033
- Figure 51: Asia Pacific Liquid Scintillation Vials Revenue (undefined), by Application 2025 & 2033
- Figure 52: Asia Pacific Liquid Scintillation Vials Volume (K), by Application 2025 & 2033
- Figure 53: Asia Pacific Liquid Scintillation Vials Revenue Share (%), by Application 2025 & 2033
- Figure 54: Asia Pacific Liquid Scintillation Vials Volume Share (%), by Application 2025 & 2033
- Figure 55: Asia Pacific Liquid Scintillation Vials Revenue (undefined), by Types 2025 & 2033
- Figure 56: Asia Pacific Liquid Scintillation Vials Volume (K), by Types 2025 & 2033
- Figure 57: Asia Pacific Liquid Scintillation Vials Revenue Share (%), by Types 2025 & 2033
- Figure 58: Asia Pacific Liquid Scintillation Vials Volume Share (%), by Types 2025 & 2033
- Figure 59: Asia Pacific Liquid Scintillation Vials Revenue (undefined), by Country 2025 & 2033
- Figure 60: Asia Pacific Liquid Scintillation Vials Volume (K), by Country 2025 & 2033
- Figure 61: Asia Pacific Liquid Scintillation Vials Revenue Share (%), by Country 2025 & 2033
- Figure 62: Asia Pacific Liquid Scintillation Vials Volume Share (%), by Country 2025 & 2033
List of Tables
- Table 1: Global Liquid Scintillation Vials Revenue undefined Forecast, by Application 2020 & 2033
- Table 2: Global Liquid Scintillation Vials Volume K Forecast, by Application 2020 & 2033
- Table 3: Global Liquid Scintillation Vials Revenue undefined Forecast, by Types 2020 & 2033
- Table 4: Global Liquid Scintillation Vials Volume K Forecast, by Types 2020 & 2033
- Table 5: Global Liquid Scintillation Vials Revenue undefined Forecast, by Region 2020 & 2033
- Table 6: Global Liquid Scintillation Vials Volume K Forecast, by Region 2020 & 2033
- Table 7: Global Liquid Scintillation Vials Revenue undefined Forecast, by Application 2020 & 2033
- Table 8: Global Liquid Scintillation Vials Volume K Forecast, by Application 2020 & 2033
- Table 9: Global Liquid Scintillation Vials Revenue undefined Forecast, by Types 2020 & 2033
- Table 10: Global Liquid Scintillation Vials Volume K Forecast, by Types 2020 & 2033
- Table 11: Global Liquid Scintillation Vials Revenue undefined Forecast, by Country 2020 & 2033
- Table 12: Global Liquid Scintillation Vials Volume K Forecast, by Country 2020 & 2033
- Table 13: United States Liquid Scintillation Vials Revenue (undefined) Forecast, by Application 2020 & 2033
- Table 14: United States Liquid Scintillation Vials Volume (K) Forecast, by Application 2020 & 2033
- Table 15: Canada Liquid Scintillation Vials Revenue (undefined) Forecast, by Application 2020 & 2033
- Table 16: Canada Liquid Scintillation Vials Volume (K) Forecast, by Application 2020 & 2033
- Table 17: Mexico Liquid Scintillation Vials Revenue (undefined) Forecast, by Application 2020 & 2033
- Table 18: Mexico Liquid Scintillation Vials Volume (K) Forecast, by Application 2020 & 2033
- Table 19: Global Liquid Scintillation Vials Revenue undefined Forecast, by Application 2020 & 2033
- Table 20: Global Liquid Scintillation Vials Volume K Forecast, by Application 2020 & 2033
- Table 21: Global Liquid Scintillation Vials Revenue undefined Forecast, by Types 2020 & 2033
- Table 22: Global Liquid Scintillation Vials Volume K Forecast, by Types 2020 & 2033
- Table 23: Global Liquid Scintillation Vials Revenue undefined Forecast, by Country 2020 & 2033
- Table 24: Global Liquid Scintillation Vials Volume K Forecast, by Country 2020 & 2033
- Table 25: Brazil Liquid Scintillation Vials Revenue (undefined) Forecast, by Application 2020 & 2033
- Table 26: Brazil Liquid Scintillation Vials Volume (K) Forecast, by Application 2020 & 2033
- Table 27: Argentina Liquid Scintillation Vials Revenue (undefined) Forecast, by Application 2020 & 2033
- Table 28: Argentina Liquid Scintillation Vials Volume (K) Forecast, by Application 2020 & 2033
- Table 29: Rest of South America Liquid Scintillation Vials Revenue (undefined) Forecast, by Application 2020 & 2033
- Table 30: Rest of South America Liquid Scintillation Vials Volume (K) Forecast, by Application 2020 & 2033
- Table 31: Global Liquid Scintillation Vials Revenue undefined Forecast, by Application 2020 & 2033
- Table 32: Global Liquid Scintillation Vials Volume K Forecast, by Application 2020 & 2033
- Table 33: Global Liquid Scintillation Vials Revenue undefined Forecast, by Types 2020 & 2033
- Table 34: Global Liquid Scintillation Vials Volume K Forecast, by Types 2020 & 2033
- Table 35: Global Liquid Scintillation Vials Revenue undefined Forecast, by Country 2020 & 2033
- Table 36: Global Liquid Scintillation Vials Volume K Forecast, by Country 2020 & 2033
- Table 37: United Kingdom Liquid Scintillation Vials Revenue (undefined) Forecast, by Application 2020 & 2033
- Table 38: United Kingdom Liquid Scintillation Vials Volume (K) Forecast, by Application 2020 & 2033
- Table 39: Germany Liquid Scintillation Vials Revenue (undefined) Forecast, by Application 2020 & 2033
- Table 40: Germany Liquid Scintillation Vials Volume (K) Forecast, by Application 2020 & 2033
- Table 41: France Liquid Scintillation Vials Revenue (undefined) Forecast, by Application 2020 & 2033
- Table 42: France Liquid Scintillation Vials Volume (K) Forecast, by Application 2020 & 2033
- Table 43: Italy Liquid Scintillation Vials Revenue (undefined) Forecast, by Application 2020 & 2033
- Table 44: Italy Liquid Scintillation Vials Volume (K) Forecast, by Application 2020 & 2033
- Table 45: Spain Liquid Scintillation Vials Revenue (undefined) Forecast, by Application 2020 & 2033
- Table 46: Spain Liquid Scintillation Vials Volume (K) Forecast, by Application 2020 & 2033
- Table 47: Russia Liquid Scintillation Vials Revenue (undefined) Forecast, by Application 2020 & 2033
- Table 48: Russia Liquid Scintillation Vials Volume (K) Forecast, by Application 2020 & 2033
- Table 49: Benelux Liquid Scintillation Vials Revenue (undefined) Forecast, by Application 2020 & 2033
- Table 50: Benelux Liquid Scintillation Vials Volume (K) Forecast, by Application 2020 & 2033
- Table 51: Nordics Liquid Scintillation Vials Revenue (undefined) Forecast, by Application 2020 & 2033
- Table 52: Nordics Liquid Scintillation Vials Volume (K) Forecast, by Application 2020 & 2033
- Table 53: Rest of Europe Liquid Scintillation Vials Revenue (undefined) Forecast, by Application 2020 & 2033
- Table 54: Rest of Europe Liquid Scintillation Vials Volume (K) Forecast, by Application 2020 & 2033
- Table 55: Global Liquid Scintillation Vials Revenue undefined Forecast, by Application 2020 & 2033
- Table 56: Global Liquid Scintillation Vials Volume K Forecast, by Application 2020 & 2033
- Table 57: Global Liquid Scintillation Vials Revenue undefined Forecast, by Types 2020 & 2033
- Table 58: Global Liquid Scintillation Vials Volume K Forecast, by Types 2020 & 2033
- Table 59: Global Liquid Scintillation Vials Revenue undefined Forecast, by Country 2020 & 2033
- Table 60: Global Liquid Scintillation Vials Volume K Forecast, by Country 2020 & 2033
- Table 61: Turkey Liquid Scintillation Vials Revenue (undefined) Forecast, by Application 2020 & 2033
- Table 62: Turkey Liquid Scintillation Vials Volume (K) Forecast, by Application 2020 & 2033
- Table 63: Israel Liquid Scintillation Vials Revenue (undefined) Forecast, by Application 2020 & 2033
- Table 64: Israel Liquid Scintillation Vials Volume (K) Forecast, by Application 2020 & 2033
- Table 65: GCC Liquid Scintillation Vials Revenue (undefined) Forecast, by Application 2020 & 2033
- Table 66: GCC Liquid Scintillation Vials Volume (K) Forecast, by Application 2020 & 2033
- Table 67: North Africa Liquid Scintillation Vials Revenue (undefined) Forecast, by Application 2020 & 2033
- Table 68: North Africa Liquid Scintillation Vials Volume (K) Forecast, by Application 2020 & 2033
- Table 69: South Africa Liquid Scintillation Vials Revenue (undefined) Forecast, by Application 2020 & 2033
- Table 70: South Africa Liquid Scintillation Vials Volume (K) Forecast, by Application 2020 & 2033
- Table 71: Rest of Middle East & Africa Liquid Scintillation Vials Revenue (undefined) Forecast, by Application 2020 & 2033
- Table 72: Rest of Middle East & Africa Liquid Scintillation Vials Volume (K) Forecast, by Application 2020 & 2033
- Table 73: Global Liquid Scintillation Vials Revenue undefined Forecast, by Application 2020 & 2033
- Table 74: Global Liquid Scintillation Vials Volume K Forecast, by Application 2020 & 2033
- Table 75: Global Liquid Scintillation Vials Revenue undefined Forecast, by Types 2020 & 2033
- Table 76: Global Liquid Scintillation Vials Volume K Forecast, by Types 2020 & 2033
- Table 77: Global Liquid Scintillation Vials Revenue undefined Forecast, by Country 2020 & 2033
- Table 78: Global Liquid Scintillation Vials Volume K Forecast, by Country 2020 & 2033
- Table 79: China Liquid Scintillation Vials Revenue (undefined) Forecast, by Application 2020 & 2033
- Table 80: China Liquid Scintillation Vials Volume (K) Forecast, by Application 2020 & 2033
- Table 81: India Liquid Scintillation Vials Revenue (undefined) Forecast, by Application 2020 & 2033
- Table 82: India Liquid Scintillation Vials Volume (K) Forecast, by Application 2020 & 2033
- Table 83: Japan Liquid Scintillation Vials Revenue (undefined) Forecast, by Application 2020 & 2033
- Table 84: Japan Liquid Scintillation Vials Volume (K) Forecast, by Application 2020 & 2033
- Table 85: South Korea Liquid Scintillation Vials Revenue (undefined) Forecast, by Application 2020 & 2033
- Table 86: South Korea Liquid Scintillation Vials Volume (K) Forecast, by Application 2020 & 2033
- Table 87: ASEAN Liquid Scintillation Vials Revenue (undefined) Forecast, by Application 2020 & 2033
- Table 88: ASEAN Liquid Scintillation Vials Volume (K) Forecast, by Application 2020 & 2033
- Table 89: Oceania Liquid Scintillation Vials Revenue (undefined) Forecast, by Application 2020 & 2033
- Table 90: Oceania Liquid Scintillation Vials Volume (K) Forecast, by Application 2020 & 2033
- Table 91: Rest of Asia Pacific Liquid Scintillation Vials Revenue (undefined) Forecast, by Application 2020 & 2033
- Table 92: Rest of Asia Pacific Liquid Scintillation Vials Volume (K) Forecast, by Application 2020 & 2033
Frequently Asked Questions
1. What is the projected Compound Annual Growth Rate (CAGR) of the Liquid Scintillation Vials?
The projected CAGR is approximately 14.46%.
2. Which companies are prominent players in the Liquid Scintillation Vials?
Key companies in the market include DWK Life Sciences, Thermo Fisher Scientific.
3. What are the main segments of the Liquid Scintillation Vials?
The market segments include Application, Types.
4. Can you provide details about the market size?
The market size is estimated to be USD XXX N/A as of 2022.
5. What are some drivers contributing to market growth?
N/A
6. What are the notable trends driving market growth?
N/A
7. Are there any restraints impacting market growth?
N/A
8. Can you provide examples of recent developments in the market?
N/A
9. What pricing options are available for accessing the report?
Pricing options include single-user, multi-user, and enterprise licenses priced at USD 3950.00, USD 5925.00, and USD 7900.00 respectively.
10. Is the market size provided in terms of value or volume?
The market size is provided in terms of value, measured in N/A and volume, measured in K.
11. Are there any specific market keywords associated with the report?
Yes, the market keyword associated with the report is "Liquid Scintillation Vials," which aids in identifying and referencing the specific market segment covered.
12. How do I determine which pricing option suits my needs best?
The pricing options vary based on user requirements and access needs. Individual users may opt for single-user licenses, while businesses requiring broader access may choose multi-user or enterprise licenses for cost-effective access to the report.
13. Are there any additional resources or data provided in the Liquid Scintillation Vials report?
While the report offers comprehensive insights, it's advisable to review the specific contents or supplementary materials provided to ascertain if additional resources or data are available.
14. How can I stay updated on further developments or reports in the Liquid Scintillation Vials?
To stay informed about further developments, trends, and reports in the Liquid Scintillation Vials, consider subscribing to industry newsletters, following relevant companies and organizations, or regularly checking reputable industry news sources and publications.
Methodology
Step 1 - Identification of Relevant Samples Size from Population Database


Step 2 - Approaches for Defining Global Market Size (Value, Volume* & Price*)

Note*: In applicable scenarios
Step 3 - Data Sources
Primary Research
- Web Analytics
- Survey Reports
- Research Institute
- Latest Research Reports
- Opinion Leaders
Secondary Research
- Annual Reports
- White Paper
- Latest Press Release
- Industry Association
- Paid Database
- Investor Presentations

Step 4 - Data Triangulation
Involves using different sources of information in order to increase the validity of a study
These sources are likely to be stakeholders in a program - participants, other researchers, program staff, other community members, and so on.
Then we put all data in single framework & apply various statistical tools to find out the dynamic on the market.
During the analysis stage, feedback from the stakeholder groups would be compared to determine areas of agreement as well as areas of divergence