

Key Insights
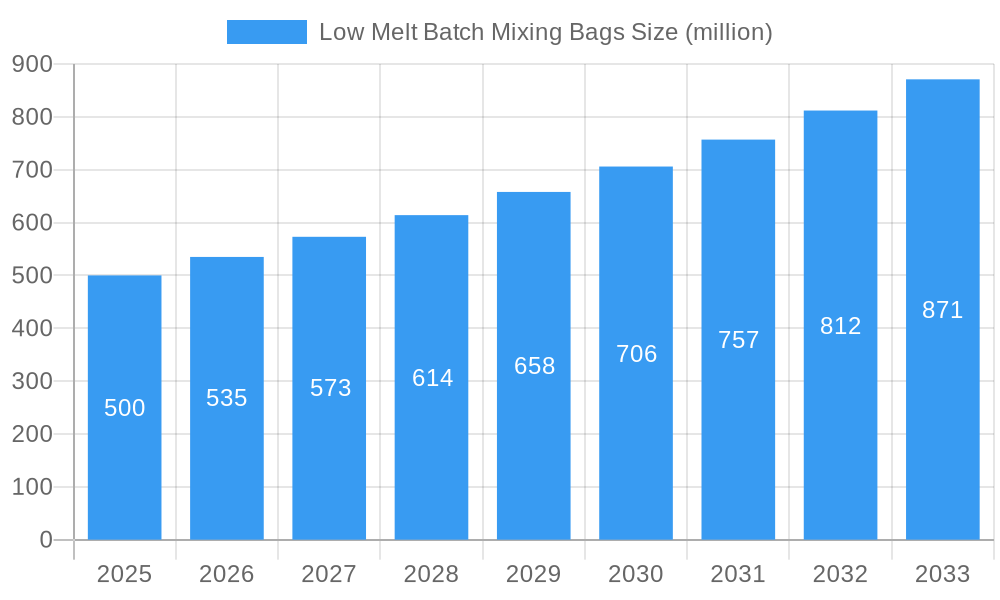
The low melt batch mixing bags market is poised for significant expansion, driven by increasing adoption across key industrial sectors. The market, valued at $1.2 billion in the base year 2024, is projected to grow at a Compound Annual Growth Rate (CAGR) of 7.1%. This growth is attributed to the rising demand for efficient mixing solutions in the chemical, pharmaceutical, and food processing industries. The inherent advantages of low melt bags, including superior material compatibility, reduced mixing cycle times, and enhanced end-product quality, are propelling their preference over conventional methods. Advances in automation and process optimization within manufacturing further underscore market expansion.
Low Melt Batch Mixing Bags Market Size (In Billion)
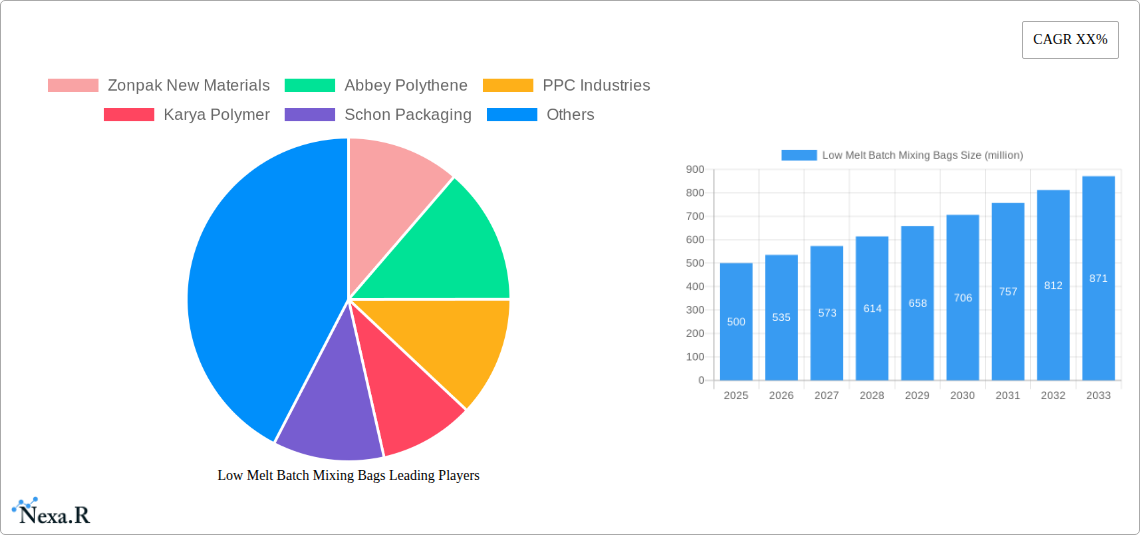
Key industry participants such as Zonpak New Materials, Abbey Polythene, and PPC Industries are instrumental in this growth trajectory through ongoing product innovation and strategic collaborations. Nevertheless, market expansion may be influenced by raw material price volatility and evolving environmental regulations.
Low Melt Batch Mixing Bags Company Market Share
A segment-wise evaluation highlights substantial demand across various applications, with the chemical industry currently leading market share. However, the pharmaceutical and food processing sectors are anticipated to experience robust growth during the forecast period, influenced by stringent hygiene mandates and a heightened emphasis on operational efficiency. Geographically, North America and Europe currently command a dominant market share, while the Asia-Pacific region is positioned for accelerated expansion, fueled by its expanding manufacturing base and increasing industrialization. The competitive arena features both established leaders and emerging entrants, fostering innovation and strategic alliances. This dynamic market landscape presents considerable opportunities and challenges for stakeholders.
Low Melt Batch Mixing Bags Market Report: 2019-2033
This comprehensive report provides an in-depth analysis of the global Low Melt Batch Mixing Bags market, encompassing market dynamics, growth trends, regional analysis, competitive landscape, and future outlook. The study period covers 2019-2033, with 2025 as the base and estimated year. The report is crucial for industry professionals, investors, and strategic decision-makers seeking a clear understanding of this dynamic market segment. This report analyzes the parent market of industrial packaging and the child market of specialized packaging solutions for the chemical and pharmaceutical industries.
Low Melt Batch Mixing Bags Market Dynamics & Structure
The global Low Melt Batch Mixing Bags market is characterized by moderate concentration, with key players holding significant market share. In 2025, the top five companies—Zonpak New Materials, Abbey Polythene, PPC Industries, Karya Polymer, and Schon Packaging—held an estimated xx% of the market. Technological advancements, particularly in material science and automation, are driving innovation. Stringent regulatory frameworks concerning material safety and environmental compliance significantly influence market dynamics. Competitive pressure from alternative mixing solutions (e.g., stainless steel containers) exists, although Low Melt Batch Mixing Bags maintain a strong position due to their cost-effectiveness and ease of use. M&A activity has been relatively low in recent years, with only xx deals recorded between 2019 and 2024. The market size in 2025 is estimated at 200 million units.
- Market Concentration: Moderately concentrated, with top 5 players holding xx% market share in 2025.
- Technological Innovation: Focus on improved material strength, barrier properties, and automation integration.
- Regulatory Landscape: Stringent safety and environmental regulations impacting material choices and manufacturing processes.
- Competitive Substitutes: Stainless steel containers and other specialized mixing equipment present competition.
- End-User Demographics: Primarily chemical, pharmaceutical, and food processing industries.
- M&A Activity: Low, with xx deals recorded between 2019 and 2024.
Low Melt Batch Mixing Bags Growth Trends & Insights
The Low Melt Batch Mixing Bags market experienced steady growth during the historical period (2019-2024), with a CAGR of xx%. This growth is attributed to increasing demand from the chemical and pharmaceutical sectors, driven by rising production volumes and the need for efficient mixing solutions. Technological advancements, including the introduction of improved barrier films and automated filling systems, have further fueled market expansion. Consumer behavior shifts towards sustainable and eco-friendly packaging options are gradually influencing market trends, pushing manufacturers to explore biodegradable and recyclable materials. The market is projected to reach 450 million units by 2033, exhibiting a CAGR of xx% during the forecast period (2025-2033). Market penetration in key end-use segments remains relatively high, suggesting further growth will be driven by expanding applications and geographical reach.
Dominant Regions, Countries, or Segments in Low Melt Batch Mixing Bags
The North American region holds a dominant position in the global Low Melt Batch Mixing Bags market, accounting for approximately xx% of the market share in 2025. This dominance is attributed to factors such as strong pharmaceutical and chemical industries, advanced infrastructure, and favorable regulatory frameworks. Europe follows closely with xx% market share, driven by similar factors. Asia-Pacific is emerging as a significant growth region, with xx% market share in 2025, fueled by increasing industrialization and investments in manufacturing facilities.
- North America: Strong pharmaceutical and chemical industries, advanced infrastructure, and favorable regulatory environment.
- Europe: Similar drivers to North America, with a focus on sustainable packaging solutions.
- Asia-Pacific: Rapid industrialization, increasing investments in manufacturing, and rising demand from emerging economies.
Low Melt Batch Mixing Bags Product Landscape
Low Melt Batch Mixing Bags are primarily constructed from polyethylene (PE) or polypropylene (PP) films, offering varying levels of strength, barrier properties, and heat resistance. Recent innovations focus on enhancing barrier properties to protect sensitive materials, improving seal integrity for safer transport, and incorporating features for easy handling and disposal. The development of biodegradable and compostable options is gaining traction in response to growing environmental concerns.
Key Drivers, Barriers & Challenges in Low Melt Batch Mixing Bags
Key Drivers:
- Rising demand from the chemical and pharmaceutical industries.
- Technological advancements enhancing bag performance and automation.
- Favorable regulatory frameworks in key markets.
Key Challenges:
- Fluctuations in raw material prices (e.g., polyethylene).
- Stringent environmental regulations requiring sustainable solutions.
- Intense competition from alternative mixing solutions. This competition is estimated to reduce market growth by approximately xx% by 2033.
Emerging Opportunities in Low Melt Batch Mixing Bags
- Growing demand for customized solutions tailored to specific industrial needs.
- Expansion into new applications (e.g., food processing, cosmetics).
- Increased adoption of sustainable and eco-friendly packaging options (biodegradable materials).
Growth Accelerators in the Low Melt Batch Mixing Bags Industry
Strategic partnerships between bag manufacturers and automation equipment providers are accelerating market growth by creating integrated solutions that enhance efficiency and reduce costs. Technological breakthroughs in barrier film technology and improved sealing mechanisms are further driving expansion. Market expansion into emerging economies with burgeoning chemical and pharmaceutical industries is a key growth catalyst.
Key Players Shaping the Low Melt Batch Mixing Bags Market
- Zonpak New Materials
- Abbey Polythene
- PPC Industries
- Karya Polymer
- Schon Packaging
- Cargal
- J. Drasner
- Plasto Sac
- Aalmir Plastic
Notable Milestones in Low Melt Batch Mixing Bags Sector
- 2021: Introduction of a new biodegradable Low Melt Batch Mixing Bag by Zonpak New Materials.
- 2022: Abbey Polythene launched an automated filling system compatible with their bags, improving efficiency.
- 2023: PPC Industries secured a major contract with a large pharmaceutical company, expanding its market reach.
In-Depth Low Melt Batch Mixing Bags Market Outlook
The future of the Low Melt Batch Mixing Bags market appears promising, with sustained growth driven by the ongoing expansion of the chemical and pharmaceutical industries, coupled with technological advancements promoting efficiency and sustainability. Strategic investments in research and development, coupled with strategic partnerships, will enable market players to capitalize on emerging opportunities and maintain a competitive edge in this dynamic market segment. The overall market potential remains significant, with ample room for expansion in both developed and emerging markets.
Low Melt Batch Mixing Bags Segmentation
-
1. Application
- 1.1. Chemical
- 1.2. Industrial
-
2. Types
- 2.1. Open Mouth Low Met Bag
- 2.2. Pasted Valve Bag
Low Melt Batch Mixing Bags Segmentation By Geography
-
1. North America
- 1.1. United States
- 1.2. Canada
- 1.3. Mexico
-
2. South America
- 2.1. Brazil
- 2.2. Argentina
- 2.3. Rest of South America
-
3. Europe
- 3.1. United Kingdom
- 3.2. Germany
- 3.3. France
- 3.4. Italy
- 3.5. Spain
- 3.6. Russia
- 3.7. Benelux
- 3.8. Nordics
- 3.9. Rest of Europe
-
4. Middle East & Africa
- 4.1. Turkey
- 4.2. Israel
- 4.3. GCC
- 4.4. North Africa
- 4.5. South Africa
- 4.6. Rest of Middle East & Africa
-
5. Asia Pacific
- 5.1. China
- 5.2. India
- 5.3. Japan
- 5.4. South Korea
- 5.5. ASEAN
- 5.6. Oceania
- 5.7. Rest of Asia Pacific

Low Melt Batch Mixing Bags Regional Market Share
Geographic Coverage of Low Melt Batch Mixing Bags
Low Melt Batch Mixing Bags REPORT HIGHLIGHTS
| Aspects | Details |
|---|---|
| Study Period | 2020-2034 |
| Base Year | 2025 |
| Estimated Year | 2026 |
| Forecast Period | 2026-2034 |
| Historical Period | 2020-2025 |
| Growth Rate | CAGR of 7.1% from 2020-2034 |
| Segmentation |
|
Table of Contents
- 1. Introduction
- 1.1. Research Scope
- 1.2. Market Segmentation
- 1.3. Research Methodology
- 1.4. Definitions and Assumptions
- 2. Executive Summary
- 2.1. Introduction
- 3. Market Dynamics
- 3.1. Introduction
- 3.2. Market Drivers
- 3.3. Market Restrains
- 3.4. Market Trends
- 4. Market Factor Analysis
- 4.1. Porters Five Forces
- 4.2. Supply/Value Chain
- 4.3. PESTEL analysis
- 4.4. Market Entropy
- 4.5. Patent/Trademark Analysis
- 5. Global Low Melt Batch Mixing Bags Analysis, Insights and Forecast, 2020-2032
- 5.1. Market Analysis, Insights and Forecast - by Application
- 5.1.1. Chemical
- 5.1.2. Industrial
- 5.2. Market Analysis, Insights and Forecast - by Types
- 5.2.1. Open Mouth Low Met Bag
- 5.2.2. Pasted Valve Bag
- 5.3. Market Analysis, Insights and Forecast - by Region
- 5.3.1. North America
- 5.3.2. South America
- 5.3.3. Europe
- 5.3.4. Middle East & Africa
- 5.3.5. Asia Pacific
- 5.1. Market Analysis, Insights and Forecast - by Application
- 6. North America Low Melt Batch Mixing Bags Analysis, Insights and Forecast, 2020-2032
- 6.1. Market Analysis, Insights and Forecast - by Application
- 6.1.1. Chemical
- 6.1.2. Industrial
- 6.2. Market Analysis, Insights and Forecast - by Types
- 6.2.1. Open Mouth Low Met Bag
- 6.2.2. Pasted Valve Bag
- 6.1. Market Analysis, Insights and Forecast - by Application
- 7. South America Low Melt Batch Mixing Bags Analysis, Insights and Forecast, 2020-2032
- 7.1. Market Analysis, Insights and Forecast - by Application
- 7.1.1. Chemical
- 7.1.2. Industrial
- 7.2. Market Analysis, Insights and Forecast - by Types
- 7.2.1. Open Mouth Low Met Bag
- 7.2.2. Pasted Valve Bag
- 7.1. Market Analysis, Insights and Forecast - by Application
- 8. Europe Low Melt Batch Mixing Bags Analysis, Insights and Forecast, 2020-2032
- 8.1. Market Analysis, Insights and Forecast - by Application
- 8.1.1. Chemical
- 8.1.2. Industrial
- 8.2. Market Analysis, Insights and Forecast - by Types
- 8.2.1. Open Mouth Low Met Bag
- 8.2.2. Pasted Valve Bag
- 8.1. Market Analysis, Insights and Forecast - by Application
- 9. Middle East & Africa Low Melt Batch Mixing Bags Analysis, Insights and Forecast, 2020-2032
- 9.1. Market Analysis, Insights and Forecast - by Application
- 9.1.1. Chemical
- 9.1.2. Industrial
- 9.2. Market Analysis, Insights and Forecast - by Types
- 9.2.1. Open Mouth Low Met Bag
- 9.2.2. Pasted Valve Bag
- 9.1. Market Analysis, Insights and Forecast - by Application
- 10. Asia Pacific Low Melt Batch Mixing Bags Analysis, Insights and Forecast, 2020-2032
- 10.1. Market Analysis, Insights and Forecast - by Application
- 10.1.1. Chemical
- 10.1.2. Industrial
- 10.2. Market Analysis, Insights and Forecast - by Types
- 10.2.1. Open Mouth Low Met Bag
- 10.2.2. Pasted Valve Bag
- 10.1. Market Analysis, Insights and Forecast - by Application
- 11. Competitive Analysis
- 11.1. Global Market Share Analysis 2025
- 11.2. Company Profiles
- 11.2.1 Zonpak New Materials
- 11.2.1.1. Overview
- 11.2.1.2. Products
- 11.2.1.3. SWOT Analysis
- 11.2.1.4. Recent Developments
- 11.2.1.5. Financials (Based on Availability)
- 11.2.2 Abbey Polythene
- 11.2.2.1. Overview
- 11.2.2.2. Products
- 11.2.2.3. SWOT Analysis
- 11.2.2.4. Recent Developments
- 11.2.2.5. Financials (Based on Availability)
- 11.2.3 PPC Industries
- 11.2.3.1. Overview
- 11.2.3.2. Products
- 11.2.3.3. SWOT Analysis
- 11.2.3.4. Recent Developments
- 11.2.3.5. Financials (Based on Availability)
- 11.2.4 Karya Polymer
- 11.2.4.1. Overview
- 11.2.4.2. Products
- 11.2.4.3. SWOT Analysis
- 11.2.4.4. Recent Developments
- 11.2.4.5. Financials (Based on Availability)
- 11.2.5 Schon Packaging
- 11.2.5.1. Overview
- 11.2.5.2. Products
- 11.2.5.3. SWOT Analysis
- 11.2.5.4. Recent Developments
- 11.2.5.5. Financials (Based on Availability)
- 11.2.6 Cargal
- 11.2.6.1. Overview
- 11.2.6.2. Products
- 11.2.6.3. SWOT Analysis
- 11.2.6.4. Recent Developments
- 11.2.6.5. Financials (Based on Availability)
- 11.2.7 J. Drasner
- 11.2.7.1. Overview
- 11.2.7.2. Products
- 11.2.7.3. SWOT Analysis
- 11.2.7.4. Recent Developments
- 11.2.7.5. Financials (Based on Availability)
- 11.2.8 Plasto Sac
- 11.2.8.1. Overview
- 11.2.8.2. Products
- 11.2.8.3. SWOT Analysis
- 11.2.8.4. Recent Developments
- 11.2.8.5. Financials (Based on Availability)
- 11.2.9 Aalmir Plastic
- 11.2.9.1. Overview
- 11.2.9.2. Products
- 11.2.9.3. SWOT Analysis
- 11.2.9.4. Recent Developments
- 11.2.9.5. Financials (Based on Availability)
- 11.2.1 Zonpak New Materials
List of Figures
- Figure 1: Global Low Melt Batch Mixing Bags Revenue Breakdown (billion, %) by Region 2025 & 2033
- Figure 2: Global Low Melt Batch Mixing Bags Volume Breakdown (K, %) by Region 2025 & 2033
- Figure 3: North America Low Melt Batch Mixing Bags Revenue (billion), by Application 2025 & 2033
- Figure 4: North America Low Melt Batch Mixing Bags Volume (K), by Application 2025 & 2033
- Figure 5: North America Low Melt Batch Mixing Bags Revenue Share (%), by Application 2025 & 2033
- Figure 6: North America Low Melt Batch Mixing Bags Volume Share (%), by Application 2025 & 2033
- Figure 7: North America Low Melt Batch Mixing Bags Revenue (billion), by Types 2025 & 2033
- Figure 8: North America Low Melt Batch Mixing Bags Volume (K), by Types 2025 & 2033
- Figure 9: North America Low Melt Batch Mixing Bags Revenue Share (%), by Types 2025 & 2033
- Figure 10: North America Low Melt Batch Mixing Bags Volume Share (%), by Types 2025 & 2033
- Figure 11: North America Low Melt Batch Mixing Bags Revenue (billion), by Country 2025 & 2033
- Figure 12: North America Low Melt Batch Mixing Bags Volume (K), by Country 2025 & 2033
- Figure 13: North America Low Melt Batch Mixing Bags Revenue Share (%), by Country 2025 & 2033
- Figure 14: North America Low Melt Batch Mixing Bags Volume Share (%), by Country 2025 & 2033
- Figure 15: South America Low Melt Batch Mixing Bags Revenue (billion), by Application 2025 & 2033
- Figure 16: South America Low Melt Batch Mixing Bags Volume (K), by Application 2025 & 2033
- Figure 17: South America Low Melt Batch Mixing Bags Revenue Share (%), by Application 2025 & 2033
- Figure 18: South America Low Melt Batch Mixing Bags Volume Share (%), by Application 2025 & 2033
- Figure 19: South America Low Melt Batch Mixing Bags Revenue (billion), by Types 2025 & 2033
- Figure 20: South America Low Melt Batch Mixing Bags Volume (K), by Types 2025 & 2033
- Figure 21: South America Low Melt Batch Mixing Bags Revenue Share (%), by Types 2025 & 2033
- Figure 22: South America Low Melt Batch Mixing Bags Volume Share (%), by Types 2025 & 2033
- Figure 23: South America Low Melt Batch Mixing Bags Revenue (billion), by Country 2025 & 2033
- Figure 24: South America Low Melt Batch Mixing Bags Volume (K), by Country 2025 & 2033
- Figure 25: South America Low Melt Batch Mixing Bags Revenue Share (%), by Country 2025 & 2033
- Figure 26: South America Low Melt Batch Mixing Bags Volume Share (%), by Country 2025 & 2033
- Figure 27: Europe Low Melt Batch Mixing Bags Revenue (billion), by Application 2025 & 2033
- Figure 28: Europe Low Melt Batch Mixing Bags Volume (K), by Application 2025 & 2033
- Figure 29: Europe Low Melt Batch Mixing Bags Revenue Share (%), by Application 2025 & 2033
- Figure 30: Europe Low Melt Batch Mixing Bags Volume Share (%), by Application 2025 & 2033
- Figure 31: Europe Low Melt Batch Mixing Bags Revenue (billion), by Types 2025 & 2033
- Figure 32: Europe Low Melt Batch Mixing Bags Volume (K), by Types 2025 & 2033
- Figure 33: Europe Low Melt Batch Mixing Bags Revenue Share (%), by Types 2025 & 2033
- Figure 34: Europe Low Melt Batch Mixing Bags Volume Share (%), by Types 2025 & 2033
- Figure 35: Europe Low Melt Batch Mixing Bags Revenue (billion), by Country 2025 & 2033
- Figure 36: Europe Low Melt Batch Mixing Bags Volume (K), by Country 2025 & 2033
- Figure 37: Europe Low Melt Batch Mixing Bags Revenue Share (%), by Country 2025 & 2033
- Figure 38: Europe Low Melt Batch Mixing Bags Volume Share (%), by Country 2025 & 2033
- Figure 39: Middle East & Africa Low Melt Batch Mixing Bags Revenue (billion), by Application 2025 & 2033
- Figure 40: Middle East & Africa Low Melt Batch Mixing Bags Volume (K), by Application 2025 & 2033
- Figure 41: Middle East & Africa Low Melt Batch Mixing Bags Revenue Share (%), by Application 2025 & 2033
- Figure 42: Middle East & Africa Low Melt Batch Mixing Bags Volume Share (%), by Application 2025 & 2033
- Figure 43: Middle East & Africa Low Melt Batch Mixing Bags Revenue (billion), by Types 2025 & 2033
- Figure 44: Middle East & Africa Low Melt Batch Mixing Bags Volume (K), by Types 2025 & 2033
- Figure 45: Middle East & Africa Low Melt Batch Mixing Bags Revenue Share (%), by Types 2025 & 2033
- Figure 46: Middle East & Africa Low Melt Batch Mixing Bags Volume Share (%), by Types 2025 & 2033
- Figure 47: Middle East & Africa Low Melt Batch Mixing Bags Revenue (billion), by Country 2025 & 2033
- Figure 48: Middle East & Africa Low Melt Batch Mixing Bags Volume (K), by Country 2025 & 2033
- Figure 49: Middle East & Africa Low Melt Batch Mixing Bags Revenue Share (%), by Country 2025 & 2033
- Figure 50: Middle East & Africa Low Melt Batch Mixing Bags Volume Share (%), by Country 2025 & 2033
- Figure 51: Asia Pacific Low Melt Batch Mixing Bags Revenue (billion), by Application 2025 & 2033
- Figure 52: Asia Pacific Low Melt Batch Mixing Bags Volume (K), by Application 2025 & 2033
- Figure 53: Asia Pacific Low Melt Batch Mixing Bags Revenue Share (%), by Application 2025 & 2033
- Figure 54: Asia Pacific Low Melt Batch Mixing Bags Volume Share (%), by Application 2025 & 2033
- Figure 55: Asia Pacific Low Melt Batch Mixing Bags Revenue (billion), by Types 2025 & 2033
- Figure 56: Asia Pacific Low Melt Batch Mixing Bags Volume (K), by Types 2025 & 2033
- Figure 57: Asia Pacific Low Melt Batch Mixing Bags Revenue Share (%), by Types 2025 & 2033
- Figure 58: Asia Pacific Low Melt Batch Mixing Bags Volume Share (%), by Types 2025 & 2033
- Figure 59: Asia Pacific Low Melt Batch Mixing Bags Revenue (billion), by Country 2025 & 2033
- Figure 60: Asia Pacific Low Melt Batch Mixing Bags Volume (K), by Country 2025 & 2033
- Figure 61: Asia Pacific Low Melt Batch Mixing Bags Revenue Share (%), by Country 2025 & 2033
- Figure 62: Asia Pacific Low Melt Batch Mixing Bags Volume Share (%), by Country 2025 & 2033
List of Tables
- Table 1: Global Low Melt Batch Mixing Bags Revenue billion Forecast, by Application 2020 & 2033
- Table 2: Global Low Melt Batch Mixing Bags Volume K Forecast, by Application 2020 & 2033
- Table 3: Global Low Melt Batch Mixing Bags Revenue billion Forecast, by Types 2020 & 2033
- Table 4: Global Low Melt Batch Mixing Bags Volume K Forecast, by Types 2020 & 2033
- Table 5: Global Low Melt Batch Mixing Bags Revenue billion Forecast, by Region 2020 & 2033
- Table 6: Global Low Melt Batch Mixing Bags Volume K Forecast, by Region 2020 & 2033
- Table 7: Global Low Melt Batch Mixing Bags Revenue billion Forecast, by Application 2020 & 2033
- Table 8: Global Low Melt Batch Mixing Bags Volume K Forecast, by Application 2020 & 2033
- Table 9: Global Low Melt Batch Mixing Bags Revenue billion Forecast, by Types 2020 & 2033
- Table 10: Global Low Melt Batch Mixing Bags Volume K Forecast, by Types 2020 & 2033
- Table 11: Global Low Melt Batch Mixing Bags Revenue billion Forecast, by Country 2020 & 2033
- Table 12: Global Low Melt Batch Mixing Bags Volume K Forecast, by Country 2020 & 2033
- Table 13: United States Low Melt Batch Mixing Bags Revenue (billion) Forecast, by Application 2020 & 2033
- Table 14: United States Low Melt Batch Mixing Bags Volume (K) Forecast, by Application 2020 & 2033
- Table 15: Canada Low Melt Batch Mixing Bags Revenue (billion) Forecast, by Application 2020 & 2033
- Table 16: Canada Low Melt Batch Mixing Bags Volume (K) Forecast, by Application 2020 & 2033
- Table 17: Mexico Low Melt Batch Mixing Bags Revenue (billion) Forecast, by Application 2020 & 2033
- Table 18: Mexico Low Melt Batch Mixing Bags Volume (K) Forecast, by Application 2020 & 2033
- Table 19: Global Low Melt Batch Mixing Bags Revenue billion Forecast, by Application 2020 & 2033
- Table 20: Global Low Melt Batch Mixing Bags Volume K Forecast, by Application 2020 & 2033
- Table 21: Global Low Melt Batch Mixing Bags Revenue billion Forecast, by Types 2020 & 2033
- Table 22: Global Low Melt Batch Mixing Bags Volume K Forecast, by Types 2020 & 2033
- Table 23: Global Low Melt Batch Mixing Bags Revenue billion Forecast, by Country 2020 & 2033
- Table 24: Global Low Melt Batch Mixing Bags Volume K Forecast, by Country 2020 & 2033
- Table 25: Brazil Low Melt Batch Mixing Bags Revenue (billion) Forecast, by Application 2020 & 2033
- Table 26: Brazil Low Melt Batch Mixing Bags Volume (K) Forecast, by Application 2020 & 2033
- Table 27: Argentina Low Melt Batch Mixing Bags Revenue (billion) Forecast, by Application 2020 & 2033
- Table 28: Argentina Low Melt Batch Mixing Bags Volume (K) Forecast, by Application 2020 & 2033
- Table 29: Rest of South America Low Melt Batch Mixing Bags Revenue (billion) Forecast, by Application 2020 & 2033
- Table 30: Rest of South America Low Melt Batch Mixing Bags Volume (K) Forecast, by Application 2020 & 2033
- Table 31: Global Low Melt Batch Mixing Bags Revenue billion Forecast, by Application 2020 & 2033
- Table 32: Global Low Melt Batch Mixing Bags Volume K Forecast, by Application 2020 & 2033
- Table 33: Global Low Melt Batch Mixing Bags Revenue billion Forecast, by Types 2020 & 2033
- Table 34: Global Low Melt Batch Mixing Bags Volume K Forecast, by Types 2020 & 2033
- Table 35: Global Low Melt Batch Mixing Bags Revenue billion Forecast, by Country 2020 & 2033
- Table 36: Global Low Melt Batch Mixing Bags Volume K Forecast, by Country 2020 & 2033
- Table 37: United Kingdom Low Melt Batch Mixing Bags Revenue (billion) Forecast, by Application 2020 & 2033
- Table 38: United Kingdom Low Melt Batch Mixing Bags Volume (K) Forecast, by Application 2020 & 2033
- Table 39: Germany Low Melt Batch Mixing Bags Revenue (billion) Forecast, by Application 2020 & 2033
- Table 40: Germany Low Melt Batch Mixing Bags Volume (K) Forecast, by Application 2020 & 2033
- Table 41: France Low Melt Batch Mixing Bags Revenue (billion) Forecast, by Application 2020 & 2033
- Table 42: France Low Melt Batch Mixing Bags Volume (K) Forecast, by Application 2020 & 2033
- Table 43: Italy Low Melt Batch Mixing Bags Revenue (billion) Forecast, by Application 2020 & 2033
- Table 44: Italy Low Melt Batch Mixing Bags Volume (K) Forecast, by Application 2020 & 2033
- Table 45: Spain Low Melt Batch Mixing Bags Revenue (billion) Forecast, by Application 2020 & 2033
- Table 46: Spain Low Melt Batch Mixing Bags Volume (K) Forecast, by Application 2020 & 2033
- Table 47: Russia Low Melt Batch Mixing Bags Revenue (billion) Forecast, by Application 2020 & 2033
- Table 48: Russia Low Melt Batch Mixing Bags Volume (K) Forecast, by Application 2020 & 2033
- Table 49: Benelux Low Melt Batch Mixing Bags Revenue (billion) Forecast, by Application 2020 & 2033
- Table 50: Benelux Low Melt Batch Mixing Bags Volume (K) Forecast, by Application 2020 & 2033
- Table 51: Nordics Low Melt Batch Mixing Bags Revenue (billion) Forecast, by Application 2020 & 2033
- Table 52: Nordics Low Melt Batch Mixing Bags Volume (K) Forecast, by Application 2020 & 2033
- Table 53: Rest of Europe Low Melt Batch Mixing Bags Revenue (billion) Forecast, by Application 2020 & 2033
- Table 54: Rest of Europe Low Melt Batch Mixing Bags Volume (K) Forecast, by Application 2020 & 2033
- Table 55: Global Low Melt Batch Mixing Bags Revenue billion Forecast, by Application 2020 & 2033
- Table 56: Global Low Melt Batch Mixing Bags Volume K Forecast, by Application 2020 & 2033
- Table 57: Global Low Melt Batch Mixing Bags Revenue billion Forecast, by Types 2020 & 2033
- Table 58: Global Low Melt Batch Mixing Bags Volume K Forecast, by Types 2020 & 2033
- Table 59: Global Low Melt Batch Mixing Bags Revenue billion Forecast, by Country 2020 & 2033
- Table 60: Global Low Melt Batch Mixing Bags Volume K Forecast, by Country 2020 & 2033
- Table 61: Turkey Low Melt Batch Mixing Bags Revenue (billion) Forecast, by Application 2020 & 2033
- Table 62: Turkey Low Melt Batch Mixing Bags Volume (K) Forecast, by Application 2020 & 2033
- Table 63: Israel Low Melt Batch Mixing Bags Revenue (billion) Forecast, by Application 2020 & 2033
- Table 64: Israel Low Melt Batch Mixing Bags Volume (K) Forecast, by Application 2020 & 2033
- Table 65: GCC Low Melt Batch Mixing Bags Revenue (billion) Forecast, by Application 2020 & 2033
- Table 66: GCC Low Melt Batch Mixing Bags Volume (K) Forecast, by Application 2020 & 2033
- Table 67: North Africa Low Melt Batch Mixing Bags Revenue (billion) Forecast, by Application 2020 & 2033
- Table 68: North Africa Low Melt Batch Mixing Bags Volume (K) Forecast, by Application 2020 & 2033
- Table 69: South Africa Low Melt Batch Mixing Bags Revenue (billion) Forecast, by Application 2020 & 2033
- Table 70: South Africa Low Melt Batch Mixing Bags Volume (K) Forecast, by Application 2020 & 2033
- Table 71: Rest of Middle East & Africa Low Melt Batch Mixing Bags Revenue (billion) Forecast, by Application 2020 & 2033
- Table 72: Rest of Middle East & Africa Low Melt Batch Mixing Bags Volume (K) Forecast, by Application 2020 & 2033
- Table 73: Global Low Melt Batch Mixing Bags Revenue billion Forecast, by Application 2020 & 2033
- Table 74: Global Low Melt Batch Mixing Bags Volume K Forecast, by Application 2020 & 2033
- Table 75: Global Low Melt Batch Mixing Bags Revenue billion Forecast, by Types 2020 & 2033
- Table 76: Global Low Melt Batch Mixing Bags Volume K Forecast, by Types 2020 & 2033
- Table 77: Global Low Melt Batch Mixing Bags Revenue billion Forecast, by Country 2020 & 2033
- Table 78: Global Low Melt Batch Mixing Bags Volume K Forecast, by Country 2020 & 2033
- Table 79: China Low Melt Batch Mixing Bags Revenue (billion) Forecast, by Application 2020 & 2033
- Table 80: China Low Melt Batch Mixing Bags Volume (K) Forecast, by Application 2020 & 2033
- Table 81: India Low Melt Batch Mixing Bags Revenue (billion) Forecast, by Application 2020 & 2033
- Table 82: India Low Melt Batch Mixing Bags Volume (K) Forecast, by Application 2020 & 2033
- Table 83: Japan Low Melt Batch Mixing Bags Revenue (billion) Forecast, by Application 2020 & 2033
- Table 84: Japan Low Melt Batch Mixing Bags Volume (K) Forecast, by Application 2020 & 2033
- Table 85: South Korea Low Melt Batch Mixing Bags Revenue (billion) Forecast, by Application 2020 & 2033
- Table 86: South Korea Low Melt Batch Mixing Bags Volume (K) Forecast, by Application 2020 & 2033
- Table 87: ASEAN Low Melt Batch Mixing Bags Revenue (billion) Forecast, by Application 2020 & 2033
- Table 88: ASEAN Low Melt Batch Mixing Bags Volume (K) Forecast, by Application 2020 & 2033
- Table 89: Oceania Low Melt Batch Mixing Bags Revenue (billion) Forecast, by Application 2020 & 2033
- Table 90: Oceania Low Melt Batch Mixing Bags Volume (K) Forecast, by Application 2020 & 2033
- Table 91: Rest of Asia Pacific Low Melt Batch Mixing Bags Revenue (billion) Forecast, by Application 2020 & 2033
- Table 92: Rest of Asia Pacific Low Melt Batch Mixing Bags Volume (K) Forecast, by Application 2020 & 2033
Frequently Asked Questions
1. What is the projected Compound Annual Growth Rate (CAGR) of the Low Melt Batch Mixing Bags?
The projected CAGR is approximately 7.1%.
2. Which companies are prominent players in the Low Melt Batch Mixing Bags?
Key companies in the market include Zonpak New Materials, Abbey Polythene, PPC Industries, Karya Polymer, Schon Packaging, Cargal, J. Drasner, Plasto Sac, Aalmir Plastic.
3. What are the main segments of the Low Melt Batch Mixing Bags?
The market segments include Application, Types.
4. Can you provide details about the market size?
The market size is estimated to be USD 1.2 billion as of 2022.
5. What are some drivers contributing to market growth?
N/A
6. What are the notable trends driving market growth?
N/A
7. Are there any restraints impacting market growth?
N/A
8. Can you provide examples of recent developments in the market?
N/A
9. What pricing options are available for accessing the report?
Pricing options include single-user, multi-user, and enterprise licenses priced at USD 3350.00, USD 5025.00, and USD 6700.00 respectively.
10. Is the market size provided in terms of value or volume?
The market size is provided in terms of value, measured in billion and volume, measured in K.
11. Are there any specific market keywords associated with the report?
Yes, the market keyword associated with the report is "Low Melt Batch Mixing Bags," which aids in identifying and referencing the specific market segment covered.
12. How do I determine which pricing option suits my needs best?
The pricing options vary based on user requirements and access needs. Individual users may opt for single-user licenses, while businesses requiring broader access may choose multi-user or enterprise licenses for cost-effective access to the report.
13. Are there any additional resources or data provided in the Low Melt Batch Mixing Bags report?
While the report offers comprehensive insights, it's advisable to review the specific contents or supplementary materials provided to ascertain if additional resources or data are available.
14. How can I stay updated on further developments or reports in the Low Melt Batch Mixing Bags?
To stay informed about further developments, trends, and reports in the Low Melt Batch Mixing Bags, consider subscribing to industry newsletters, following relevant companies and organizations, or regularly checking reputable industry news sources and publications.
Methodology
Step 1 - Identification of Relevant Samples Size from Population Database


Step 2 - Approaches for Defining Global Market Size (Value, Volume* & Price*)

Note*: In applicable scenarios
Step 3 - Data Sources
Primary Research
- Web Analytics
- Survey Reports
- Research Institute
- Latest Research Reports
- Opinion Leaders
Secondary Research
- Annual Reports
- White Paper
- Latest Press Release
- Industry Association
- Paid Database
- Investor Presentations

Step 4 - Data Triangulation
Involves using different sources of information in order to increase the validity of a study
These sources are likely to be stakeholders in a program - participants, other researchers, program staff, other community members, and so on.
Then we put all data in single framework & apply various statistical tools to find out the dynamic on the market.
During the analysis stage, feedback from the stakeholder groups would be compared to determine areas of agreement as well as areas of divergence