

Key Insights
The Middle East & Africa (MEA) smartphone market is poised for substantial expansion. Projected to reach a market size of $1708.7 million by 2024, the sector is expected to grow at a Compound Annual Growth Rate (CAGR) of 12.3% from 2024 to 2033. This robust growth is fueled by increasing smartphone adoption across developing African nations, driven by rising disposable incomes and the availability of affordable devices. The widespread use of mobile money services and the escalating demand for internet access are key contributors. Technological advancements, including the rollout of 5G networks and the introduction of innovative features such as advanced camera systems and superior processing power, are further stimulating consumer interest. Challenges include economic volatility in certain regions and potential trade restrictions on device imports. Intense competition among leading brands such as Samsung, Xiaomi, Huawei, OPPO, and Apple creates price pressures that affect profitability. The market is segmented by operating system, with Android dominating the MEA region, while iOS commands a notable share in affluent demographics. Geographically, Saudi Arabia, the UAE, and South Africa are the largest markets, with East and West Africa exhibiting significant growth potential despite infrastructure and affordability hurdles.
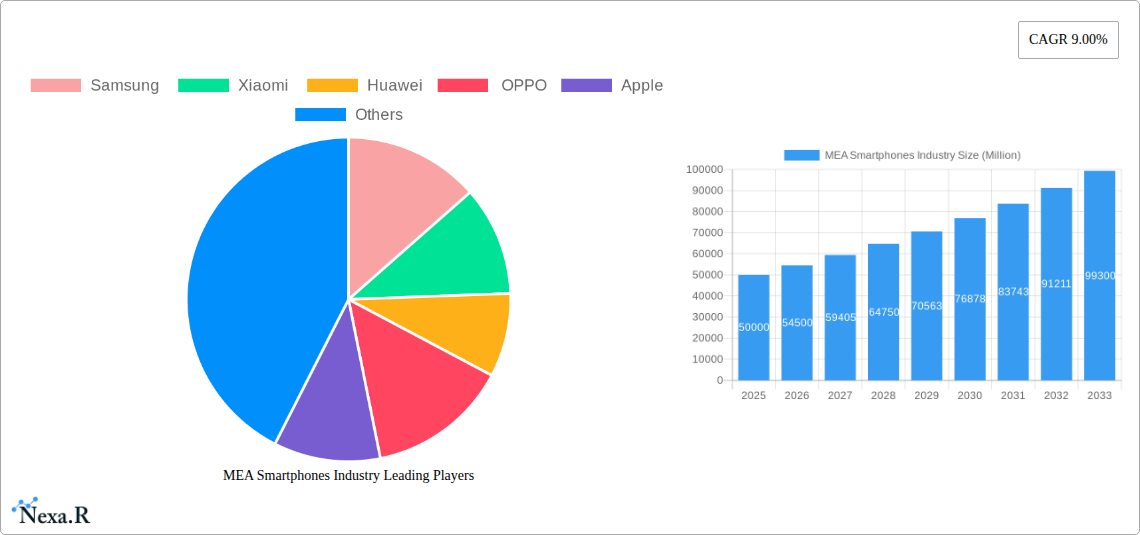
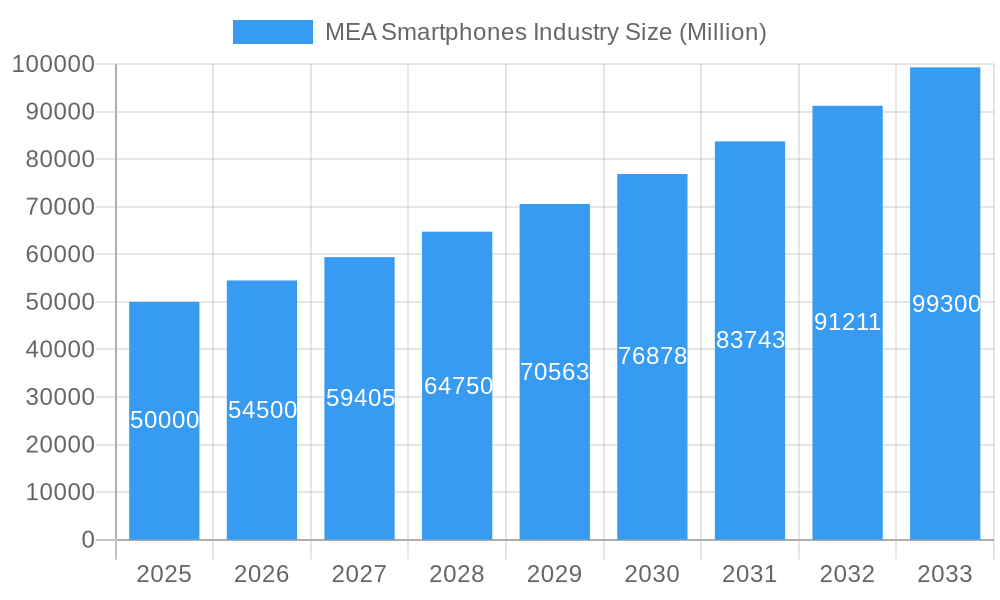
MEA Smartphones Industry Market Size (In Billion)
The MEA smartphone market forecast indicates sustained growth. The increasing adoption of mobile-first services, encompassing e-commerce, online education, and digital healthcare, will be a significant growth driver. Enhanced access to affordable smartphone financing and a greater emphasis on localized content and services are expected to boost sales. Sustainable growth necessitates addressing infrastructure gaps in underserved regions, improving digital literacy, and ensuring device affordability. Geopolitical dynamics and economic fluctuations present potential risks. Nevertheless, the long-term outlook for the MEA smartphone market is optimistic, supported by strong population growth and ongoing digital transformation across the region.
MEA Smartphones Industry Company Market Share
MEA Smartphones Industry: 2019-2033 Market Analysis & Forecast Report
This comprehensive report provides a detailed analysis of the Middle East and Africa (MEA) smartphones industry, covering the period 2019-2033. It offers invaluable insights into market dynamics, growth trends, dominant players, and future opportunities, empowering businesses to make informed strategic decisions. The report segments the market by operating system (Android, iOS, Others), country (Saudi Arabia, United Arab Emirates, South Africa, Egypt, East Africa, West Africa, Turkey, Rest of MEA), and key players (Samsung, Xiaomi, Huawei, OPPO, Apple), providing granular data for informed decision-making. This detailed analysis includes forecasts up to 2033, with a base year of 2025.
MEA Smartphones Industry Market Dynamics & Structure
The MEA smartphone market is characterized by a dynamic interplay of factors influencing its structure and growth. Market concentration is moderate, with a few major players holding significant shares, but a competitive landscape characterized by regional players and niche brands. Technological innovation, particularly in 5G and AI-driven features, is a crucial driver. However, regulatory frameworks concerning data privacy and import/export regulations impact market dynamics. Competitive product substitutes, such as feature phones, exist but hold a diminishing share. End-user demographics are diverse, with varying levels of smartphone adoption and spending power across different countries and income groups. M&A activity has been moderate in recent years, with strategic partnerships and joint ventures also influencing the landscape.
- Market Concentration: Moderate, with top 5 players holding approximately xx% market share in 2024.
- Technological Innovation: 5G adoption, AI-powered features, and improved camera technology are key innovation drivers.
- Regulatory Frameworks: Varying data privacy regulations and import duties impact market access and cost.
- Competitive Substitutes: Feature phones pose minimal threat due to declining popularity.
- End-User Demographics: Significant variations in smartphone penetration and affordability across the region.
- M&A Trends: Moderate M&A activity (xx deals in 2019-2024), with a focus on strategic partnerships.
MEA Smartphones Industry Growth Trends & Insights
The MEA smartphone market has witnessed significant growth over the historical period (2019-2024). Driven by increasing smartphone affordability, expanding internet penetration, and rising disposable incomes, the market size expanded from xx million units in 2019 to xx million units in 2024, registering a CAGR of xx%. Technological disruptions, such as the introduction of 5G, have accelerated growth and adoption. Consumer behavior shifts towards premium features, larger screens, and better camera capabilities are shaping demand. The forecast period (2025-2033) anticipates sustained growth, albeit at a slightly moderated pace, reaching xx million units by 2033, with a projected CAGR of xx%. Market penetration is expected to reach xx% by 2033.
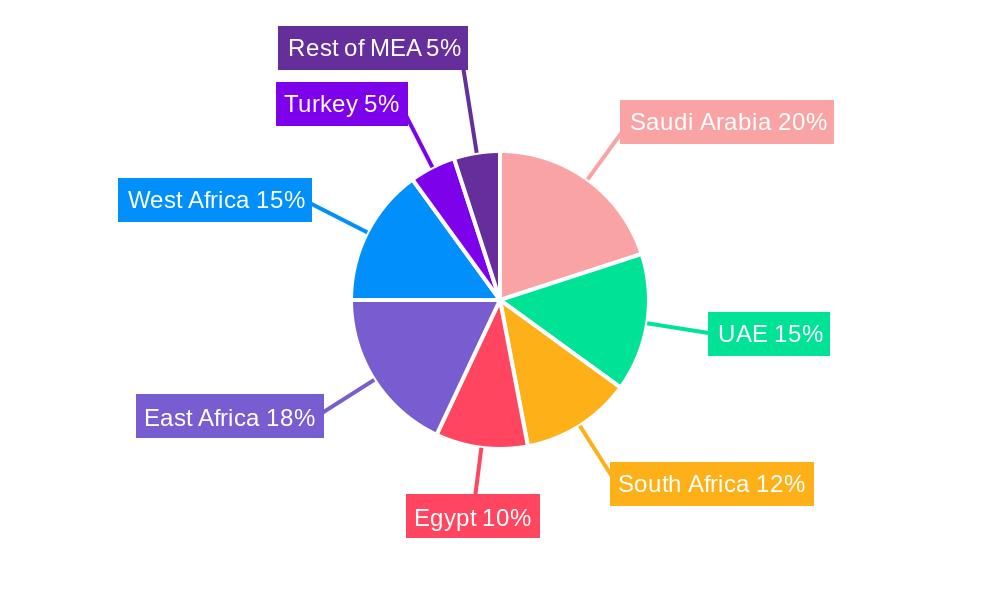
Dominant Regions, Countries, or Segments in MEA Smartphones Industry
The MEA smartphone market exhibits regional disparities. North Africa (particularly Egypt and the Maghreb) and the Gulf Cooperation Council (GCC) countries (especially Saudi Arabia and the UAE) represent the most significant markets. South Africa leads the Sub-Saharan African market. Android remains the dominant operating system, capturing over xx% market share, followed by iOS at approximately xx%. Growth is driven by factors varying across regions: in the GCC, high disposable incomes and robust infrastructure boost sales; in Sub-Saharan Africa, increasing affordability and mobile money adoption drive growth; Turkey's substantial market is driven by its population and economic activity.
- Key Growth Drivers:
- GCC: High disposable incomes, advanced telecommunications infrastructure, and government support for digitalization.
- Sub-Saharan Africa: Rising affordability, increasing mobile money usage, and growing digital literacy.
- Turkey: Large population, developing digital economy, and growing middle class.
- Dominant Regions/Countries: GCC, Egypt, South Africa, and Turkey are key markets driving overall growth.
- Market Share: Android dominates with xx% market share, iOS holds approximately xx%.
MEA Smartphones Industry Product Landscape
The MEA smartphone market offers a diverse range of products, from budget-friendly feature-rich devices to high-end flagship models. Key innovations focus on improved camera capabilities (e.g., high-resolution sensors, improved image processing), enhanced processing power (e.g., advanced chipsets), and increased battery life. 5G connectivity is gaining traction, particularly in the higher-end segment. Unique selling propositions include features such as fast charging, water resistance, and advanced biometrics. Technological advancements are driven by the need for better user experience and the integration of AI-driven features in various applications.
Key Drivers, Barriers & Challenges in MEA Smartphones Industry
Key Drivers:
- Increasing smartphone affordability.
- Expanding internet and mobile network penetration.
- Growing middle class and disposable incomes.
- Government initiatives promoting digital transformation.
- Technological advancements (e.g., 5G, AI).
Key Challenges:
- Price sensitivity in several markets.
- Infrastructure limitations in some regions.
- Regulatory hurdles and varying import tariffs.
- Intense competition among major players.
- Supply chain disruptions and component shortages. (Impact: xx% decrease in smartphone availability in 2022)
Emerging Opportunities in MEA Smartphones Industry
Untapped markets in rural areas and less-developed regions present significant growth potential. The increasing adoption of mobile money and digital payments creates opportunities for smartphone manufacturers to integrate financial services. The rising demand for affordable and durable smartphones tailored to local needs offers opportunities for specialized players. Growing consumer interest in features such as extended battery life, dual SIM capabilities, and multi-lingual support creates new avenues for product innovation.
Growth Accelerators in the MEA Smartphones Industry Industry
Technological advancements, particularly the wider adoption of 5G networks, are expected to propel further growth. Strategic partnerships and collaborations between manufacturers, telecom operators, and fintech companies will facilitate market penetration and create innovative service offerings. Expansion into rural and underserved areas through targeted marketing and distribution strategies will unlock considerable potential. Increased investment in infrastructure development will support the growing smartphone market.
Notable Milestones in MEA Smartphones Industry Sector
- Mar 2021: Samsung launched the Galaxy A32, offering both LTE and 5G options in South Africa, expanding 5G accessibility.
- May 2021: Xiaomi expanded its mid-range portfolio with the Redmi Note 10S and Redmi Note 10 5G in the UAE, further strengthening its presence in the region.
In-Depth MEA Smartphones Industry Market Outlook
The MEA smartphone market is poised for sustained growth driven by technological advancements, expanding digital adoption, and rising middle class. Strategic investments in infrastructure, focused marketing campaigns to target specific demographics, and innovative product development tailored to regional needs will unlock even greater market potential. The expansion of 5G networks and the increasing integration of smartphones into daily life will continue to drive sales and market expansion across the region in the forecast period.
MEA Smartphones Industry Segmentation
-
1. Operating System
- 1.1. Android
- 1.2. iOS
- 1.3. Others
MEA Smartphones Industry Segmentation By Geography
-
1. North America
- 1.1. United States
- 1.2. Canada
- 1.3. Mexico
-
2. South America
- 2.1. Brazil
- 2.2. Argentina
- 2.3. Rest of South America
-
3. Europe
- 3.1. United Kingdom
- 3.2. Germany
- 3.3. France
- 3.4. Italy
- 3.5. Spain
- 3.6. Russia
- 3.7. Benelux
- 3.8. Nordics
- 3.9. Rest of Europe
-
4. Middle East & Africa
- 4.1. Turkey
- 4.2. Israel
- 4.3. GCC
- 4.4. North Africa
- 4.5. South Africa
- 4.6. Rest of Middle East & Africa
-
5. Asia Pacific
- 5.1. China
- 5.2. India
- 5.3. Japan
- 5.4. South Korea
- 5.5. ASEAN
- 5.6. Oceania
- 5.7. Rest of Asia Pacific
MEA Smartphones Industry Regional Market Share
Geographic Coverage of MEA Smartphones Industry
MEA Smartphones Industry REPORT HIGHLIGHTS
| Aspects | Details |
|---|---|
| Study Period | 2020-2034 |
| Base Year | 2025 |
| Estimated Year | 2026 |
| Forecast Period | 2026-2034 |
| Historical Period | 2020-2025 |
| Growth Rate | CAGR of 12.3% from 2020-2034 |
| Segmentation |
|
Table of Contents
- 1. Introduction
- 1.1. Research Scope
- 1.2. Market Segmentation
- 1.3. Research Objective
- 1.4. Definitions and Assumptions
- 2. Executive Summary
- 2.1. Market Snapshot
- 3. Market Dynamics
- 3.1. Market Drivers
- 3.2. Market Restrains
- 3.3. Market Trends
- 3.4. Market Opportunities
- 4. Market Factor Analysis
- 4.1. Porters Five Forces
- 4.1.1. Bargaining Power of Suppliers
- 4.1.2. Bargaining Power of Buyers
- 4.1.3. Threat of New Entrants
- 4.1.4. Threat of Substitutes
- 4.1.5. Competitive Rivalry
- 4.2. PESTEL analysis
- 4.3. BCG Analysis
- 4.3.1. Stars (High Growth, High Market Share)
- 4.3.2. Cash Cows (Low Growth, High Market Share)
- 4.3.3. Question Mark (High Growth, Low Market Share)
- 4.3.4. Dogs (Low Growth, Low Market Share)
- 4.4. Ansoff Matrix Analysis
- 4.5. Supply Chain Analysis
- 4.6. Regulatory Landscape
- 4.7. Current Market Potential and Opportunity Assessment (TAM–SAM–SOM Framework)
- 4.8. NRP Analyst Note
- 4.1. Porters Five Forces
- 5. Market Analysis, Insights and Forecast 2021-2033
- 5.1. Market Analysis, Insights and Forecast - by Operating System
- 5.1.1. Android
- 5.1.2. iOS
- 5.1.3. Others
- 5.2. Market Analysis, Insights and Forecast - by Region
- 5.2.1. North America
- 5.2.2. South America
- 5.2.3. Europe
- 5.2.4. Middle East & Africa
- 5.2.5. Asia Pacific
- 5.1. Market Analysis, Insights and Forecast - by Operating System
- 6. Global MEA Smartphones Industry Analysis, Insights and Forecast, 2021-2033
- 6.1. Market Analysis, Insights and Forecast - by Operating System
- 6.1.1. Android
- 6.1.2. iOS
- 6.1.3. Others
- 6.1. Market Analysis, Insights and Forecast - by Operating System
- 7. North America MEA Smartphones Industry Analysis, Insights and Forecast, 2020-2032
- 7.1. Market Analysis, Insights and Forecast - by Operating System
- 7.1.1. Android
- 7.1.2. iOS
- 7.1.3. Others
- 7.1. Market Analysis, Insights and Forecast - by Operating System
- 8. South America MEA Smartphones Industry Analysis, Insights and Forecast, 2020-2032
- 8.1. Market Analysis, Insights and Forecast - by Operating System
- 8.1.1. Android
- 8.1.2. iOS
- 8.1.3. Others
- 8.1. Market Analysis, Insights and Forecast - by Operating System
- 9. Europe MEA Smartphones Industry Analysis, Insights and Forecast, 2020-2032
- 9.1. Market Analysis, Insights and Forecast - by Operating System
- 9.1.1. Android
- 9.1.2. iOS
- 9.1.3. Others
- 9.1. Market Analysis, Insights and Forecast - by Operating System
- 10. Middle East & Africa MEA Smartphones Industry Analysis, Insights and Forecast, 2020-2032
- 10.1. Market Analysis, Insights and Forecast - by Operating System
- 10.1.1. Android
- 10.1.2. iOS
- 10.1.3. Others
- 10.1. Market Analysis, Insights and Forecast - by Operating System
- 11. Asia Pacific MEA Smartphones Industry Analysis, Insights and Forecast, 2020-2032
- 11.1. Market Analysis, Insights and Forecast - by Operating System
- 11.1.1. Android
- 11.1.2. iOS
- 11.1.3. Others
- 11.1. Market Analysis, Insights and Forecast - by Operating System
- 12. Competitive Analysis
- 12.1. Company Profiles
- 12.1.1 Samsung
- 12.1.1.1. Company Overview
- 12.1.1.2. Products
- 12.1.1.3. Company Financials
- 12.1.1.4. SWOT Analysis
- 12.1.2 Xiaomi
- 12.1.2.1. Company Overview
- 12.1.2.2. Products
- 12.1.2.3. Company Financials
- 12.1.2.4. SWOT Analysis
- 12.1.3 Huawei
- 12.1.3.1. Company Overview
- 12.1.3.2. Products
- 12.1.3.3. Company Financials
- 12.1.3.4. SWOT Analysis
- 12.1.4 OPPO
- 12.1.4.1. Company Overview
- 12.1.4.2. Products
- 12.1.4.3. Company Financials
- 12.1.4.4. SWOT Analysis
- 12.1.5 Apple
- 12.1.5.1. Company Overview
- 12.1.5.2. Products
- 12.1.5.3. Company Financials
- 12.1.5.4. SWOT Analysis
- 12.1.1 Samsung
- 12.2. Market Entropy
- 12.2.1 Company's Key Areas Served
- 12.2.2 Recent Developments
- 12.3. Company Market Share Analysis 2025
- 12.3.1 Top 5 Companies Market Share Analysis
- 12.3.2 Top 3 Companies Market Share Analysis
- 12.4. List of Potential Customers
- 13. Research Methodology
List of Figures
- Figure 1: Global MEA Smartphones Industry Revenue Breakdown (million, %) by Region 2025 & 2033
- Figure 2: North America MEA Smartphones Industry Revenue (million), by Operating System 2025 & 2033
- Figure 3: North America MEA Smartphones Industry Revenue Share (%), by Operating System 2025 & 2033
- Figure 4: North America MEA Smartphones Industry Revenue (million), by Country 2025 & 2033
- Figure 5: North America MEA Smartphones Industry Revenue Share (%), by Country 2025 & 2033
- Figure 6: South America MEA Smartphones Industry Revenue (million), by Operating System 2025 & 2033
- Figure 7: South America MEA Smartphones Industry Revenue Share (%), by Operating System 2025 & 2033
- Figure 8: South America MEA Smartphones Industry Revenue (million), by Country 2025 & 2033
- Figure 9: South America MEA Smartphones Industry Revenue Share (%), by Country 2025 & 2033
- Figure 10: Europe MEA Smartphones Industry Revenue (million), by Operating System 2025 & 2033
- Figure 11: Europe MEA Smartphones Industry Revenue Share (%), by Operating System 2025 & 2033
- Figure 12: Europe MEA Smartphones Industry Revenue (million), by Country 2025 & 2033
- Figure 13: Europe MEA Smartphones Industry Revenue Share (%), by Country 2025 & 2033
- Figure 14: Middle East & Africa MEA Smartphones Industry Revenue (million), by Operating System 2025 & 2033
- Figure 15: Middle East & Africa MEA Smartphones Industry Revenue Share (%), by Operating System 2025 & 2033
- Figure 16: Middle East & Africa MEA Smartphones Industry Revenue (million), by Country 2025 & 2033
- Figure 17: Middle East & Africa MEA Smartphones Industry Revenue Share (%), by Country 2025 & 2033
- Figure 18: Asia Pacific MEA Smartphones Industry Revenue (million), by Operating System 2025 & 2033
- Figure 19: Asia Pacific MEA Smartphones Industry Revenue Share (%), by Operating System 2025 & 2033
- Figure 20: Asia Pacific MEA Smartphones Industry Revenue (million), by Country 2025 & 2033
- Figure 21: Asia Pacific MEA Smartphones Industry Revenue Share (%), by Country 2025 & 2033
List of Tables
- Table 1: Global MEA Smartphones Industry Revenue million Forecast, by Operating System 2020 & 2033
- Table 2: Global MEA Smartphones Industry Revenue million Forecast, by Region 2020 & 2033
- Table 3: Global MEA Smartphones Industry Revenue million Forecast, by Operating System 2020 & 2033
- Table 4: Global MEA Smartphones Industry Revenue million Forecast, by Country 2020 & 2033
- Table 5: United States MEA Smartphones Industry Revenue (million) Forecast, by Application 2020 & 2033
- Table 6: Canada MEA Smartphones Industry Revenue (million) Forecast, by Application 2020 & 2033
- Table 7: Mexico MEA Smartphones Industry Revenue (million) Forecast, by Application 2020 & 2033
- Table 8: Global MEA Smartphones Industry Revenue million Forecast, by Operating System 2020 & 2033
- Table 9: Global MEA Smartphones Industry Revenue million Forecast, by Country 2020 & 2033
- Table 10: Brazil MEA Smartphones Industry Revenue (million) Forecast, by Application 2020 & 2033
- Table 11: Argentina MEA Smartphones Industry Revenue (million) Forecast, by Application 2020 & 2033
- Table 12: Rest of South America MEA Smartphones Industry Revenue (million) Forecast, by Application 2020 & 2033
- Table 13: Global MEA Smartphones Industry Revenue million Forecast, by Operating System 2020 & 2033
- Table 14: Global MEA Smartphones Industry Revenue million Forecast, by Country 2020 & 2033
- Table 15: United Kingdom MEA Smartphones Industry Revenue (million) Forecast, by Application 2020 & 2033
- Table 16: Germany MEA Smartphones Industry Revenue (million) Forecast, by Application 2020 & 2033
- Table 17: France MEA Smartphones Industry Revenue (million) Forecast, by Application 2020 & 2033
- Table 18: Italy MEA Smartphones Industry Revenue (million) Forecast, by Application 2020 & 2033
- Table 19: Spain MEA Smartphones Industry Revenue (million) Forecast, by Application 2020 & 2033
- Table 20: Russia MEA Smartphones Industry Revenue (million) Forecast, by Application 2020 & 2033
- Table 21: Benelux MEA Smartphones Industry Revenue (million) Forecast, by Application 2020 & 2033
- Table 22: Nordics MEA Smartphones Industry Revenue (million) Forecast, by Application 2020 & 2033
- Table 23: Rest of Europe MEA Smartphones Industry Revenue (million) Forecast, by Application 2020 & 2033
- Table 24: Global MEA Smartphones Industry Revenue million Forecast, by Operating System 2020 & 2033
- Table 25: Global MEA Smartphones Industry Revenue million Forecast, by Country 2020 & 2033
- Table 26: Turkey MEA Smartphones Industry Revenue (million) Forecast, by Application 2020 & 2033
- Table 27: Israel MEA Smartphones Industry Revenue (million) Forecast, by Application 2020 & 2033
- Table 28: GCC MEA Smartphones Industry Revenue (million) Forecast, by Application 2020 & 2033
- Table 29: North Africa MEA Smartphones Industry Revenue (million) Forecast, by Application 2020 & 2033
- Table 30: South Africa MEA Smartphones Industry Revenue (million) Forecast, by Application 2020 & 2033
- Table 31: Rest of Middle East & Africa MEA Smartphones Industry Revenue (million) Forecast, by Application 2020 & 2033
- Table 32: Global MEA Smartphones Industry Revenue million Forecast, by Operating System 2020 & 2033
- Table 33: Global MEA Smartphones Industry Revenue million Forecast, by Country 2020 & 2033
- Table 34: China MEA Smartphones Industry Revenue (million) Forecast, by Application 2020 & 2033
- Table 35: India MEA Smartphones Industry Revenue (million) Forecast, by Application 2020 & 2033
- Table 36: Japan MEA Smartphones Industry Revenue (million) Forecast, by Application 2020 & 2033
- Table 37: South Korea MEA Smartphones Industry Revenue (million) Forecast, by Application 2020 & 2033
- Table 38: ASEAN MEA Smartphones Industry Revenue (million) Forecast, by Application 2020 & 2033
- Table 39: Oceania MEA Smartphones Industry Revenue (million) Forecast, by Application 2020 & 2033
- Table 40: Rest of Asia Pacific MEA Smartphones Industry Revenue (million) Forecast, by Application 2020 & 2033
Frequently Asked Questions
1. What is the projected Compound Annual Growth Rate (CAGR) of the MEA Smartphones Industry?
The projected CAGR is approximately 12.3%.
2. Which companies are prominent players in the MEA Smartphones Industry?
Key companies in the market include Samsung , Xiaomi , Huawei, OPPO, Apple .
3. What are the main segments of the MEA Smartphones Industry?
The market segments include Operating System.
4. Can you provide details about the market size?
The market size is estimated to be USD 1708.7 million as of 2022.
5. What are some drivers contributing to market growth?
; Growing Adoption of Energy-Efficient Devices.
6. What are the notable trends driving market growth?
Android is Expected to Grow Significantly.
7. Are there any restraints impacting market growth?
Growing Production Costs and Vendor Consolidation Cited as the Key Reasons for Slow Growth Forecast; Given that the Market is on the Verge of Reaching Maturity.
8. Can you provide examples of recent developments in the market?
Mar 2021 - Samsung announced the launch of its Mid-Tier smartphone Galaxy A32 smartphone, which will offer both LTE and 5G options for South African consumers. The company also stated that the new Galaxy A32 being offered in both versions will not only make innovation more accessible to more South Africans but will also enable the users to experience 5G-capabilities for the first time in the Galaxy A Series smartphones.
9. What pricing options are available for accessing the report?
Pricing options include single-user, multi-user, and enterprise licenses priced at USD 4750, USD 4950, and USD 6800 respectively.
10. Is the market size provided in terms of value or volume?
The market size is provided in terms of value, measured in million.
11. Are there any specific market keywords associated with the report?
Yes, the market keyword associated with the report is "MEA Smartphones Industry," which aids in identifying and referencing the specific market segment covered.
12. How do I determine which pricing option suits my needs best?
The pricing options vary based on user requirements and access needs. Individual users may opt for single-user licenses, while businesses requiring broader access may choose multi-user or enterprise licenses for cost-effective access to the report.
13. Are there any additional resources or data provided in the MEA Smartphones Industry report?
While the report offers comprehensive insights, it's advisable to review the specific contents or supplementary materials provided to ascertain if additional resources or data are available.
14. How can I stay updated on further developments or reports in the MEA Smartphones Industry?
To stay informed about further developments, trends, and reports in the MEA Smartphones Industry, consider subscribing to industry newsletters, following relevant companies and organizations, or regularly checking reputable industry news sources and publications.
Methodology
Step 1 - Identification of Relevant Samples Size from Population Database


Step 2 - Approaches for Defining Global Market Size (Value, Volume* & Price*)

Note*: In applicable scenarios
Step 3 - Data Sources
Primary Research
- Web Analytics
- Survey Reports
- Research Institute
- Latest Research Reports
- Opinion Leaders
Secondary Research
- Annual Reports
- White Paper
- Latest Press Release
- Industry Association
- Paid Database
- Investor Presentations

Step 4 - Data Triangulation
Involves using different sources of information in order to increase the validity of a study
These sources are likely to be stakeholders in a program - participants, other researchers, program staff, other community members, and so on.
Then we put all data in single framework & apply various statistical tools to find out the dynamic on the market.
During the analysis stage, feedback from the stakeholder groups would be compared to determine areas of agreement as well as areas of divergence