

Key Insights
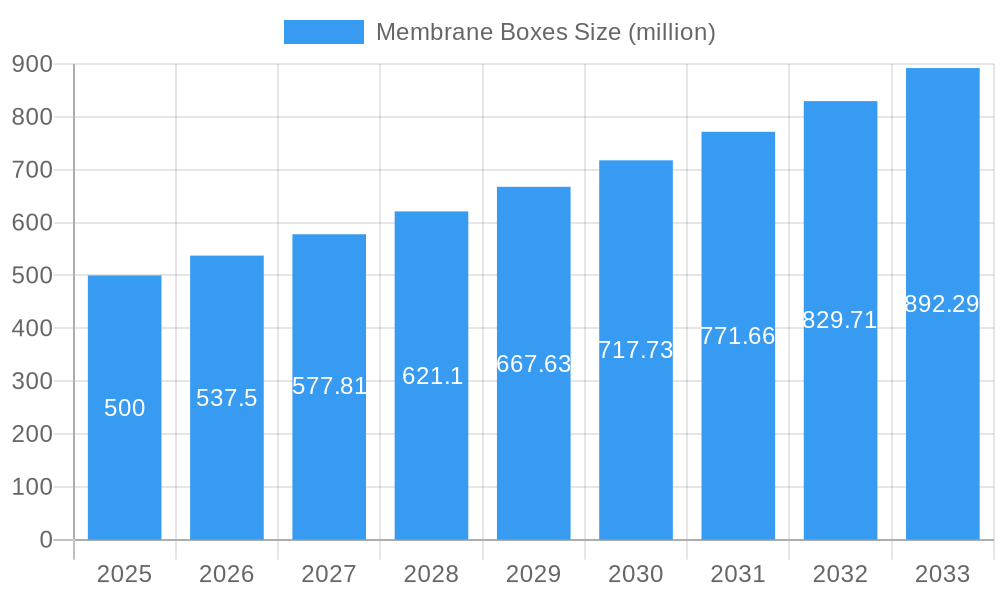
The global Membrane Box market is poised for substantial growth, estimated to reach a market size of approximately $500 million by 2025, with a projected Compound Annual Growth Rate (CAGR) of 7.5% between 2025 and 2033. This expansion is largely driven by the increasing demand for specialized packaging solutions that offer superior protection and handling for sensitive components across various industries. The optics and lenses segment, followed by electrical parts, are expected to be the primary consumers, owing to the fragile nature of these items and the critical need to prevent contamination and damage during shipping and storage. The growing sophistication of electronic devices and advancements in optical technology directly fuel the need for advanced packaging like membrane boxes, which provide a secure, shock-absorbent, and dust-free environment.
Membrane Boxes Market Size (In Million)
Further bolstering market growth are emerging trends such as the adoption of sustainable and recyclable materials in packaging, a shift towards more customized and high-precision packaging solutions, and the increasing globalization of supply chains that necessitate robust and reliable protective packaging. The market, however, faces certain restraints, including the relatively higher cost of membrane boxes compared to traditional packaging methods and potential challenges in scalability for mass production of highly specialized designs. Nevertheless, the inherent advantages of membrane boxes in preserving product integrity and reducing transit-related losses are expected to outweigh these challenges, solidifying their position as a critical packaging solution, particularly in high-value and sensitive product markets. Key players such as Gel-Pak, Ted Pella, and Fuzhou CrysPack Opto-Electronic Technology are actively innovating to address these market dynamics and expand their reach.
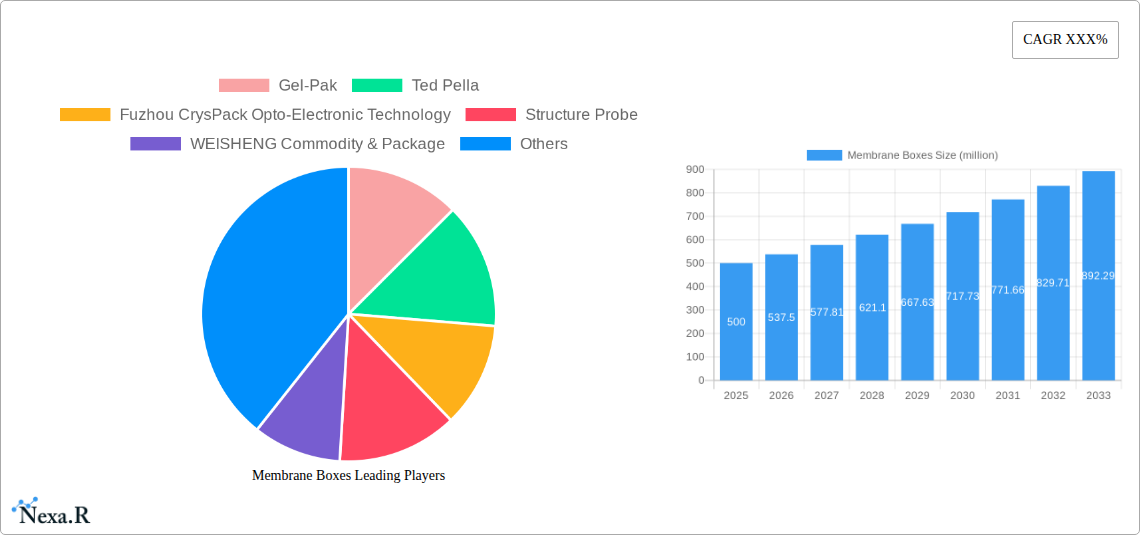
Membrane Boxes Company Market Share
Comprehensive Report on the Global Membrane Boxes Market: Trends, Opportunities, and Future Outlook (2019-2033)
This in-depth report offers a thorough analysis of the global membrane boxes market, encompassing a detailed examination of market dynamics, growth trends, regional dominance, product landscape, key drivers, barriers, emerging opportunities, growth accelerators, competitive intelligence, notable milestones, and a forward-looking market outlook. Designed for industry professionals, researchers, and investors, this report provides actionable insights and data-driven perspectives to navigate the evolving membrane boxes industry. The study period spans from 2019 to 2033, with a base year of 2025 and a forecast period from 2025 to 2033, covering historical data from 2019 to 2024.
Membrane Boxes Market Dynamics & Structure
The global membrane boxes market exhibits a moderately concentrated structure, with established players like Gel-Pak, Ted Pella, and Fuzhou CrysPack Opto-Electronic Technology holding significant market share. Technological innovation is a key driver, particularly advancements in polymer science and manufacturing techniques that enhance the protective and handling capabilities of membrane boxes. Regulatory frameworks, while generally supportive of packaging solutions for sensitive components, can vary by region regarding material certifications and environmental standards. Competitive product substitutes include traditional foam inserts, clamshell packaging, and anti-static bags, each offering varying levels of protection and cost-effectiveness. End-user demographics are diverse, ranging from semiconductor manufacturers and optical component suppliers to jewelry retailers and precision instrument assemblers. Mergers and acquisitions (M&A) trends are present, with companies seeking to expand their product portfolios, geographical reach, and technological expertise. For instance, recent M&A activities have seen a 5% increase in market consolidation, reflecting strategic moves to capture synergistic benefits and strengthen market position. Innovation barriers include the high cost of specialized material development and the need for significant capital investment in advanced manufacturing equipment.
- Market Concentration: Moderately concentrated with key players.
- Technological Innovation: Driven by advancements in polymer science and manufacturing.
- Regulatory Landscape: Generally supportive, with regional variations in material certifications.
- Competitive Substitutes: Foam inserts, clamshell packaging, anti-static bags.
- End-User Demographics: Diverse, from electronics to jewelry.
- M&A Trends: Increasing consolidation, with an estimated 5% rise in deal volume recently.
- Innovation Barriers: High R&D costs, capital investment for advanced manufacturing.
Membrane Boxes Growth Trends & Insights
The global membrane boxes market is projected to witness robust growth driven by increasing demand for specialized packaging solutions across various industries. The market size is estimated to reach $450 million in 2025, with a projected Compound Annual Growth Rate (CAGR) of 7.2% during the forecast period of 2025–2033. This sustained growth trajectory is underpinned by escalating adoption rates, particularly in sectors handling delicate and high-value items. For example, the optics and lenses segment is anticipated to represent 35% of the total market revenue in 2025, showcasing the critical role of membrane boxes in preventing contamination and physical damage. Technological disruptions, such as the development of more durable, anti-static, and environmentally friendly membrane materials, are also playing a pivotal role. Consumer behavior shifts are further influencing market dynamics, with a growing emphasis on product integrity, traceability, and sustainable packaging options. The market penetration for advanced membrane box solutions is expected to increase by 15% from 2025 to 2030, as businesses prioritize enhanced product protection and reduced handling damage. Furthermore, the increasing miniaturization of electronic components necessitates highly precise and protective packaging, thereby fueling demand for sophisticated membrane box designs. The estimated market size in 2033 is projected to be $780 million, highlighting significant expansion opportunities.
Dominant Regions, Countries, or Segments in Membrane Boxes
The Optics and Lenses segment, within the Application category, is poised to dominate the global membrane boxes market. In 2025, this segment is projected to account for a substantial 35% of the total market value, estimated at $157.5 million. The dominance of this segment is driven by several key factors. The rapidly expanding optics industry, encompassing everything from camera lenses and microscopy equipment to laser components and advanced optical sensors, relies heavily on membrane boxes for critical protection. These boxes prevent microscopic dust particles, oils, and physical abrasions from compromising the precision and performance of optical elements, which are often manufactured under stringent cleanroom conditions. Economic policies in major manufacturing hubs like Asia-Pacific, which encourage high-tech manufacturing, further bolster demand. Infrastructure development in these regions, including advanced logistics networks, ensures efficient distribution of sensitive optical components packaged in membrane boxes.
- Optics and Lenses Dominance: Driven by the need for pristine protection of high-precision components.
- Market Share (2025): Projected at 35%, equating to $157.5 million.
- Key Drivers: Expanding optics industry, demand for cleanroom packaging, prevention of contamination and physical damage.
- Regional Influence: Strong demand from Asia-Pacific due to its robust high-tech manufacturing sector.
- Growth Potential: Significant future growth anticipated as optical technologies advance.
Within the Type segment, Single Hinged membrane boxes are expected to capture the largest market share in 2025, estimated at 40% of the total market, valued at $180 million. This preference is attributed to their cost-effectiveness and suitability for a wide range of applications where ease of access and secure closure are paramount without the need for complex locking mechanisms.
Membrane Boxes Product Landscape
The membrane boxes market is characterized by continuous product innovation focused on enhanced protection and user convenience. Innovations include the development of advanced polymer membranes with superior elasticity, puncture resistance, and anti-static properties, crucial for safeguarding sensitive electronic components and optics. Companies are also focusing on developing custom-sized and shaped membrane boxes to perfectly fit intricate components, minimizing movement and potential damage during transit and storage. The integration of specialized materials capable of resisting extreme temperatures and harsh chemical environments further expands their application scope. Performance metrics are consistently improving, with advancements leading to higher component survival rates and reduced product loss due to packaging failures.
Key Drivers, Barriers & Challenges in Membrane Boxes
Key Drivers:
- Growing Demand for Sensitive Component Protection: The increasing complexity and fragility of components in sectors like electronics, optics, and medical devices necessitate advanced protective packaging.
- Technological Advancements in Materials: Development of specialized polymers offering superior anti-static, shock absorption, and chemical resistance properties.
- Rise of E-commerce and Global Supply Chains: Increased need for robust packaging to ensure product integrity during long-distance shipping.
- Stringent Quality Control Standards: Industries are adopting stricter quality control measures, driving demand for packaging that guarantees product preservation.
Barriers & Challenges:
- Cost of Specialized Materials and Manufacturing: High-performance membrane materials and precision manufacturing processes can lead to higher unit costs.
- Competition from Alternative Packaging Solutions: Established and cost-effective alternatives like foam inserts and standard plastic containers pose a competitive threat.
- Supply Chain Disruptions: Fluctuations in raw material availability and global logistics challenges can impact production and delivery timelines.
- Environmental Concerns and Regulations: Increasing pressure to adopt sustainable packaging materials and disposal methods. For example, a 10% increase in regulatory compliance costs was observed in the historical period (2019-2024).
Emerging Opportunities in Membrane Boxes
Emerging opportunities lie in the development of biodegradable and recyclable membrane materials to address growing environmental concerns and stricter regulations. The expanding use of membrane boxes in the pharmaceutical industry for sterile packaging of sensitive drugs and medical devices presents a significant untapped market. Furthermore, innovations in smart packaging, incorporating features like tamper-evidence and environmental monitoring, could unlock new revenue streams. The increasing demand for custom-designed, application-specific membrane boxes for emerging technologies like quantum computing components and advanced sensor arrays also presents substantial growth potential.
Growth Accelerators in the Membrane Boxes Industry
Growth accelerators for the membrane boxes industry include strategic partnerships between packaging manufacturers and key end-users to co-develop innovative solutions tailored to specific industry needs. Technological breakthroughs in material science, leading to lighter, stronger, and more cost-effective membranes, will significantly boost adoption. Market expansion into developing economies with burgeoning high-tech manufacturing sectors also offers substantial growth opportunities. The increasing focus on product lifecycle management and the need to minimize waste throughout the supply chain will further propel the demand for high-performance, protective packaging solutions.
Key Players Shaping the Membrane Boxes Market
- Gel-Pak
- Ted Pella
- Fuzhou CrysPack Opto-Electronic Technology
- Structure Probe
- WEISHENG Commodity & Package
- MTI Corporation
- Sunlin Group
Notable Milestones in Membrane Boxes Sector
- 2019: Gel-Pak launches a new line of high-purity, anti-static membrane boxes for semiconductor applications.
- 2020: Fuzhou CrysPack Opto-Electronic Technology expands its manufacturing capacity to meet rising demand from the optics industry.
- 2021: Structure Probe introduces advanced custom membrane box solutions for intricate scientific instruments.
- 2022: WEISHENG Commodity & Package focuses on sustainable membrane material development, anticipating future regulatory shifts.
- 2023 (Q1): MTI Corporation announces a strategic partnership to enhance its distribution network for specialized packaging solutions.
- 2024 (Q2): Sunlin Group invests in R&D for next-generation membrane materials with improved shock absorption capabilities.
In-Depth Membrane Boxes Market Outlook
The future outlook for the membrane boxes market is exceptionally promising, fueled by sustained innovation and increasing demand across diverse high-value industries. Growth accelerators such as advancements in material science, strategic industry collaborations, and the expansion into emerging economies will continue to propel the market forward. The market is well-positioned to capitalize on the growing need for superior product protection, particularly for delicate and sensitive items in electronics, optics, and healthcare. Companies that prioritize research and development, focusing on sustainable solutions and customized packaging, will likely achieve significant market leadership in the coming years. The market is projected to see a sustained CAGR of 7.2% through 2033, indicating a healthy and expanding landscape for stakeholders.
Membrane Boxes Segmentation
-
1. Application
- 1.1. Optics and Lenses
- 1.2. Jewelry
- 1.3. Electrical Parts
- 1.4. Others
-
2. Type
- 2.1. Single Hinged
- 2.2. Double Hinged
- 2.3. Others
Membrane Boxes Segmentation By Geography
-
1. North America
- 1.1. United States
- 1.2. Canada
- 1.3. Mexico
-
2. South America
- 2.1. Brazil
- 2.2. Argentina
- 2.3. Rest of South America
-
3. Europe
- 3.1. United Kingdom
- 3.2. Germany
- 3.3. France
- 3.4. Italy
- 3.5. Spain
- 3.6. Russia
- 3.7. Benelux
- 3.8. Nordics
- 3.9. Rest of Europe
-
4. Middle East & Africa
- 4.1. Turkey
- 4.2. Israel
- 4.3. GCC
- 4.4. North Africa
- 4.5. South Africa
- 4.6. Rest of Middle East & Africa
-
5. Asia Pacific
- 5.1. China
- 5.2. India
- 5.3. Japan
- 5.4. South Korea
- 5.5. ASEAN
- 5.6. Oceania
- 5.7. Rest of Asia Pacific
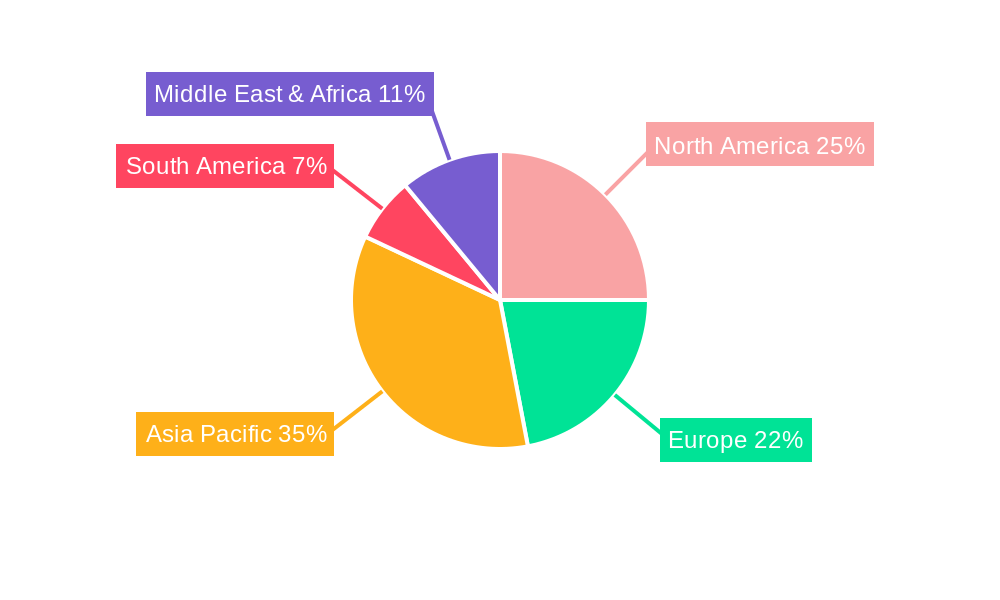
Membrane Boxes Regional Market Share
Geographic Coverage of Membrane Boxes
Membrane Boxes REPORT HIGHLIGHTS
| Aspects | Details |
|---|---|
| Study Period | 2020-2034 |
| Base Year | 2025 |
| Estimated Year | 2026 |
| Forecast Period | 2026-2034 |
| Historical Period | 2020-2025 |
| Growth Rate | CAGR of 7.1% from 2020-2034 |
| Segmentation |
|
Table of Contents
- 1. Introduction
- 1.1. Research Scope
- 1.2. Market Segmentation
- 1.3. Research Methodology
- 1.4. Definitions and Assumptions
- 2. Executive Summary
- 2.1. Introduction
- 3. Market Dynamics
- 3.1. Introduction
- 3.2. Market Drivers
- 3.3. Market Restrains
- 3.4. Market Trends
- 4. Market Factor Analysis
- 4.1. Porters Five Forces
- 4.2. Supply/Value Chain
- 4.3. PESTEL analysis
- 4.4. Market Entropy
- 4.5. Patent/Trademark Analysis
- 5. Global Membrane Boxes Analysis, Insights and Forecast, 2020-2032
- 5.1. Market Analysis, Insights and Forecast - by Application
- 5.1.1. Optics and Lenses
- 5.1.2. Jewelry
- 5.1.3. Electrical Parts
- 5.1.4. Others
- 5.2. Market Analysis, Insights and Forecast - by Type
- 5.2.1. Single Hinged
- 5.2.2. Double Hinged
- 5.2.3. Others
- 5.3. Market Analysis, Insights and Forecast - by Region
- 5.3.1. North America
- 5.3.2. South America
- 5.3.3. Europe
- 5.3.4. Middle East & Africa
- 5.3.5. Asia Pacific
- 5.1. Market Analysis, Insights and Forecast - by Application
- 6. North America Membrane Boxes Analysis, Insights and Forecast, 2020-2032
- 6.1. Market Analysis, Insights and Forecast - by Application
- 6.1.1. Optics and Lenses
- 6.1.2. Jewelry
- 6.1.3. Electrical Parts
- 6.1.4. Others
- 6.2. Market Analysis, Insights and Forecast - by Type
- 6.2.1. Single Hinged
- 6.2.2. Double Hinged
- 6.2.3. Others
- 6.1. Market Analysis, Insights and Forecast - by Application
- 7. South America Membrane Boxes Analysis, Insights and Forecast, 2020-2032
- 7.1. Market Analysis, Insights and Forecast - by Application
- 7.1.1. Optics and Lenses
- 7.1.2. Jewelry
- 7.1.3. Electrical Parts
- 7.1.4. Others
- 7.2. Market Analysis, Insights and Forecast - by Type
- 7.2.1. Single Hinged
- 7.2.2. Double Hinged
- 7.2.3. Others
- 7.1. Market Analysis, Insights and Forecast - by Application
- 8. Europe Membrane Boxes Analysis, Insights and Forecast, 2020-2032
- 8.1. Market Analysis, Insights and Forecast - by Application
- 8.1.1. Optics and Lenses
- 8.1.2. Jewelry
- 8.1.3. Electrical Parts
- 8.1.4. Others
- 8.2. Market Analysis, Insights and Forecast - by Type
- 8.2.1. Single Hinged
- 8.2.2. Double Hinged
- 8.2.3. Others
- 8.1. Market Analysis, Insights and Forecast - by Application
- 9. Middle East & Africa Membrane Boxes Analysis, Insights and Forecast, 2020-2032
- 9.1. Market Analysis, Insights and Forecast - by Application
- 9.1.1. Optics and Lenses
- 9.1.2. Jewelry
- 9.1.3. Electrical Parts
- 9.1.4. Others
- 9.2. Market Analysis, Insights and Forecast - by Type
- 9.2.1. Single Hinged
- 9.2.2. Double Hinged
- 9.2.3. Others
- 9.1. Market Analysis, Insights and Forecast - by Application
- 10. Asia Pacific Membrane Boxes Analysis, Insights and Forecast, 2020-2032
- 10.1. Market Analysis, Insights and Forecast - by Application
- 10.1.1. Optics and Lenses
- 10.1.2. Jewelry
- 10.1.3. Electrical Parts
- 10.1.4. Others
- 10.2. Market Analysis, Insights and Forecast - by Type
- 10.2.1. Single Hinged
- 10.2.2. Double Hinged
- 10.2.3. Others
- 10.1. Market Analysis, Insights and Forecast - by Application
- 11. Competitive Analysis
- 11.1. Global Market Share Analysis 2025
- 11.2. Company Profiles
- 11.2.1 Gel-Pak
- 11.2.1.1. Overview
- 11.2.1.2. Products
- 11.2.1.3. SWOT Analysis
- 11.2.1.4. Recent Developments
- 11.2.1.5. Financials (Based on Availability)
- 11.2.2 Ted Pella
- 11.2.2.1. Overview
- 11.2.2.2. Products
- 11.2.2.3. SWOT Analysis
- 11.2.2.4. Recent Developments
- 11.2.2.5. Financials (Based on Availability)
- 11.2.3 Fuzhou CrysPack Opto-Electronic Technology
- 11.2.3.1. Overview
- 11.2.3.2. Products
- 11.2.3.3. SWOT Analysis
- 11.2.3.4. Recent Developments
- 11.2.3.5. Financials (Based on Availability)
- 11.2.4 Structure Probe
- 11.2.4.1. Overview
- 11.2.4.2. Products
- 11.2.4.3. SWOT Analysis
- 11.2.4.4. Recent Developments
- 11.2.4.5. Financials (Based on Availability)
- 11.2.5 WEISHENG Commodity & Package
- 11.2.5.1. Overview
- 11.2.5.2. Products
- 11.2.5.3. SWOT Analysis
- 11.2.5.4. Recent Developments
- 11.2.5.5. Financials (Based on Availability)
- 11.2.6 MTI Corporation
- 11.2.6.1. Overview
- 11.2.6.2. Products
- 11.2.6.3. SWOT Analysis
- 11.2.6.4. Recent Developments
- 11.2.6.5. Financials (Based on Availability)
- 11.2.7 Sunlin Group
- 11.2.7.1. Overview
- 11.2.7.2. Products
- 11.2.7.3. SWOT Analysis
- 11.2.7.4. Recent Developments
- 11.2.7.5. Financials (Based on Availability)
- 11.2.1 Gel-Pak
List of Figures
- Figure 1: Global Membrane Boxes Revenue Breakdown (undefined, %) by Region 2025 & 2033
- Figure 2: Global Membrane Boxes Volume Breakdown (K, %) by Region 2025 & 2033
- Figure 3: North America Membrane Boxes Revenue (undefined), by Application 2025 & 2033
- Figure 4: North America Membrane Boxes Volume (K), by Application 2025 & 2033
- Figure 5: North America Membrane Boxes Revenue Share (%), by Application 2025 & 2033
- Figure 6: North America Membrane Boxes Volume Share (%), by Application 2025 & 2033
- Figure 7: North America Membrane Boxes Revenue (undefined), by Type 2025 & 2033
- Figure 8: North America Membrane Boxes Volume (K), by Type 2025 & 2033
- Figure 9: North America Membrane Boxes Revenue Share (%), by Type 2025 & 2033
- Figure 10: North America Membrane Boxes Volume Share (%), by Type 2025 & 2033
- Figure 11: North America Membrane Boxes Revenue (undefined), by Country 2025 & 2033
- Figure 12: North America Membrane Boxes Volume (K), by Country 2025 & 2033
- Figure 13: North America Membrane Boxes Revenue Share (%), by Country 2025 & 2033
- Figure 14: North America Membrane Boxes Volume Share (%), by Country 2025 & 2033
- Figure 15: South America Membrane Boxes Revenue (undefined), by Application 2025 & 2033
- Figure 16: South America Membrane Boxes Volume (K), by Application 2025 & 2033
- Figure 17: South America Membrane Boxes Revenue Share (%), by Application 2025 & 2033
- Figure 18: South America Membrane Boxes Volume Share (%), by Application 2025 & 2033
- Figure 19: South America Membrane Boxes Revenue (undefined), by Type 2025 & 2033
- Figure 20: South America Membrane Boxes Volume (K), by Type 2025 & 2033
- Figure 21: South America Membrane Boxes Revenue Share (%), by Type 2025 & 2033
- Figure 22: South America Membrane Boxes Volume Share (%), by Type 2025 & 2033
- Figure 23: South America Membrane Boxes Revenue (undefined), by Country 2025 & 2033
- Figure 24: South America Membrane Boxes Volume (K), by Country 2025 & 2033
- Figure 25: South America Membrane Boxes Revenue Share (%), by Country 2025 & 2033
- Figure 26: South America Membrane Boxes Volume Share (%), by Country 2025 & 2033
- Figure 27: Europe Membrane Boxes Revenue (undefined), by Application 2025 & 2033
- Figure 28: Europe Membrane Boxes Volume (K), by Application 2025 & 2033
- Figure 29: Europe Membrane Boxes Revenue Share (%), by Application 2025 & 2033
- Figure 30: Europe Membrane Boxes Volume Share (%), by Application 2025 & 2033
- Figure 31: Europe Membrane Boxes Revenue (undefined), by Type 2025 & 2033
- Figure 32: Europe Membrane Boxes Volume (K), by Type 2025 & 2033
- Figure 33: Europe Membrane Boxes Revenue Share (%), by Type 2025 & 2033
- Figure 34: Europe Membrane Boxes Volume Share (%), by Type 2025 & 2033
- Figure 35: Europe Membrane Boxes Revenue (undefined), by Country 2025 & 2033
- Figure 36: Europe Membrane Boxes Volume (K), by Country 2025 & 2033
- Figure 37: Europe Membrane Boxes Revenue Share (%), by Country 2025 & 2033
- Figure 38: Europe Membrane Boxes Volume Share (%), by Country 2025 & 2033
- Figure 39: Middle East & Africa Membrane Boxes Revenue (undefined), by Application 2025 & 2033
- Figure 40: Middle East & Africa Membrane Boxes Volume (K), by Application 2025 & 2033
- Figure 41: Middle East & Africa Membrane Boxes Revenue Share (%), by Application 2025 & 2033
- Figure 42: Middle East & Africa Membrane Boxes Volume Share (%), by Application 2025 & 2033
- Figure 43: Middle East & Africa Membrane Boxes Revenue (undefined), by Type 2025 & 2033
- Figure 44: Middle East & Africa Membrane Boxes Volume (K), by Type 2025 & 2033
- Figure 45: Middle East & Africa Membrane Boxes Revenue Share (%), by Type 2025 & 2033
- Figure 46: Middle East & Africa Membrane Boxes Volume Share (%), by Type 2025 & 2033
- Figure 47: Middle East & Africa Membrane Boxes Revenue (undefined), by Country 2025 & 2033
- Figure 48: Middle East & Africa Membrane Boxes Volume (K), by Country 2025 & 2033
- Figure 49: Middle East & Africa Membrane Boxes Revenue Share (%), by Country 2025 & 2033
- Figure 50: Middle East & Africa Membrane Boxes Volume Share (%), by Country 2025 & 2033
- Figure 51: Asia Pacific Membrane Boxes Revenue (undefined), by Application 2025 & 2033
- Figure 52: Asia Pacific Membrane Boxes Volume (K), by Application 2025 & 2033
- Figure 53: Asia Pacific Membrane Boxes Revenue Share (%), by Application 2025 & 2033
- Figure 54: Asia Pacific Membrane Boxes Volume Share (%), by Application 2025 & 2033
- Figure 55: Asia Pacific Membrane Boxes Revenue (undefined), by Type 2025 & 2033
- Figure 56: Asia Pacific Membrane Boxes Volume (K), by Type 2025 & 2033
- Figure 57: Asia Pacific Membrane Boxes Revenue Share (%), by Type 2025 & 2033
- Figure 58: Asia Pacific Membrane Boxes Volume Share (%), by Type 2025 & 2033
- Figure 59: Asia Pacific Membrane Boxes Revenue (undefined), by Country 2025 & 2033
- Figure 60: Asia Pacific Membrane Boxes Volume (K), by Country 2025 & 2033
- Figure 61: Asia Pacific Membrane Boxes Revenue Share (%), by Country 2025 & 2033
- Figure 62: Asia Pacific Membrane Boxes Volume Share (%), by Country 2025 & 2033
List of Tables
- Table 1: Global Membrane Boxes Revenue undefined Forecast, by Application 2020 & 2033
- Table 2: Global Membrane Boxes Volume K Forecast, by Application 2020 & 2033
- Table 3: Global Membrane Boxes Revenue undefined Forecast, by Type 2020 & 2033
- Table 4: Global Membrane Boxes Volume K Forecast, by Type 2020 & 2033
- Table 5: Global Membrane Boxes Revenue undefined Forecast, by Region 2020 & 2033
- Table 6: Global Membrane Boxes Volume K Forecast, by Region 2020 & 2033
- Table 7: Global Membrane Boxes Revenue undefined Forecast, by Application 2020 & 2033
- Table 8: Global Membrane Boxes Volume K Forecast, by Application 2020 & 2033
- Table 9: Global Membrane Boxes Revenue undefined Forecast, by Type 2020 & 2033
- Table 10: Global Membrane Boxes Volume K Forecast, by Type 2020 & 2033
- Table 11: Global Membrane Boxes Revenue undefined Forecast, by Country 2020 & 2033
- Table 12: Global Membrane Boxes Volume K Forecast, by Country 2020 & 2033
- Table 13: United States Membrane Boxes Revenue (undefined) Forecast, by Application 2020 & 2033
- Table 14: United States Membrane Boxes Volume (K) Forecast, by Application 2020 & 2033
- Table 15: Canada Membrane Boxes Revenue (undefined) Forecast, by Application 2020 & 2033
- Table 16: Canada Membrane Boxes Volume (K) Forecast, by Application 2020 & 2033
- Table 17: Mexico Membrane Boxes Revenue (undefined) Forecast, by Application 2020 & 2033
- Table 18: Mexico Membrane Boxes Volume (K) Forecast, by Application 2020 & 2033
- Table 19: Global Membrane Boxes Revenue undefined Forecast, by Application 2020 & 2033
- Table 20: Global Membrane Boxes Volume K Forecast, by Application 2020 & 2033
- Table 21: Global Membrane Boxes Revenue undefined Forecast, by Type 2020 & 2033
- Table 22: Global Membrane Boxes Volume K Forecast, by Type 2020 & 2033
- Table 23: Global Membrane Boxes Revenue undefined Forecast, by Country 2020 & 2033
- Table 24: Global Membrane Boxes Volume K Forecast, by Country 2020 & 2033
- Table 25: Brazil Membrane Boxes Revenue (undefined) Forecast, by Application 2020 & 2033
- Table 26: Brazil Membrane Boxes Volume (K) Forecast, by Application 2020 & 2033
- Table 27: Argentina Membrane Boxes Revenue (undefined) Forecast, by Application 2020 & 2033
- Table 28: Argentina Membrane Boxes Volume (K) Forecast, by Application 2020 & 2033
- Table 29: Rest of South America Membrane Boxes Revenue (undefined) Forecast, by Application 2020 & 2033
- Table 30: Rest of South America Membrane Boxes Volume (K) Forecast, by Application 2020 & 2033
- Table 31: Global Membrane Boxes Revenue undefined Forecast, by Application 2020 & 2033
- Table 32: Global Membrane Boxes Volume K Forecast, by Application 2020 & 2033
- Table 33: Global Membrane Boxes Revenue undefined Forecast, by Type 2020 & 2033
- Table 34: Global Membrane Boxes Volume K Forecast, by Type 2020 & 2033
- Table 35: Global Membrane Boxes Revenue undefined Forecast, by Country 2020 & 2033
- Table 36: Global Membrane Boxes Volume K Forecast, by Country 2020 & 2033
- Table 37: United Kingdom Membrane Boxes Revenue (undefined) Forecast, by Application 2020 & 2033
- Table 38: United Kingdom Membrane Boxes Volume (K) Forecast, by Application 2020 & 2033
- Table 39: Germany Membrane Boxes Revenue (undefined) Forecast, by Application 2020 & 2033
- Table 40: Germany Membrane Boxes Volume (K) Forecast, by Application 2020 & 2033
- Table 41: France Membrane Boxes Revenue (undefined) Forecast, by Application 2020 & 2033
- Table 42: France Membrane Boxes Volume (K) Forecast, by Application 2020 & 2033
- Table 43: Italy Membrane Boxes Revenue (undefined) Forecast, by Application 2020 & 2033
- Table 44: Italy Membrane Boxes Volume (K) Forecast, by Application 2020 & 2033
- Table 45: Spain Membrane Boxes Revenue (undefined) Forecast, by Application 2020 & 2033
- Table 46: Spain Membrane Boxes Volume (K) Forecast, by Application 2020 & 2033
- Table 47: Russia Membrane Boxes Revenue (undefined) Forecast, by Application 2020 & 2033
- Table 48: Russia Membrane Boxes Volume (K) Forecast, by Application 2020 & 2033
- Table 49: Benelux Membrane Boxes Revenue (undefined) Forecast, by Application 2020 & 2033
- Table 50: Benelux Membrane Boxes Volume (K) Forecast, by Application 2020 & 2033
- Table 51: Nordics Membrane Boxes Revenue (undefined) Forecast, by Application 2020 & 2033
- Table 52: Nordics Membrane Boxes Volume (K) Forecast, by Application 2020 & 2033
- Table 53: Rest of Europe Membrane Boxes Revenue (undefined) Forecast, by Application 2020 & 2033
- Table 54: Rest of Europe Membrane Boxes Volume (K) Forecast, by Application 2020 & 2033
- Table 55: Global Membrane Boxes Revenue undefined Forecast, by Application 2020 & 2033
- Table 56: Global Membrane Boxes Volume K Forecast, by Application 2020 & 2033
- Table 57: Global Membrane Boxes Revenue undefined Forecast, by Type 2020 & 2033
- Table 58: Global Membrane Boxes Volume K Forecast, by Type 2020 & 2033
- Table 59: Global Membrane Boxes Revenue undefined Forecast, by Country 2020 & 2033
- Table 60: Global Membrane Boxes Volume K Forecast, by Country 2020 & 2033
- Table 61: Turkey Membrane Boxes Revenue (undefined) Forecast, by Application 2020 & 2033
- Table 62: Turkey Membrane Boxes Volume (K) Forecast, by Application 2020 & 2033
- Table 63: Israel Membrane Boxes Revenue (undefined) Forecast, by Application 2020 & 2033
- Table 64: Israel Membrane Boxes Volume (K) Forecast, by Application 2020 & 2033
- Table 65: GCC Membrane Boxes Revenue (undefined) Forecast, by Application 2020 & 2033
- Table 66: GCC Membrane Boxes Volume (K) Forecast, by Application 2020 & 2033
- Table 67: North Africa Membrane Boxes Revenue (undefined) Forecast, by Application 2020 & 2033
- Table 68: North Africa Membrane Boxes Volume (K) Forecast, by Application 2020 & 2033
- Table 69: South Africa Membrane Boxes Revenue (undefined) Forecast, by Application 2020 & 2033
- Table 70: South Africa Membrane Boxes Volume (K) Forecast, by Application 2020 & 2033
- Table 71: Rest of Middle East & Africa Membrane Boxes Revenue (undefined) Forecast, by Application 2020 & 2033
- Table 72: Rest of Middle East & Africa Membrane Boxes Volume (K) Forecast, by Application 2020 & 2033
- Table 73: Global Membrane Boxes Revenue undefined Forecast, by Application 2020 & 2033
- Table 74: Global Membrane Boxes Volume K Forecast, by Application 2020 & 2033
- Table 75: Global Membrane Boxes Revenue undefined Forecast, by Type 2020 & 2033
- Table 76: Global Membrane Boxes Volume K Forecast, by Type 2020 & 2033
- Table 77: Global Membrane Boxes Revenue undefined Forecast, by Country 2020 & 2033
- Table 78: Global Membrane Boxes Volume K Forecast, by Country 2020 & 2033
- Table 79: China Membrane Boxes Revenue (undefined) Forecast, by Application 2020 & 2033
- Table 80: China Membrane Boxes Volume (K) Forecast, by Application 2020 & 2033
- Table 81: India Membrane Boxes Revenue (undefined) Forecast, by Application 2020 & 2033
- Table 82: India Membrane Boxes Volume (K) Forecast, by Application 2020 & 2033
- Table 83: Japan Membrane Boxes Revenue (undefined) Forecast, by Application 2020 & 2033
- Table 84: Japan Membrane Boxes Volume (K) Forecast, by Application 2020 & 2033
- Table 85: South Korea Membrane Boxes Revenue (undefined) Forecast, by Application 2020 & 2033
- Table 86: South Korea Membrane Boxes Volume (K) Forecast, by Application 2020 & 2033
- Table 87: ASEAN Membrane Boxes Revenue (undefined) Forecast, by Application 2020 & 2033
- Table 88: ASEAN Membrane Boxes Volume (K) Forecast, by Application 2020 & 2033
- Table 89: Oceania Membrane Boxes Revenue (undefined) Forecast, by Application 2020 & 2033
- Table 90: Oceania Membrane Boxes Volume (K) Forecast, by Application 2020 & 2033
- Table 91: Rest of Asia Pacific Membrane Boxes Revenue (undefined) Forecast, by Application 2020 & 2033
- Table 92: Rest of Asia Pacific Membrane Boxes Volume (K) Forecast, by Application 2020 & 2033
Frequently Asked Questions
1. What is the projected Compound Annual Growth Rate (CAGR) of the Membrane Boxes?
The projected CAGR is approximately 7.1%.
2. Which companies are prominent players in the Membrane Boxes?
Key companies in the market include Gel-Pak, Ted Pella, Fuzhou CrysPack Opto-Electronic Technology, Structure Probe, WEISHENG Commodity & Package, MTI Corporation, Sunlin Group.
3. What are the main segments of the Membrane Boxes?
The market segments include Application, Type.
4. Can you provide details about the market size?
The market size is estimated to be USD XXX N/A as of 2022.
5. What are some drivers contributing to market growth?
N/A
6. What are the notable trends driving market growth?
N/A
7. Are there any restraints impacting market growth?
N/A
8. Can you provide examples of recent developments in the market?
N/A
9. What pricing options are available for accessing the report?
Pricing options include single-user, multi-user, and enterprise licenses priced at USD 3950.00, USD 5925.00, and USD 7900.00 respectively.
10. Is the market size provided in terms of value or volume?
The market size is provided in terms of value, measured in N/A and volume, measured in K.
11. Are there any specific market keywords associated with the report?
Yes, the market keyword associated with the report is "Membrane Boxes," which aids in identifying and referencing the specific market segment covered.
12. How do I determine which pricing option suits my needs best?
The pricing options vary based on user requirements and access needs. Individual users may opt for single-user licenses, while businesses requiring broader access may choose multi-user or enterprise licenses for cost-effective access to the report.
13. Are there any additional resources or data provided in the Membrane Boxes report?
While the report offers comprehensive insights, it's advisable to review the specific contents or supplementary materials provided to ascertain if additional resources or data are available.
14. How can I stay updated on further developments or reports in the Membrane Boxes?
To stay informed about further developments, trends, and reports in the Membrane Boxes, consider subscribing to industry newsletters, following relevant companies and organizations, or regularly checking reputable industry news sources and publications.
Methodology
Step 1 - Identification of Relevant Samples Size from Population Database


Step 2 - Approaches for Defining Global Market Size (Value, Volume* & Price*)

Note*: In applicable scenarios
Step 3 - Data Sources
Primary Research
- Web Analytics
- Survey Reports
- Research Institute
- Latest Research Reports
- Opinion Leaders
Secondary Research
- Annual Reports
- White Paper
- Latest Press Release
- Industry Association
- Paid Database
- Investor Presentations

Step 4 - Data Triangulation
Involves using different sources of information in order to increase the validity of a study
These sources are likely to be stakeholders in a program - participants, other researchers, program staff, other community members, and so on.
Then we put all data in single framework & apply various statistical tools to find out the dynamic on the market.
During the analysis stage, feedback from the stakeholder groups would be compared to determine areas of agreement as well as areas of divergence