

Key Insights
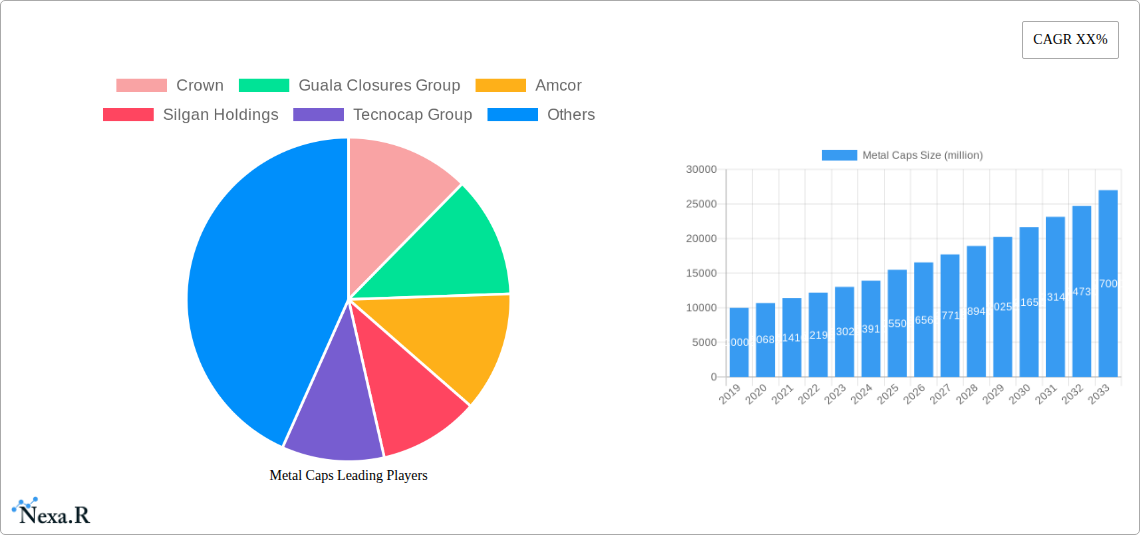
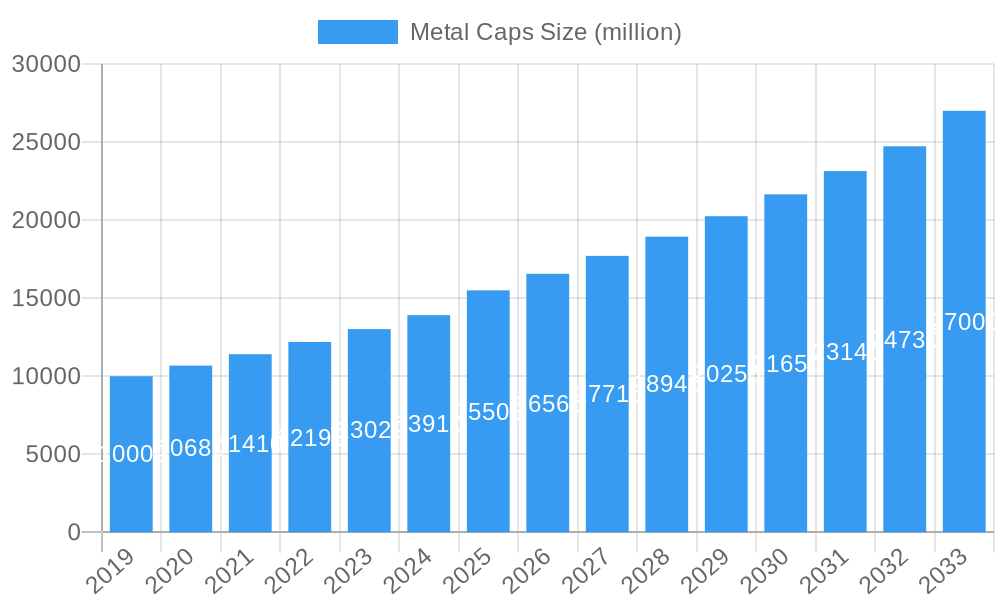
The global metal caps market is projected for substantial growth, estimated at $15,500 million in 2025, with a robust Compound Annual Growth Rate (CAGR) of 6.8% expected to propel it to an estimated $27,000 million by 2033. This expansion is largely driven by the escalating demand across key industries, particularly beverages and food. The inherent advantages of metal caps, such as superior barrier properties against oxygen and moisture, enhanced product shelf-life, and their contribution to tamper-evident sealing, make them indispensable for preserving product integrity and consumer safety. Furthermore, the growing preference for premium packaging solutions and the increasing focus on sustainable and recyclable materials are expected to further fuel market adoption. Innovations in metal cap design, including improved sealing technologies and aesthetic enhancements, are also playing a crucial role in capturing consumer attention and driving market value.
Metal Caps Market Size (In Billion)
Despite the positive outlook, the metal caps market faces certain restraints. The rising cost of raw materials, particularly aluminum and steel, can impact production costs and subsequently influence pricing strategies. Moreover, the increasing competition from alternative capping solutions, such as plastic caps and advanced closures, presents a challenge to market dominance. However, the industry is actively addressing these concerns through technological advancements aimed at improving material efficiency and developing cost-effective production processes. The ongoing emphasis on circular economy principles and the recyclability of metal caps are significant trends that are likely to mitigate environmental concerns and reinforce their long-term viability. The market's segmentation into continuous thread, unishells, and other types, alongside a diverse range of applications, indicates a dynamic and evolving landscape catering to a broad spectrum of consumer and industrial needs.
Metal Caps Company Market Share
Metal Caps Market Report: Comprehensive Analysis & Future Outlook (2019-2033)
This comprehensive report provides an in-depth analysis of the global metal caps market, covering dynamics, growth trends, regional dominance, product landscape, key drivers, challenges, emerging opportunities, and a detailed outlook. With a study period spanning from 2019 to 2033, including a base year of 2025 and a forecast period from 2025 to 2033, this report equips industry professionals with actionable insights and data-driven strategies. The parent market for metal caps encompasses the broader packaging industry, with child markets including closures for beverages, food, pharmaceuticals, and other specialized applications.
Metal Caps Market Dynamics & Structure
The global metal caps market is characterized by a moderately consolidated structure, with a few major players holding significant market shares. Technological innovation is a key driver, with continuous advancements in material science, sealing technologies, and manufacturing processes enhancing product performance and sustainability. Regulatory frameworks, particularly concerning food safety, environmental impact, and material recyclability, are increasingly shaping market strategies. Competitive product substitutes, such as plastic caps and closures, pose a constant challenge, necessitating innovation in metal cap design and functionality to maintain market relevance. End-user demographics, influenced by growing demand for convenience, shelf-stability, and premium packaging, are also pivotal. Mergers and acquisitions (M&A) are prevalent, indicating a strategic consolidation trend as companies aim to expand their product portfolios, geographical reach, and technological capabilities.
- Market Concentration: Dominated by key players with significant market influence.
- Technological Innovation Drivers: Focus on advanced sealing, lighter materials, and enhanced tamper-evidence.
- Regulatory Frameworks: Increasing emphasis on food safety, environmental sustainability, and recycling initiatives.
- Competitive Product Substitutes: Ongoing competition from plastic and alternative closure materials.
- End-User Demographics: Driven by consumer preferences for convenience, preservation, and aesthetic appeal.
- M&A Trends: Strategic acquisitions to gain market share, access new technologies, and diversify offerings.
Metal Caps Growth Trends & Insights
The metal caps market is projected to experience robust growth, driven by a confluence of factors influencing its evolution. The market size is expected to witness a significant expansion from its historical figures in the 2019-2024 period, with a projected Compound Annual Growth Rate (CAGR) of approximately 5.5% during the forecast period of 2025-2033. This growth is fueled by increasing demand across various end-use applications, particularly in the beverage and pharmaceutical sectors, where stringent preservation and tamper-evident features are paramount. Adoption rates for innovative metal cap designs, such as those incorporating enhanced sealing capabilities and user-friendly opening mechanisms, are on the rise. Technological disruptions in manufacturing, including automation and advanced coating techniques, are contributing to improved efficiency and product quality, thereby driving market penetration. Consumer behavior shifts towards sustainable packaging solutions also favor metal caps due to their recyclability, a trend that is expected to further accelerate market adoption. The base year value for 2025 is estimated at USD 12,500 million units, with a projected market size of USD 17,500 million units by 2033. Historical data indicates a market size of USD 10,000 million units in 2019.
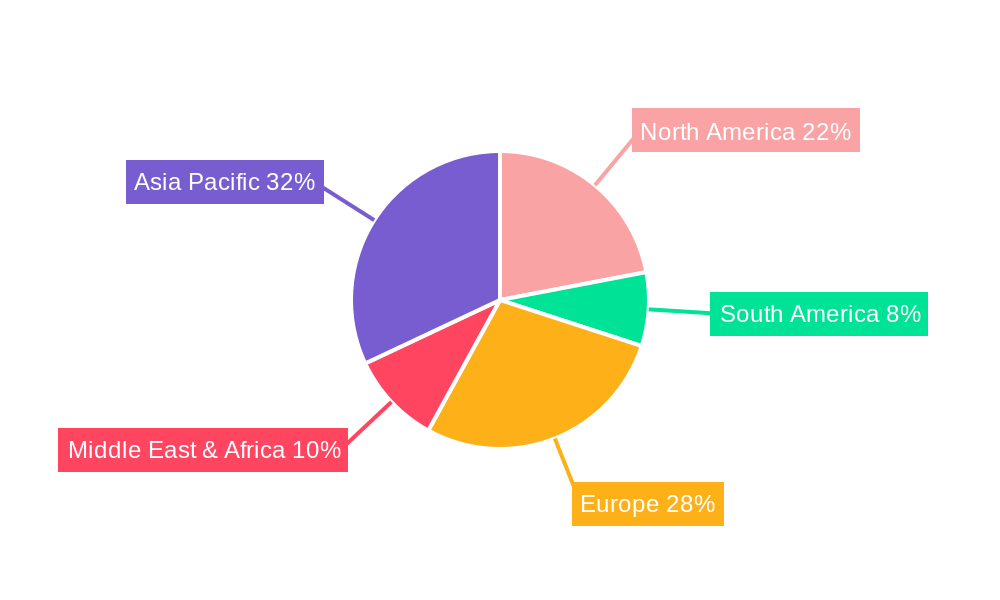
Dominant Regions, Countries, or Segments in Metal Caps
The Beverages application segment, within the broader metal caps market, stands as a dominant force, consistently driving significant market growth. This dominance is attributed to the sheer volume of bottled and canned beverages globally, encompassing everything from carbonated soft drinks and water to alcoholic beverages and juices. The inherent need for robust sealing, extended shelf life, and tamper-evident features makes metal caps an indispensable choice for this sector. North America and Europe currently lead in market share for beverage metal caps, driven by established consumption patterns and a mature beverage industry. However, the Asia-Pacific region, particularly countries like China and India, presents the most substantial growth potential due to a rapidly expanding middle class, increasing disposable income, and a growing appetite for packaged beverages. Economic policies supporting manufacturing and export, coupled with improving infrastructure for distribution and retail, are key accelerators in these burgeoning markets. The continuous thread type of metal caps is particularly prevalent within the beverages segment, offering a reliable and cost-effective sealing solution. The market size for metal caps in the beverages segment is estimated at USD 6,000 million units in the base year 2025, with a projected growth to USD 8,500 million units by 2033.
- Leading Segment: Beverages, driven by high consumption volumes and the need for reliable closures.
- Dominant Regions: North America and Europe currently hold the largest market share.
- High Growth Potential Region: Asia-Pacific, fueled by economic development and increasing beverage consumption.
- Key Drivers in Asia-Pacific: Growing middle class, rising disposable incomes, and expanding retail infrastructure.
- Predominant Cap Type: Continuous Thread caps are widely adopted in the beverage industry for their efficiency and effectiveness.
- Market Share in Beverages (2025): Approximately 48% of the total metal caps market.
Metal Caps Product Landscape
The metal caps product landscape is characterized by a relentless pursuit of enhanced functionality and sustainability. Innovations are focused on improved tamper-evident features, offering consumers greater confidence in product integrity. Advanced sealing technologies ensure superior barrier properties, crucial for extending shelf life, particularly in food and pharmaceutical applications. The development of lighter-weight metal caps, without compromising on strength, addresses cost-efficiency and environmental concerns. Furthermore, the adoption of sophisticated internal and external coatings provides enhanced corrosion resistance and compatibility with diverse product contents. Companies are also exploring aesthetically pleasing designs and customized finishes to meet brand differentiation needs, a key selling proposition in competitive consumer markets. The performance metrics being optimized include sealing integrity, ease of opening, compatibility with various container neck finishes, and recyclability.
Key Drivers, Barriers & Challenges in Metal Caps
The metal caps industry is propelled by several key drivers, including the growing demand for convenient and shelf-stable packaged goods, particularly in emerging economies. The inherent recyclability of metal caps aligns with increasing global sustainability initiatives, making them an attractive choice for environmentally conscious consumers and manufacturers. Technological advancements in manufacturing processes, leading to cost efficiencies and improved product quality, also act as significant growth accelerators.
However, the industry faces several barriers and challenges. The fluctuating prices of raw materials, primarily aluminum and tinplate, can impact manufacturing costs and profit margins. Intense competition from alternative closure materials, particularly plastics, necessitates continuous innovation and competitive pricing. Stringent regulatory requirements related to food safety and packaging materials can also pose compliance challenges. Supply chain disruptions, as seen in recent global events, can impact the availability and cost of raw materials and finished products. The market size for raw materials for metal caps was estimated at USD 4,000 million units in 2024.
Emerging Opportunities in Metal Caps
Emerging opportunities in the metal caps market lie in the increasing demand for sustainable and premium packaging solutions across various sectors. The growing trend of craft beverages and artisanal food products presents a niche for customized and aesthetically superior metal caps. Furthermore, the pharmaceutical industry's need for highly secure and tamper-evident closures for sensitive medications continues to drive innovation in specialized metal cap designs. Untapped markets in developing regions offer substantial growth potential as their economies expand and packaged goods consumption rises. The integration of smart technologies, such as RFID tags or QR codes on metal caps for supply chain traceability and consumer engagement, also represents an exciting avenue for future development.
Growth Accelerators in the Metal Caps Industry
The long-term growth of the metal caps industry is being significantly accelerated by technological breakthroughs in material science and manufacturing. Innovations leading to lighter, more durable, and cost-effective metal caps are enhancing their competitive edge. Strategic partnerships between metal cap manufacturers and packaging companies are fostering collaborative product development and expanding market reach. Furthermore, proactive engagement with regulatory bodies to promote the recyclability and sustainability of metal caps is crucial for long-term market acceptance. Market expansion strategies focusing on emerging economies and niche applications are also acting as key growth accelerators.
Key Players Shaping the Metal Caps Market
- Crown
- Guala Closures Group
- Amcor
- Silgan Holdings
- Tecnocap Group
- Massilly
- Federfin Tech
- Herti JSC
- Roberts Metal Packaging
- Torrent Closures
- Keystone Cap Company
- P. Wilkinson Containers Ltd
- Nepak Ltd
- Tin Cap
Notable Milestones in Metal Caps Sector
- 2019: Increased adoption of lightweight aluminum caps for beverage bottles to reduce material usage and transportation costs.
- 2020: Enhanced focus on tamper-evident features in pharmaceutical metal caps driven by regulatory scrutiny and consumer safety concerns.
- 2021: Development of advanced internal lacquers for enhanced compatibility with acidic food products, extending shelf life.
- 2022: Significant investment in sustainable manufacturing processes, including increased use of recycled aluminum content.
- 2023: Introduction of innovative easy-open metal caps for increased consumer convenience across food and beverage applications.
- 2024: Growing trend of personalized and custom-designed metal caps for premium product branding.
- 2025 (Estimated): Anticipated advancements in smart packaging integration, including RFID technology in metal caps for supply chain management.
- 2026-2033 (Forecast): Continued innovation in material science leading to thinner, stronger, and more eco-friendly metal cap solutions.
In-Depth Metal Caps Market Outlook
The future of the metal caps market is exceptionally promising, fueled by sustained growth accelerators and emerging opportunities. The ongoing commitment to sustainability will continue to favor metal caps due to their inherent recyclability, aligning with global environmental mandates and consumer preferences. Technological advancements in manufacturing, including Industry 4.0 integration and automation, will drive efficiency, reduce costs, and enable greater customization. Strategic partnerships and targeted market expansion, particularly in developing regions, will be crucial for capturing new market share. The market is poised for continued innovation, with an emphasis on enhanced product functionality, user experience, and aesthetic appeal. The forecast period of 2025-2033 is expected to witness a dynamic market landscape, driven by evolving consumer demands and a commitment to delivering high-performance, sustainable packaging solutions. The estimated market size for metal caps in 2025 is USD 12,500 million units, with a projected growth to USD 17,500 million units by 2033.
Metal Caps Segmentation
-
1. Application
- 1.1. Beverages
- 1.2. Food
- 1.3. Pharmaceuticals
- 1.4. Others
-
2. Types
- 2.1. Continuous Thread
- 2.2. Unishells
- 2.3. Others
Metal Caps Segmentation By Geography
-
1. North America
- 1.1. United States
- 1.2. Canada
- 1.3. Mexico
-
2. South America
- 2.1. Brazil
- 2.2. Argentina
- 2.3. Rest of South America
-
3. Europe
- 3.1. United Kingdom
- 3.2. Germany
- 3.3. France
- 3.4. Italy
- 3.5. Spain
- 3.6. Russia
- 3.7. Benelux
- 3.8. Nordics
- 3.9. Rest of Europe
-
4. Middle East & Africa
- 4.1. Turkey
- 4.2. Israel
- 4.3. GCC
- 4.4. North Africa
- 4.5. South Africa
- 4.6. Rest of Middle East & Africa
-
5. Asia Pacific
- 5.1. China
- 5.2. India
- 5.3. Japan
- 5.4. South Korea
- 5.5. ASEAN
- 5.6. Oceania
- 5.7. Rest of Asia Pacific
Metal Caps Regional Market Share
Geographic Coverage of Metal Caps
Metal Caps REPORT HIGHLIGHTS
| Aspects | Details |
|---|---|
| Study Period | 2020-2034 |
| Base Year | 2025 |
| Estimated Year | 2026 |
| Forecast Period | 2026-2034 |
| Historical Period | 2020-2025 |
| Growth Rate | CAGR of 4.6% from 2020-2034 |
| Segmentation |
|
Table of Contents
- 1. Introduction
- 1.1. Research Scope
- 1.2. Market Segmentation
- 1.3. Research Methodology
- 1.4. Definitions and Assumptions
- 2. Executive Summary
- 2.1. Introduction
- 3. Market Dynamics
- 3.1. Introduction
- 3.2. Market Drivers
- 3.3. Market Restrains
- 3.4. Market Trends
- 4. Market Factor Analysis
- 4.1. Porters Five Forces
- 4.2. Supply/Value Chain
- 4.3. PESTEL analysis
- 4.4. Market Entropy
- 4.5. Patent/Trademark Analysis
- 5. Global Metal Caps Analysis, Insights and Forecast, 2020-2032
- 5.1. Market Analysis, Insights and Forecast - by Application
- 5.1.1. Beverages
- 5.1.2. Food
- 5.1.3. Pharmaceuticals
- 5.1.4. Others
- 5.2. Market Analysis, Insights and Forecast - by Types
- 5.2.1. Continuous Thread
- 5.2.2. Unishells
- 5.2.3. Others
- 5.3. Market Analysis, Insights and Forecast - by Region
- 5.3.1. North America
- 5.3.2. South America
- 5.3.3. Europe
- 5.3.4. Middle East & Africa
- 5.3.5. Asia Pacific
- 5.1. Market Analysis, Insights and Forecast - by Application
- 6. North America Metal Caps Analysis, Insights and Forecast, 2020-2032
- 6.1. Market Analysis, Insights and Forecast - by Application
- 6.1.1. Beverages
- 6.1.2. Food
- 6.1.3. Pharmaceuticals
- 6.1.4. Others
- 6.2. Market Analysis, Insights and Forecast - by Types
- 6.2.1. Continuous Thread
- 6.2.2. Unishells
- 6.2.3. Others
- 6.1. Market Analysis, Insights and Forecast - by Application
- 7. South America Metal Caps Analysis, Insights and Forecast, 2020-2032
- 7.1. Market Analysis, Insights and Forecast - by Application
- 7.1.1. Beverages
- 7.1.2. Food
- 7.1.3. Pharmaceuticals
- 7.1.4. Others
- 7.2. Market Analysis, Insights and Forecast - by Types
- 7.2.1. Continuous Thread
- 7.2.2. Unishells
- 7.2.3. Others
- 7.1. Market Analysis, Insights and Forecast - by Application
- 8. Europe Metal Caps Analysis, Insights and Forecast, 2020-2032
- 8.1. Market Analysis, Insights and Forecast - by Application
- 8.1.1. Beverages
- 8.1.2. Food
- 8.1.3. Pharmaceuticals
- 8.1.4. Others
- 8.2. Market Analysis, Insights and Forecast - by Types
- 8.2.1. Continuous Thread
- 8.2.2. Unishells
- 8.2.3. Others
- 8.1. Market Analysis, Insights and Forecast - by Application
- 9. Middle East & Africa Metal Caps Analysis, Insights and Forecast, 2020-2032
- 9.1. Market Analysis, Insights and Forecast - by Application
- 9.1.1. Beverages
- 9.1.2. Food
- 9.1.3. Pharmaceuticals
- 9.1.4. Others
- 9.2. Market Analysis, Insights and Forecast - by Types
- 9.2.1. Continuous Thread
- 9.2.2. Unishells
- 9.2.3. Others
- 9.1. Market Analysis, Insights and Forecast - by Application
- 10. Asia Pacific Metal Caps Analysis, Insights and Forecast, 2020-2032
- 10.1. Market Analysis, Insights and Forecast - by Application
- 10.1.1. Beverages
- 10.1.2. Food
- 10.1.3. Pharmaceuticals
- 10.1.4. Others
- 10.2. Market Analysis, Insights and Forecast - by Types
- 10.2.1. Continuous Thread
- 10.2.2. Unishells
- 10.2.3. Others
- 10.1. Market Analysis, Insights and Forecast - by Application
- 11. Competitive Analysis
- 11.1. Global Market Share Analysis 2025
- 11.2. Company Profiles
- 11.2.1 Crown
- 11.2.1.1. Overview
- 11.2.1.2. Products
- 11.2.1.3. SWOT Analysis
- 11.2.1.4. Recent Developments
- 11.2.1.5. Financials (Based on Availability)
- 11.2.2 Guala Closures Group
- 11.2.2.1. Overview
- 11.2.2.2. Products
- 11.2.2.3. SWOT Analysis
- 11.2.2.4. Recent Developments
- 11.2.2.5. Financials (Based on Availability)
- 11.2.3 Amcor
- 11.2.3.1. Overview
- 11.2.3.2. Products
- 11.2.3.3. SWOT Analysis
- 11.2.3.4. Recent Developments
- 11.2.3.5. Financials (Based on Availability)
- 11.2.4 Silgan Holdings
- 11.2.4.1. Overview
- 11.2.4.2. Products
- 11.2.4.3. SWOT Analysis
- 11.2.4.4. Recent Developments
- 11.2.4.5. Financials (Based on Availability)
- 11.2.5 Tecnocap Group
- 11.2.5.1. Overview
- 11.2.5.2. Products
- 11.2.5.3. SWOT Analysis
- 11.2.5.4. Recent Developments
- 11.2.5.5. Financials (Based on Availability)
- 11.2.6 Massilly
- 11.2.6.1. Overview
- 11.2.6.2. Products
- 11.2.6.3. SWOT Analysis
- 11.2.6.4. Recent Developments
- 11.2.6.5. Financials (Based on Availability)
- 11.2.7 Federfin Tech
- 11.2.7.1. Overview
- 11.2.7.2. Products
- 11.2.7.3. SWOT Analysis
- 11.2.7.4. Recent Developments
- 11.2.7.5. Financials (Based on Availability)
- 11.2.8 Herti JSC
- 11.2.8.1. Overview
- 11.2.8.2. Products
- 11.2.8.3. SWOT Analysis
- 11.2.8.4. Recent Developments
- 11.2.8.5. Financials (Based on Availability)
- 11.2.9 Roberts Metal Packaging
- 11.2.9.1. Overview
- 11.2.9.2. Products
- 11.2.9.3. SWOT Analysis
- 11.2.9.4. Recent Developments
- 11.2.9.5. Financials (Based on Availability)
- 11.2.10 Torrent Closures
- 11.2.10.1. Overview
- 11.2.10.2. Products
- 11.2.10.3. SWOT Analysis
- 11.2.10.4. Recent Developments
- 11.2.10.5. Financials (Based on Availability)
- 11.2.11 Keystone Cap Company
- 11.2.11.1. Overview
- 11.2.11.2. Products
- 11.2.11.3. SWOT Analysis
- 11.2.11.4. Recent Developments
- 11.2.11.5. Financials (Based on Availability)
- 11.2.12 P. Wilkinson Containers Ltd
- 11.2.12.1. Overview
- 11.2.12.2. Products
- 11.2.12.3. SWOT Analysis
- 11.2.12.4. Recent Developments
- 11.2.12.5. Financials (Based on Availability)
- 11.2.13 Nepak Ltd
- 11.2.13.1. Overview
- 11.2.13.2. Products
- 11.2.13.3. SWOT Analysis
- 11.2.13.4. Recent Developments
- 11.2.13.5. Financials (Based on Availability)
- 11.2.14 Tin Cap
- 11.2.14.1. Overview
- 11.2.14.2. Products
- 11.2.14.3. SWOT Analysis
- 11.2.14.4. Recent Developments
- 11.2.14.5. Financials (Based on Availability)
- 11.2.1 Crown
List of Figures
- Figure 1: Global Metal Caps Revenue Breakdown (undefined, %) by Region 2025 & 2033
- Figure 2: Global Metal Caps Volume Breakdown (K, %) by Region 2025 & 2033
- Figure 3: North America Metal Caps Revenue (undefined), by Application 2025 & 2033
- Figure 4: North America Metal Caps Volume (K), by Application 2025 & 2033
- Figure 5: North America Metal Caps Revenue Share (%), by Application 2025 & 2033
- Figure 6: North America Metal Caps Volume Share (%), by Application 2025 & 2033
- Figure 7: North America Metal Caps Revenue (undefined), by Types 2025 & 2033
- Figure 8: North America Metal Caps Volume (K), by Types 2025 & 2033
- Figure 9: North America Metal Caps Revenue Share (%), by Types 2025 & 2033
- Figure 10: North America Metal Caps Volume Share (%), by Types 2025 & 2033
- Figure 11: North America Metal Caps Revenue (undefined), by Country 2025 & 2033
- Figure 12: North America Metal Caps Volume (K), by Country 2025 & 2033
- Figure 13: North America Metal Caps Revenue Share (%), by Country 2025 & 2033
- Figure 14: North America Metal Caps Volume Share (%), by Country 2025 & 2033
- Figure 15: South America Metal Caps Revenue (undefined), by Application 2025 & 2033
- Figure 16: South America Metal Caps Volume (K), by Application 2025 & 2033
- Figure 17: South America Metal Caps Revenue Share (%), by Application 2025 & 2033
- Figure 18: South America Metal Caps Volume Share (%), by Application 2025 & 2033
- Figure 19: South America Metal Caps Revenue (undefined), by Types 2025 & 2033
- Figure 20: South America Metal Caps Volume (K), by Types 2025 & 2033
- Figure 21: South America Metal Caps Revenue Share (%), by Types 2025 & 2033
- Figure 22: South America Metal Caps Volume Share (%), by Types 2025 & 2033
- Figure 23: South America Metal Caps Revenue (undefined), by Country 2025 & 2033
- Figure 24: South America Metal Caps Volume (K), by Country 2025 & 2033
- Figure 25: South America Metal Caps Revenue Share (%), by Country 2025 & 2033
- Figure 26: South America Metal Caps Volume Share (%), by Country 2025 & 2033
- Figure 27: Europe Metal Caps Revenue (undefined), by Application 2025 & 2033
- Figure 28: Europe Metal Caps Volume (K), by Application 2025 & 2033
- Figure 29: Europe Metal Caps Revenue Share (%), by Application 2025 & 2033
- Figure 30: Europe Metal Caps Volume Share (%), by Application 2025 & 2033
- Figure 31: Europe Metal Caps Revenue (undefined), by Types 2025 & 2033
- Figure 32: Europe Metal Caps Volume (K), by Types 2025 & 2033
- Figure 33: Europe Metal Caps Revenue Share (%), by Types 2025 & 2033
- Figure 34: Europe Metal Caps Volume Share (%), by Types 2025 & 2033
- Figure 35: Europe Metal Caps Revenue (undefined), by Country 2025 & 2033
- Figure 36: Europe Metal Caps Volume (K), by Country 2025 & 2033
- Figure 37: Europe Metal Caps Revenue Share (%), by Country 2025 & 2033
- Figure 38: Europe Metal Caps Volume Share (%), by Country 2025 & 2033
- Figure 39: Middle East & Africa Metal Caps Revenue (undefined), by Application 2025 & 2033
- Figure 40: Middle East & Africa Metal Caps Volume (K), by Application 2025 & 2033
- Figure 41: Middle East & Africa Metal Caps Revenue Share (%), by Application 2025 & 2033
- Figure 42: Middle East & Africa Metal Caps Volume Share (%), by Application 2025 & 2033
- Figure 43: Middle East & Africa Metal Caps Revenue (undefined), by Types 2025 & 2033
- Figure 44: Middle East & Africa Metal Caps Volume (K), by Types 2025 & 2033
- Figure 45: Middle East & Africa Metal Caps Revenue Share (%), by Types 2025 & 2033
- Figure 46: Middle East & Africa Metal Caps Volume Share (%), by Types 2025 & 2033
- Figure 47: Middle East & Africa Metal Caps Revenue (undefined), by Country 2025 & 2033
- Figure 48: Middle East & Africa Metal Caps Volume (K), by Country 2025 & 2033
- Figure 49: Middle East & Africa Metal Caps Revenue Share (%), by Country 2025 & 2033
- Figure 50: Middle East & Africa Metal Caps Volume Share (%), by Country 2025 & 2033
- Figure 51: Asia Pacific Metal Caps Revenue (undefined), by Application 2025 & 2033
- Figure 52: Asia Pacific Metal Caps Volume (K), by Application 2025 & 2033
- Figure 53: Asia Pacific Metal Caps Revenue Share (%), by Application 2025 & 2033
- Figure 54: Asia Pacific Metal Caps Volume Share (%), by Application 2025 & 2033
- Figure 55: Asia Pacific Metal Caps Revenue (undefined), by Types 2025 & 2033
- Figure 56: Asia Pacific Metal Caps Volume (K), by Types 2025 & 2033
- Figure 57: Asia Pacific Metal Caps Revenue Share (%), by Types 2025 & 2033
- Figure 58: Asia Pacific Metal Caps Volume Share (%), by Types 2025 & 2033
- Figure 59: Asia Pacific Metal Caps Revenue (undefined), by Country 2025 & 2033
- Figure 60: Asia Pacific Metal Caps Volume (K), by Country 2025 & 2033
- Figure 61: Asia Pacific Metal Caps Revenue Share (%), by Country 2025 & 2033
- Figure 62: Asia Pacific Metal Caps Volume Share (%), by Country 2025 & 2033
List of Tables
- Table 1: Global Metal Caps Revenue undefined Forecast, by Application 2020 & 2033
- Table 2: Global Metal Caps Volume K Forecast, by Application 2020 & 2033
- Table 3: Global Metal Caps Revenue undefined Forecast, by Types 2020 & 2033
- Table 4: Global Metal Caps Volume K Forecast, by Types 2020 & 2033
- Table 5: Global Metal Caps Revenue undefined Forecast, by Region 2020 & 2033
- Table 6: Global Metal Caps Volume K Forecast, by Region 2020 & 2033
- Table 7: Global Metal Caps Revenue undefined Forecast, by Application 2020 & 2033
- Table 8: Global Metal Caps Volume K Forecast, by Application 2020 & 2033
- Table 9: Global Metal Caps Revenue undefined Forecast, by Types 2020 & 2033
- Table 10: Global Metal Caps Volume K Forecast, by Types 2020 & 2033
- Table 11: Global Metal Caps Revenue undefined Forecast, by Country 2020 & 2033
- Table 12: Global Metal Caps Volume K Forecast, by Country 2020 & 2033
- Table 13: United States Metal Caps Revenue (undefined) Forecast, by Application 2020 & 2033
- Table 14: United States Metal Caps Volume (K) Forecast, by Application 2020 & 2033
- Table 15: Canada Metal Caps Revenue (undefined) Forecast, by Application 2020 & 2033
- Table 16: Canada Metal Caps Volume (K) Forecast, by Application 2020 & 2033
- Table 17: Mexico Metal Caps Revenue (undefined) Forecast, by Application 2020 & 2033
- Table 18: Mexico Metal Caps Volume (K) Forecast, by Application 2020 & 2033
- Table 19: Global Metal Caps Revenue undefined Forecast, by Application 2020 & 2033
- Table 20: Global Metal Caps Volume K Forecast, by Application 2020 & 2033
- Table 21: Global Metal Caps Revenue undefined Forecast, by Types 2020 & 2033
- Table 22: Global Metal Caps Volume K Forecast, by Types 2020 & 2033
- Table 23: Global Metal Caps Revenue undefined Forecast, by Country 2020 & 2033
- Table 24: Global Metal Caps Volume K Forecast, by Country 2020 & 2033
- Table 25: Brazil Metal Caps Revenue (undefined) Forecast, by Application 2020 & 2033
- Table 26: Brazil Metal Caps Volume (K) Forecast, by Application 2020 & 2033
- Table 27: Argentina Metal Caps Revenue (undefined) Forecast, by Application 2020 & 2033
- Table 28: Argentina Metal Caps Volume (K) Forecast, by Application 2020 & 2033
- Table 29: Rest of South America Metal Caps Revenue (undefined) Forecast, by Application 2020 & 2033
- Table 30: Rest of South America Metal Caps Volume (K) Forecast, by Application 2020 & 2033
- Table 31: Global Metal Caps Revenue undefined Forecast, by Application 2020 & 2033
- Table 32: Global Metal Caps Volume K Forecast, by Application 2020 & 2033
- Table 33: Global Metal Caps Revenue undefined Forecast, by Types 2020 & 2033
- Table 34: Global Metal Caps Volume K Forecast, by Types 2020 & 2033
- Table 35: Global Metal Caps Revenue undefined Forecast, by Country 2020 & 2033
- Table 36: Global Metal Caps Volume K Forecast, by Country 2020 & 2033
- Table 37: United Kingdom Metal Caps Revenue (undefined) Forecast, by Application 2020 & 2033
- Table 38: United Kingdom Metal Caps Volume (K) Forecast, by Application 2020 & 2033
- Table 39: Germany Metal Caps Revenue (undefined) Forecast, by Application 2020 & 2033
- Table 40: Germany Metal Caps Volume (K) Forecast, by Application 2020 & 2033
- Table 41: France Metal Caps Revenue (undefined) Forecast, by Application 2020 & 2033
- Table 42: France Metal Caps Volume (K) Forecast, by Application 2020 & 2033
- Table 43: Italy Metal Caps Revenue (undefined) Forecast, by Application 2020 & 2033
- Table 44: Italy Metal Caps Volume (K) Forecast, by Application 2020 & 2033
- Table 45: Spain Metal Caps Revenue (undefined) Forecast, by Application 2020 & 2033
- Table 46: Spain Metal Caps Volume (K) Forecast, by Application 2020 & 2033
- Table 47: Russia Metal Caps Revenue (undefined) Forecast, by Application 2020 & 2033
- Table 48: Russia Metal Caps Volume (K) Forecast, by Application 2020 & 2033
- Table 49: Benelux Metal Caps Revenue (undefined) Forecast, by Application 2020 & 2033
- Table 50: Benelux Metal Caps Volume (K) Forecast, by Application 2020 & 2033
- Table 51: Nordics Metal Caps Revenue (undefined) Forecast, by Application 2020 & 2033
- Table 52: Nordics Metal Caps Volume (K) Forecast, by Application 2020 & 2033
- Table 53: Rest of Europe Metal Caps Revenue (undefined) Forecast, by Application 2020 & 2033
- Table 54: Rest of Europe Metal Caps Volume (K) Forecast, by Application 2020 & 2033
- Table 55: Global Metal Caps Revenue undefined Forecast, by Application 2020 & 2033
- Table 56: Global Metal Caps Volume K Forecast, by Application 2020 & 2033
- Table 57: Global Metal Caps Revenue undefined Forecast, by Types 2020 & 2033
- Table 58: Global Metal Caps Volume K Forecast, by Types 2020 & 2033
- Table 59: Global Metal Caps Revenue undefined Forecast, by Country 2020 & 2033
- Table 60: Global Metal Caps Volume K Forecast, by Country 2020 & 2033
- Table 61: Turkey Metal Caps Revenue (undefined) Forecast, by Application 2020 & 2033
- Table 62: Turkey Metal Caps Volume (K) Forecast, by Application 2020 & 2033
- Table 63: Israel Metal Caps Revenue (undefined) Forecast, by Application 2020 & 2033
- Table 64: Israel Metal Caps Volume (K) Forecast, by Application 2020 & 2033
- Table 65: GCC Metal Caps Revenue (undefined) Forecast, by Application 2020 & 2033
- Table 66: GCC Metal Caps Volume (K) Forecast, by Application 2020 & 2033
- Table 67: North Africa Metal Caps Revenue (undefined) Forecast, by Application 2020 & 2033
- Table 68: North Africa Metal Caps Volume (K) Forecast, by Application 2020 & 2033
- Table 69: South Africa Metal Caps Revenue (undefined) Forecast, by Application 2020 & 2033
- Table 70: South Africa Metal Caps Volume (K) Forecast, by Application 2020 & 2033
- Table 71: Rest of Middle East & Africa Metal Caps Revenue (undefined) Forecast, by Application 2020 & 2033
- Table 72: Rest of Middle East & Africa Metal Caps Volume (K) Forecast, by Application 2020 & 2033
- Table 73: Global Metal Caps Revenue undefined Forecast, by Application 2020 & 2033
- Table 74: Global Metal Caps Volume K Forecast, by Application 2020 & 2033
- Table 75: Global Metal Caps Revenue undefined Forecast, by Types 2020 & 2033
- Table 76: Global Metal Caps Volume K Forecast, by Types 2020 & 2033
- Table 77: Global Metal Caps Revenue undefined Forecast, by Country 2020 & 2033
- Table 78: Global Metal Caps Volume K Forecast, by Country 2020 & 2033
- Table 79: China Metal Caps Revenue (undefined) Forecast, by Application 2020 & 2033
- Table 80: China Metal Caps Volume (K) Forecast, by Application 2020 & 2033
- Table 81: India Metal Caps Revenue (undefined) Forecast, by Application 2020 & 2033
- Table 82: India Metal Caps Volume (K) Forecast, by Application 2020 & 2033
- Table 83: Japan Metal Caps Revenue (undefined) Forecast, by Application 2020 & 2033
- Table 84: Japan Metal Caps Volume (K) Forecast, by Application 2020 & 2033
- Table 85: South Korea Metal Caps Revenue (undefined) Forecast, by Application 2020 & 2033
- Table 86: South Korea Metal Caps Volume (K) Forecast, by Application 2020 & 2033
- Table 87: ASEAN Metal Caps Revenue (undefined) Forecast, by Application 2020 & 2033
- Table 88: ASEAN Metal Caps Volume (K) Forecast, by Application 2020 & 2033
- Table 89: Oceania Metal Caps Revenue (undefined) Forecast, by Application 2020 & 2033
- Table 90: Oceania Metal Caps Volume (K) Forecast, by Application 2020 & 2033
- Table 91: Rest of Asia Pacific Metal Caps Revenue (undefined) Forecast, by Application 2020 & 2033
- Table 92: Rest of Asia Pacific Metal Caps Volume (K) Forecast, by Application 2020 & 2033
Frequently Asked Questions
1. What is the projected Compound Annual Growth Rate (CAGR) of the Metal Caps?
The projected CAGR is approximately 4.6%.
2. Which companies are prominent players in the Metal Caps?
Key companies in the market include Crown, Guala Closures Group, Amcor, Silgan Holdings, Tecnocap Group, Massilly, Federfin Tech, Herti JSC, Roberts Metal Packaging, Torrent Closures, Keystone Cap Company, P. Wilkinson Containers Ltd, Nepak Ltd, Tin Cap.
3. What are the main segments of the Metal Caps?
The market segments include Application, Types.
4. Can you provide details about the market size?
The market size is estimated to be USD XXX N/A as of 2022.
5. What are some drivers contributing to market growth?
N/A
6. What are the notable trends driving market growth?
N/A
7. Are there any restraints impacting market growth?
N/A
8. Can you provide examples of recent developments in the market?
N/A
9. What pricing options are available for accessing the report?
Pricing options include single-user, multi-user, and enterprise licenses priced at USD 3350.00, USD 5025.00, and USD 6700.00 respectively.
10. Is the market size provided in terms of value or volume?
The market size is provided in terms of value, measured in N/A and volume, measured in K.
11. Are there any specific market keywords associated with the report?
Yes, the market keyword associated with the report is "Metal Caps," which aids in identifying and referencing the specific market segment covered.
12. How do I determine which pricing option suits my needs best?
The pricing options vary based on user requirements and access needs. Individual users may opt for single-user licenses, while businesses requiring broader access may choose multi-user or enterprise licenses for cost-effective access to the report.
13. Are there any additional resources or data provided in the Metal Caps report?
While the report offers comprehensive insights, it's advisable to review the specific contents or supplementary materials provided to ascertain if additional resources or data are available.
14. How can I stay updated on further developments or reports in the Metal Caps?
To stay informed about further developments, trends, and reports in the Metal Caps, consider subscribing to industry newsletters, following relevant companies and organizations, or regularly checking reputable industry news sources and publications.
Methodology
Step 1 - Identification of Relevant Samples Size from Population Database


Step 2 - Approaches for Defining Global Market Size (Value, Volume* & Price*)

Note*: In applicable scenarios
Step 3 - Data Sources
Primary Research
- Web Analytics
- Survey Reports
- Research Institute
- Latest Research Reports
- Opinion Leaders
Secondary Research
- Annual Reports
- White Paper
- Latest Press Release
- Industry Association
- Paid Database
- Investor Presentations

Step 4 - Data Triangulation
Involves using different sources of information in order to increase the validity of a study
These sources are likely to be stakeholders in a program - participants, other researchers, program staff, other community members, and so on.
Then we put all data in single framework & apply various statistical tools to find out the dynamic on the market.
During the analysis stage, feedback from the stakeholder groups would be compared to determine areas of agreement as well as areas of divergence