

Key Insights
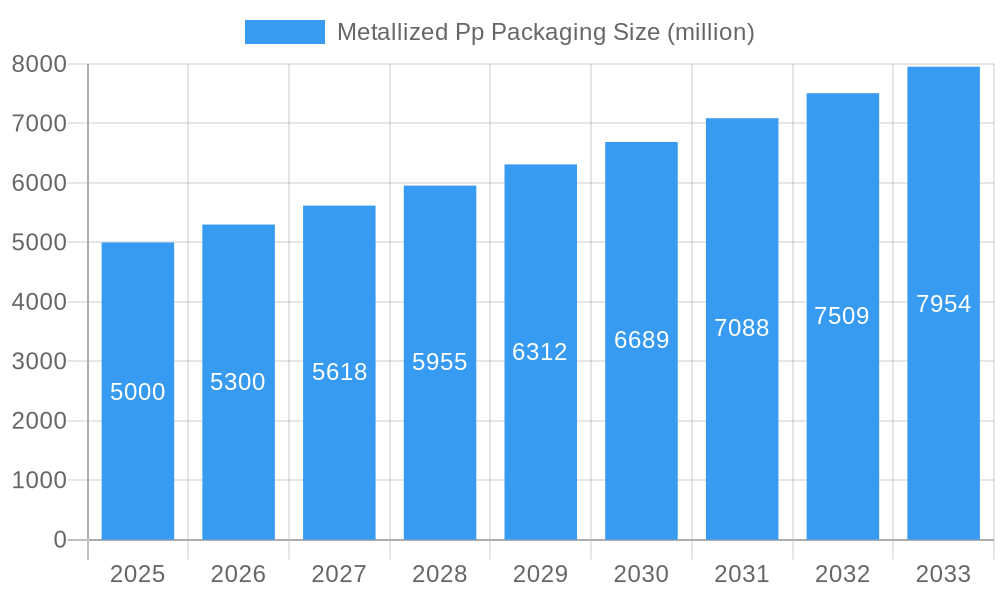
The global metallized PP packaging market is experiencing robust growth, driven by increasing demand for flexible packaging solutions across various industries. The market's expansion is fueled by several key factors, including the rising popularity of convenience foods, the growing e-commerce sector requiring efficient and protective packaging, and a heightened consumer preference for aesthetically appealing and tamper-evident packaging. Metallized PP films offer a superior barrier against moisture, oxygen, and light, thus extending the shelf life of packaged products and maintaining their quality. This is particularly crucial for food and pharmaceutical products, driving significant adoption. Furthermore, the lightweight nature of metallized PP packaging contributes to reduced transportation costs and environmental benefits, aligning with sustainable packaging trends. While the market faces challenges such as fluctuating raw material prices and concerns about plastic waste, ongoing innovations in recyclable and biodegradable metallized PP materials are mitigating these concerns. We estimate the market size to be approximately $5 billion in 2025, growing at a Compound Annual Growth Rate (CAGR) of 6% over the forecast period (2025-2033). This growth is anticipated across key segments, including food & beverage, pharmaceuticals, and consumer goods, with regional variations driven by economic development and consumer preferences.
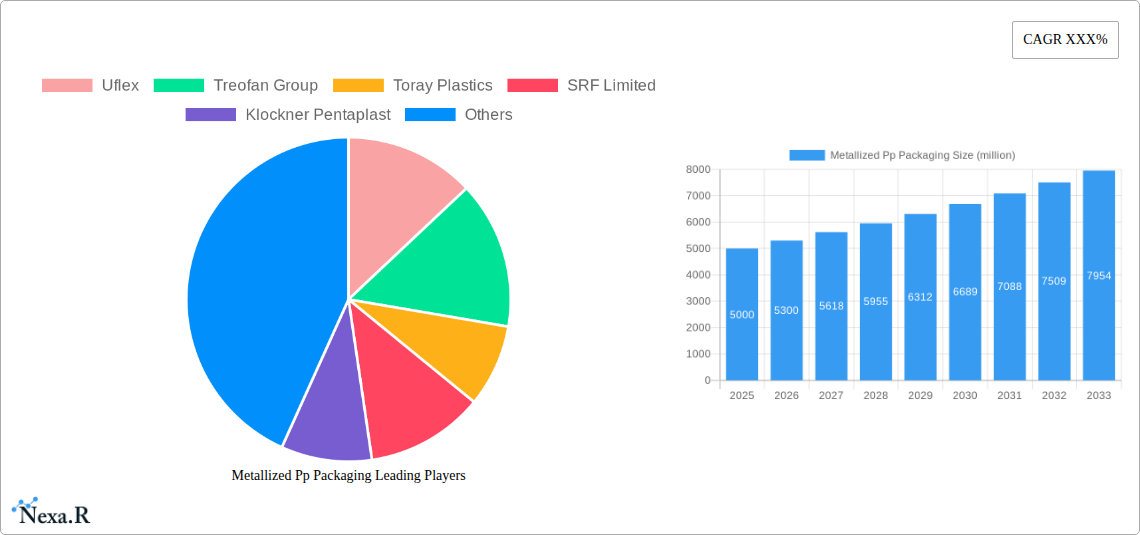
Metallized Pp Packaging Market Size (In Billion)
Major players like Uflex, Treofan Group, Toray Plastics, and SRF Limited are strategically investing in advanced production technologies and expanding their product portfolios to capitalize on this growth. The competitive landscape is characterized by both established players and emerging companies focusing on offering customized solutions and value-added services. The market is segmented based on packaging type (pouches, films, labels), application (food, pharmaceuticals, cosmetics), and region (North America, Europe, Asia-Pacific, etc.). Future growth will likely be influenced by stricter environmental regulations, increasing focus on sustainable packaging materials, and technological advancements in metallization techniques to improve barrier properties and reduce material usage. Continued innovation in sustainable packaging solutions and the increasing demand for high-barrier flexible packaging will remain crucial market drivers throughout the forecast period.
Metallized Pp Packaging Company Market Share
Metallized PP Packaging Market Report: 2019-2033
This comprehensive report provides a detailed analysis of the Metallized PP Packaging market, encompassing market dynamics, growth trends, regional dominance, product landscape, key players, and future outlook. The study period spans 2019-2033, with 2025 serving as the base and estimated year. The forecast period covers 2025-2033, and the historical period analyzed is 2019-2024. This report is invaluable for industry professionals, investors, and anyone seeking a deep understanding of this dynamic market segment. The report projects a market size of xx million units by 2033, showcasing significant growth potential within the broader flexible packaging market.
Metallized PP Packaging Market Dynamics & Structure
The metallized PP packaging market is characterized by moderate concentration, with key players holding significant market share. Technological innovation, driven by demand for enhanced barrier properties and sustainable solutions, is a primary growth driver. Stringent regulatory frameworks concerning food safety and recyclability influence product development and manufacturing processes. Competitive substitutes, such as aluminum foil and other barrier films, present ongoing challenges. The end-user demographics are diverse, spanning food & beverage, pharmaceuticals, cosmetics, and industrial goods. M&A activity has been moderate, with a focus on consolidation and expansion into new geographical markets. Over the historical period (2019-2024), approximately xx M&A deals were recorded, resulting in a xx% increase in market concentration.
- Market Concentration: Moderately concentrated, with top 5 players holding xx% market share in 2024.
- Technological Innovation: Focus on improved barrier properties, recyclability, and sustainable materials.
- Regulatory Framework: Stringent food safety and environmental regulations driving innovation.
- Competitive Substitutes: Aluminum foil, other barrier films, pose a competitive threat.
- End-User Demographics: Diverse, encompassing food & beverage (xx million units), pharmaceuticals (xx million units), cosmetics (xx million units), and industrial goods (xx million units).
- M&A Trends: Moderate consolidation, strategic acquisitions to expand geographical reach and product portfolio.
Metallized PP Packaging Growth Trends & Insights
The Metallized PP Packaging market exhibits robust growth, driven by increasing demand for high-barrier packaging solutions across diverse industries. The market size witnessed a CAGR of xx% during the historical period (2019-2024), reaching xx million units in 2024. This growth is attributed to factors such as rising consumer preference for extended shelf life products, growing e-commerce, and increasing adoption of advanced packaging technologies. Technological disruptions, such as the emergence of biodegradable and compostable metallized films, are reshaping the market landscape. Consumer behavior shifts towards sustainable and eco-friendly packaging options further accelerate market growth. The market penetration rate for metallized PP packaging in key end-use segments is expected to reach xx% by 2033, demonstrating significant future growth potential. The report projects a CAGR of xx% for the forecast period (2025-2033), reaching xx million units by 2033. This growth is largely fuelled by the increasing demand for flexible packaging solutions in emerging economies.
Dominant Regions, Countries, or Segments in Metallized PP Packaging
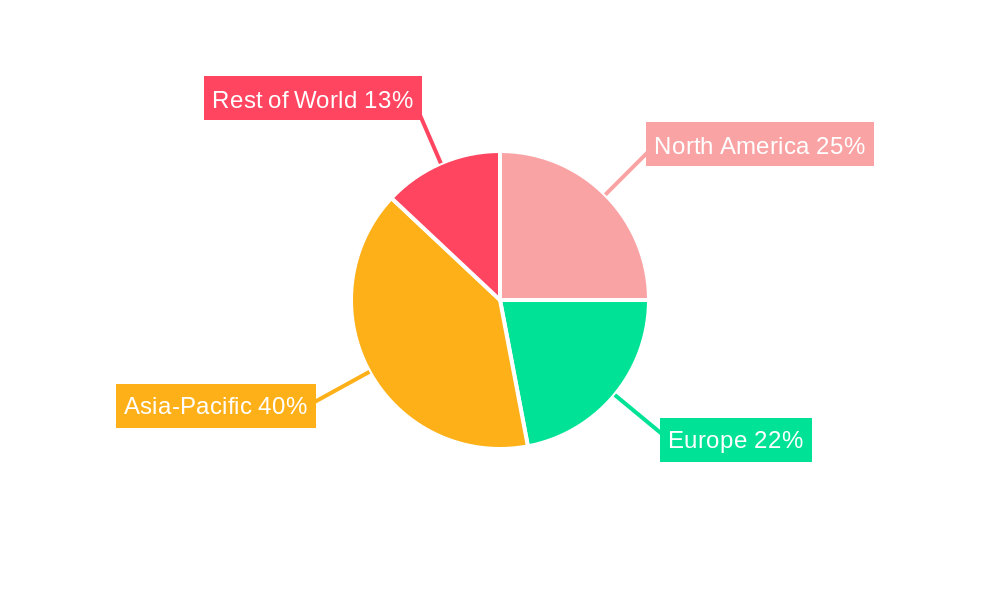
The Asia-Pacific region dominates the global Metallized PP packaging market, driven by rapid economic growth, expanding consumer base, and increasing manufacturing activities. China and India are key contributors to this regional dominance, fueled by robust infrastructure development and favorable government policies. Europe and North America also hold significant market share, propelled by stringent regulatory frameworks promoting sustainable packaging and technological advancements. The food & beverage segment holds the largest market share, followed by pharmaceuticals and cosmetics.
- Key Drivers in Asia-Pacific: Rapid economic growth, expanding middle class, rising disposable income.
- Key Drivers in Europe: Stringent environmental regulations, focus on sustainable packaging solutions.
- Key Drivers in North America: High demand for convenient and high-barrier packaging.
- Dominant Segment: Food & Beverage (xx million units), driven by demand for extended shelf life and enhanced product protection.
Metallized PP Packaging Product Landscape
Metallized PP packaging offers a diverse range of products tailored to specific application needs. Innovations focus on improving barrier properties, enhancing printability, and optimizing recyclability. Key advancements include the development of high-barrier metallized films with enhanced oxygen and moisture resistance, improving product shelf life. The use of sustainable materials and compostable options is gaining traction, aligning with growing environmental concerns. Unique selling propositions center around superior barrier performance, aesthetic appeal, and cost-effectiveness compared to traditional packaging materials.
Key Drivers, Barriers & Challenges in Metallized Pp Packaging
Key Drivers:
- Rising demand for extended shelf life products: Consumers seek longer-lasting products, increasing demand for high-barrier packaging.
- Growth of e-commerce: Increased online shopping requires robust and tamper-evident packaging.
- Technological advancements: Innovations in metallization techniques and material science enhance product performance.
Key Challenges:
- Fluctuating raw material prices: Volatility in polypropylene and metal prices impacts profitability.
- Stringent environmental regulations: Compliance with sustainability standards adds complexity and cost.
- Competition from alternative packaging solutions: Other barrier materials pose a competitive threat. The industry faces approximately xx million units of lost sales annually due to competition.
Emerging Opportunities in Metallized Pp Packaging
- Sustainable and eco-friendly packaging: Growing demand for biodegradable and compostable options.
- Active and intelligent packaging: Integration of sensors and indicators to monitor product freshness and quality.
- Expansion into emerging markets: Untapped potential in developing economies with rising consumption.
Growth Accelerators in the Metallized Pp Packaging Industry
Technological breakthroughs in metallization techniques, material science, and printing technologies are key catalysts for long-term growth. Strategic partnerships and collaborations between packaging manufacturers and brand owners foster innovation and market expansion. The development of specialized coatings and surface treatments further enhances the functional and aesthetic properties of metallized PP films. This drive towards sustainability and recyclability, coupled with the increasing adoption of automated packaging lines, is expected to drive market growth.
Key Players Shaping the Metallized Pp Packaging Market
Notable Milestones in Metallized PP Packaging Sector
- 2020: Launch of a new biodegradable metallized PP film by Cosmo Films.
- 2021: Acquisition of a smaller metallized film producer by Uflex, expanding market share.
- 2022: Introduction of recyclable metallized PP packaging by Treofan Group, setting a new industry standard.
- 2023: Several industry leaders partnered to create a new standard for compostable metallized packaging.
In-Depth Metallized PP Packaging Market Outlook
The Metallized PP Packaging market is poised for significant growth driven by continued innovation in materials and technologies, coupled with increasing demand for sustainable and high-performance packaging solutions. The focus on recyclability and biodegradability will shape the future landscape. Strategic alliances, collaborations, and investments in research and development will further propel the market's expansion. The report forecasts substantial growth opportunities across various regions and end-use segments, presenting lucrative prospects for market participants. This growth trajectory is expected to continue, driven by a combination of factors. The adoption of advanced technologies, such as barrier-enhancing additives and sustainable materials, will shape the future direction of the industry.
Metallized Pp Packaging Segmentation
-
1. Application
- 1.1. Packaging Industry
- 1.2. Printing Industry
- 1.3. Decoration Industry
- 1.4. Yarn & Fiber Industry
- 1.5. Electrics Industry
- 1.6. Others
-
2. Type
- 2.1. Silver Metallized PET Films
- 2.2. Aluminium Metallized PET Films
- 2.3. Others
Metallized Pp Packaging Segmentation By Geography
-
1. North America
- 1.1. United States
- 1.2. Canada
- 1.3. Mexico
-
2. South America
- 2.1. Brazil
- 2.2. Argentina
- 2.3. Rest of South America
-
3. Europe
- 3.1. United Kingdom
- 3.2. Germany
- 3.3. France
- 3.4. Italy
- 3.5. Spain
- 3.6. Russia
- 3.7. Benelux
- 3.8. Nordics
- 3.9. Rest of Europe
-
4. Middle East & Africa
- 4.1. Turkey
- 4.2. Israel
- 4.3. GCC
- 4.4. North Africa
- 4.5. South Africa
- 4.6. Rest of Middle East & Africa
-
5. Asia Pacific
- 5.1. China
- 5.2. India
- 5.3. Japan
- 5.4. South Korea
- 5.5. ASEAN
- 5.6. Oceania
- 5.7. Rest of Asia Pacific
Metallized Pp Packaging Regional Market Share
Geographic Coverage of Metallized Pp Packaging
Metallized Pp Packaging REPORT HIGHLIGHTS
| Aspects | Details |
|---|---|
| Study Period | 2020-2034 |
| Base Year | 2025 |
| Estimated Year | 2026 |
| Forecast Period | 2026-2034 |
| Historical Period | 2020-2025 |
| Growth Rate | CAGR of XXX% from 2020-2034 |
| Segmentation |
|
Table of Contents
- 1. Introduction
- 1.1. Research Scope
- 1.2. Market Segmentation
- 1.3. Research Methodology
- 1.4. Definitions and Assumptions
- 2. Executive Summary
- 2.1. Introduction
- 3. Market Dynamics
- 3.1. Introduction
- 3.2. Market Drivers
- 3.3. Market Restrains
- 3.4. Market Trends
- 4. Market Factor Analysis
- 4.1. Porters Five Forces
- 4.2. Supply/Value Chain
- 4.3. PESTEL analysis
- 4.4. Market Entropy
- 4.5. Patent/Trademark Analysis
- 5. Global Metallized Pp Packaging Analysis, Insights and Forecast, 2020-2032
- 5.1. Market Analysis, Insights and Forecast - by Application
- 5.1.1. Packaging Industry
- 5.1.2. Printing Industry
- 5.1.3. Decoration Industry
- 5.1.4. Yarn & Fiber Industry
- 5.1.5. Electrics Industry
- 5.1.6. Others
- 5.2. Market Analysis, Insights and Forecast - by Type
- 5.2.1. Silver Metallized PET Films
- 5.2.2. Aluminium Metallized PET Films
- 5.2.3. Others
- 5.3. Market Analysis, Insights and Forecast - by Region
- 5.3.1. North America
- 5.3.2. South America
- 5.3.3. Europe
- 5.3.4. Middle East & Africa
- 5.3.5. Asia Pacific
- 5.1. Market Analysis, Insights and Forecast - by Application
- 6. North America Metallized Pp Packaging Analysis, Insights and Forecast, 2020-2032
- 6.1. Market Analysis, Insights and Forecast - by Application
- 6.1.1. Packaging Industry
- 6.1.2. Printing Industry
- 6.1.3. Decoration Industry
- 6.1.4. Yarn & Fiber Industry
- 6.1.5. Electrics Industry
- 6.1.6. Others
- 6.2. Market Analysis, Insights and Forecast - by Type
- 6.2.1. Silver Metallized PET Films
- 6.2.2. Aluminium Metallized PET Films
- 6.2.3. Others
- 6.1. Market Analysis, Insights and Forecast - by Application
- 7. South America Metallized Pp Packaging Analysis, Insights and Forecast, 2020-2032
- 7.1. Market Analysis, Insights and Forecast - by Application
- 7.1.1. Packaging Industry
- 7.1.2. Printing Industry
- 7.1.3. Decoration Industry
- 7.1.4. Yarn & Fiber Industry
- 7.1.5. Electrics Industry
- 7.1.6. Others
- 7.2. Market Analysis, Insights and Forecast - by Type
- 7.2.1. Silver Metallized PET Films
- 7.2.2. Aluminium Metallized PET Films
- 7.2.3. Others
- 7.1. Market Analysis, Insights and Forecast - by Application
- 8. Europe Metallized Pp Packaging Analysis, Insights and Forecast, 2020-2032
- 8.1. Market Analysis, Insights and Forecast - by Application
- 8.1.1. Packaging Industry
- 8.1.2. Printing Industry
- 8.1.3. Decoration Industry
- 8.1.4. Yarn & Fiber Industry
- 8.1.5. Electrics Industry
- 8.1.6. Others
- 8.2. Market Analysis, Insights and Forecast - by Type
- 8.2.1. Silver Metallized PET Films
- 8.2.2. Aluminium Metallized PET Films
- 8.2.3. Others
- 8.1. Market Analysis, Insights and Forecast - by Application
- 9. Middle East & Africa Metallized Pp Packaging Analysis, Insights and Forecast, 2020-2032
- 9.1. Market Analysis, Insights and Forecast - by Application
- 9.1.1. Packaging Industry
- 9.1.2. Printing Industry
- 9.1.3. Decoration Industry
- 9.1.4. Yarn & Fiber Industry
- 9.1.5. Electrics Industry
- 9.1.6. Others
- 9.2. Market Analysis, Insights and Forecast - by Type
- 9.2.1. Silver Metallized PET Films
- 9.2.2. Aluminium Metallized PET Films
- 9.2.3. Others
- 9.1. Market Analysis, Insights and Forecast - by Application
- 10. Asia Pacific Metallized Pp Packaging Analysis, Insights and Forecast, 2020-2032
- 10.1. Market Analysis, Insights and Forecast - by Application
- 10.1.1. Packaging Industry
- 10.1.2. Printing Industry
- 10.1.3. Decoration Industry
- 10.1.4. Yarn & Fiber Industry
- 10.1.5. Electrics Industry
- 10.1.6. Others
- 10.2. Market Analysis, Insights and Forecast - by Type
- 10.2.1. Silver Metallized PET Films
- 10.2.2. Aluminium Metallized PET Films
- 10.2.3. Others
- 10.1. Market Analysis, Insights and Forecast - by Application
- 11. Competitive Analysis
- 11.1. Global Market Share Analysis 2025
- 11.2. Company Profiles
- 11.2.1 Uflex
- 11.2.1.1. Overview
- 11.2.1.2. Products
- 11.2.1.3. SWOT Analysis
- 11.2.1.4. Recent Developments
- 11.2.1.5. Financials (Based on Availability)
- 11.2.2 Treofan Group
- 11.2.2.1. Overview
- 11.2.2.2. Products
- 11.2.2.3. SWOT Analysis
- 11.2.2.4. Recent Developments
- 11.2.2.5. Financials (Based on Availability)
- 11.2.3 Toray Plastics
- 11.2.3.1. Overview
- 11.2.3.2. Products
- 11.2.3.3. SWOT Analysis
- 11.2.3.4. Recent Developments
- 11.2.3.5. Financials (Based on Availability)
- 11.2.4 SRF Limited
- 11.2.4.1. Overview
- 11.2.4.2. Products
- 11.2.4.3. SWOT Analysis
- 11.2.4.4. Recent Developments
- 11.2.4.5. Financials (Based on Availability)
- 11.2.5 Klockner Pentaplast
- 11.2.5.1. Overview
- 11.2.5.2. Products
- 11.2.5.3. SWOT Analysis
- 11.2.5.4. Recent Developments
- 11.2.5.5. Financials (Based on Availability)
- 11.2.6 Jindal Poly Films Limited
- 11.2.6.1. Overview
- 11.2.6.2. Products
- 11.2.6.3. SWOT Analysis
- 11.2.6.4. Recent Developments
- 11.2.6.5. Financials (Based on Availability)
- 11.2.7 DUNMORE Corporation
- 11.2.7.1. Overview
- 11.2.7.2. Products
- 11.2.7.3. SWOT Analysis
- 11.2.7.4. Recent Developments
- 11.2.7.5. Financials (Based on Availability)
- 11.2.8 Cosmo Films
- 11.2.8.1. Overview
- 11.2.8.2. Products
- 11.2.8.3. SWOT Analysis
- 11.2.8.4. Recent Developments
- 11.2.8.5. Financials (Based on Availability)
- 11.2.9 AR Metallizing
- 11.2.9.1. Overview
- 11.2.9.2. Products
- 11.2.9.3. SWOT Analysis
- 11.2.9.4. Recent Developments
- 11.2.9.5. Financials (Based on Availability)
- 11.2.1 Uflex
List of Figures
- Figure 1: Global Metallized Pp Packaging Revenue Breakdown (million, %) by Region 2025 & 2033
- Figure 2: Global Metallized Pp Packaging Volume Breakdown (K, %) by Region 2025 & 2033
- Figure 3: North America Metallized Pp Packaging Revenue (million), by Application 2025 & 2033
- Figure 4: North America Metallized Pp Packaging Volume (K), by Application 2025 & 2033
- Figure 5: North America Metallized Pp Packaging Revenue Share (%), by Application 2025 & 2033
- Figure 6: North America Metallized Pp Packaging Volume Share (%), by Application 2025 & 2033
- Figure 7: North America Metallized Pp Packaging Revenue (million), by Type 2025 & 2033
- Figure 8: North America Metallized Pp Packaging Volume (K), by Type 2025 & 2033
- Figure 9: North America Metallized Pp Packaging Revenue Share (%), by Type 2025 & 2033
- Figure 10: North America Metallized Pp Packaging Volume Share (%), by Type 2025 & 2033
- Figure 11: North America Metallized Pp Packaging Revenue (million), by Country 2025 & 2033
- Figure 12: North America Metallized Pp Packaging Volume (K), by Country 2025 & 2033
- Figure 13: North America Metallized Pp Packaging Revenue Share (%), by Country 2025 & 2033
- Figure 14: North America Metallized Pp Packaging Volume Share (%), by Country 2025 & 2033
- Figure 15: South America Metallized Pp Packaging Revenue (million), by Application 2025 & 2033
- Figure 16: South America Metallized Pp Packaging Volume (K), by Application 2025 & 2033
- Figure 17: South America Metallized Pp Packaging Revenue Share (%), by Application 2025 & 2033
- Figure 18: South America Metallized Pp Packaging Volume Share (%), by Application 2025 & 2033
- Figure 19: South America Metallized Pp Packaging Revenue (million), by Type 2025 & 2033
- Figure 20: South America Metallized Pp Packaging Volume (K), by Type 2025 & 2033
- Figure 21: South America Metallized Pp Packaging Revenue Share (%), by Type 2025 & 2033
- Figure 22: South America Metallized Pp Packaging Volume Share (%), by Type 2025 & 2033
- Figure 23: South America Metallized Pp Packaging Revenue (million), by Country 2025 & 2033
- Figure 24: South America Metallized Pp Packaging Volume (K), by Country 2025 & 2033
- Figure 25: South America Metallized Pp Packaging Revenue Share (%), by Country 2025 & 2033
- Figure 26: South America Metallized Pp Packaging Volume Share (%), by Country 2025 & 2033
- Figure 27: Europe Metallized Pp Packaging Revenue (million), by Application 2025 & 2033
- Figure 28: Europe Metallized Pp Packaging Volume (K), by Application 2025 & 2033
- Figure 29: Europe Metallized Pp Packaging Revenue Share (%), by Application 2025 & 2033
- Figure 30: Europe Metallized Pp Packaging Volume Share (%), by Application 2025 & 2033
- Figure 31: Europe Metallized Pp Packaging Revenue (million), by Type 2025 & 2033
- Figure 32: Europe Metallized Pp Packaging Volume (K), by Type 2025 & 2033
- Figure 33: Europe Metallized Pp Packaging Revenue Share (%), by Type 2025 & 2033
- Figure 34: Europe Metallized Pp Packaging Volume Share (%), by Type 2025 & 2033
- Figure 35: Europe Metallized Pp Packaging Revenue (million), by Country 2025 & 2033
- Figure 36: Europe Metallized Pp Packaging Volume (K), by Country 2025 & 2033
- Figure 37: Europe Metallized Pp Packaging Revenue Share (%), by Country 2025 & 2033
- Figure 38: Europe Metallized Pp Packaging Volume Share (%), by Country 2025 & 2033
- Figure 39: Middle East & Africa Metallized Pp Packaging Revenue (million), by Application 2025 & 2033
- Figure 40: Middle East & Africa Metallized Pp Packaging Volume (K), by Application 2025 & 2033
- Figure 41: Middle East & Africa Metallized Pp Packaging Revenue Share (%), by Application 2025 & 2033
- Figure 42: Middle East & Africa Metallized Pp Packaging Volume Share (%), by Application 2025 & 2033
- Figure 43: Middle East & Africa Metallized Pp Packaging Revenue (million), by Type 2025 & 2033
- Figure 44: Middle East & Africa Metallized Pp Packaging Volume (K), by Type 2025 & 2033
- Figure 45: Middle East & Africa Metallized Pp Packaging Revenue Share (%), by Type 2025 & 2033
- Figure 46: Middle East & Africa Metallized Pp Packaging Volume Share (%), by Type 2025 & 2033
- Figure 47: Middle East & Africa Metallized Pp Packaging Revenue (million), by Country 2025 & 2033
- Figure 48: Middle East & Africa Metallized Pp Packaging Volume (K), by Country 2025 & 2033
- Figure 49: Middle East & Africa Metallized Pp Packaging Revenue Share (%), by Country 2025 & 2033
- Figure 50: Middle East & Africa Metallized Pp Packaging Volume Share (%), by Country 2025 & 2033
- Figure 51: Asia Pacific Metallized Pp Packaging Revenue (million), by Application 2025 & 2033
- Figure 52: Asia Pacific Metallized Pp Packaging Volume (K), by Application 2025 & 2033
- Figure 53: Asia Pacific Metallized Pp Packaging Revenue Share (%), by Application 2025 & 2033
- Figure 54: Asia Pacific Metallized Pp Packaging Volume Share (%), by Application 2025 & 2033
- Figure 55: Asia Pacific Metallized Pp Packaging Revenue (million), by Type 2025 & 2033
- Figure 56: Asia Pacific Metallized Pp Packaging Volume (K), by Type 2025 & 2033
- Figure 57: Asia Pacific Metallized Pp Packaging Revenue Share (%), by Type 2025 & 2033
- Figure 58: Asia Pacific Metallized Pp Packaging Volume Share (%), by Type 2025 & 2033
- Figure 59: Asia Pacific Metallized Pp Packaging Revenue (million), by Country 2025 & 2033
- Figure 60: Asia Pacific Metallized Pp Packaging Volume (K), by Country 2025 & 2033
- Figure 61: Asia Pacific Metallized Pp Packaging Revenue Share (%), by Country 2025 & 2033
- Figure 62: Asia Pacific Metallized Pp Packaging Volume Share (%), by Country 2025 & 2033
List of Tables
- Table 1: Global Metallized Pp Packaging Revenue million Forecast, by Application 2020 & 2033
- Table 2: Global Metallized Pp Packaging Volume K Forecast, by Application 2020 & 2033
- Table 3: Global Metallized Pp Packaging Revenue million Forecast, by Type 2020 & 2033
- Table 4: Global Metallized Pp Packaging Volume K Forecast, by Type 2020 & 2033
- Table 5: Global Metallized Pp Packaging Revenue million Forecast, by Region 2020 & 2033
- Table 6: Global Metallized Pp Packaging Volume K Forecast, by Region 2020 & 2033
- Table 7: Global Metallized Pp Packaging Revenue million Forecast, by Application 2020 & 2033
- Table 8: Global Metallized Pp Packaging Volume K Forecast, by Application 2020 & 2033
- Table 9: Global Metallized Pp Packaging Revenue million Forecast, by Type 2020 & 2033
- Table 10: Global Metallized Pp Packaging Volume K Forecast, by Type 2020 & 2033
- Table 11: Global Metallized Pp Packaging Revenue million Forecast, by Country 2020 & 2033
- Table 12: Global Metallized Pp Packaging Volume K Forecast, by Country 2020 & 2033
- Table 13: United States Metallized Pp Packaging Revenue (million) Forecast, by Application 2020 & 2033
- Table 14: United States Metallized Pp Packaging Volume (K) Forecast, by Application 2020 & 2033
- Table 15: Canada Metallized Pp Packaging Revenue (million) Forecast, by Application 2020 & 2033
- Table 16: Canada Metallized Pp Packaging Volume (K) Forecast, by Application 2020 & 2033
- Table 17: Mexico Metallized Pp Packaging Revenue (million) Forecast, by Application 2020 & 2033
- Table 18: Mexico Metallized Pp Packaging Volume (K) Forecast, by Application 2020 & 2033
- Table 19: Global Metallized Pp Packaging Revenue million Forecast, by Application 2020 & 2033
- Table 20: Global Metallized Pp Packaging Volume K Forecast, by Application 2020 & 2033
- Table 21: Global Metallized Pp Packaging Revenue million Forecast, by Type 2020 & 2033
- Table 22: Global Metallized Pp Packaging Volume K Forecast, by Type 2020 & 2033
- Table 23: Global Metallized Pp Packaging Revenue million Forecast, by Country 2020 & 2033
- Table 24: Global Metallized Pp Packaging Volume K Forecast, by Country 2020 & 2033
- Table 25: Brazil Metallized Pp Packaging Revenue (million) Forecast, by Application 2020 & 2033
- Table 26: Brazil Metallized Pp Packaging Volume (K) Forecast, by Application 2020 & 2033
- Table 27: Argentina Metallized Pp Packaging Revenue (million) Forecast, by Application 2020 & 2033
- Table 28: Argentina Metallized Pp Packaging Volume (K) Forecast, by Application 2020 & 2033
- Table 29: Rest of South America Metallized Pp Packaging Revenue (million) Forecast, by Application 2020 & 2033
- Table 30: Rest of South America Metallized Pp Packaging Volume (K) Forecast, by Application 2020 & 2033
- Table 31: Global Metallized Pp Packaging Revenue million Forecast, by Application 2020 & 2033
- Table 32: Global Metallized Pp Packaging Volume K Forecast, by Application 2020 & 2033
- Table 33: Global Metallized Pp Packaging Revenue million Forecast, by Type 2020 & 2033
- Table 34: Global Metallized Pp Packaging Volume K Forecast, by Type 2020 & 2033
- Table 35: Global Metallized Pp Packaging Revenue million Forecast, by Country 2020 & 2033
- Table 36: Global Metallized Pp Packaging Volume K Forecast, by Country 2020 & 2033
- Table 37: United Kingdom Metallized Pp Packaging Revenue (million) Forecast, by Application 2020 & 2033
- Table 38: United Kingdom Metallized Pp Packaging Volume (K) Forecast, by Application 2020 & 2033
- Table 39: Germany Metallized Pp Packaging Revenue (million) Forecast, by Application 2020 & 2033
- Table 40: Germany Metallized Pp Packaging Volume (K) Forecast, by Application 2020 & 2033
- Table 41: France Metallized Pp Packaging Revenue (million) Forecast, by Application 2020 & 2033
- Table 42: France Metallized Pp Packaging Volume (K) Forecast, by Application 2020 & 2033
- Table 43: Italy Metallized Pp Packaging Revenue (million) Forecast, by Application 2020 & 2033
- Table 44: Italy Metallized Pp Packaging Volume (K) Forecast, by Application 2020 & 2033
- Table 45: Spain Metallized Pp Packaging Revenue (million) Forecast, by Application 2020 & 2033
- Table 46: Spain Metallized Pp Packaging Volume (K) Forecast, by Application 2020 & 2033
- Table 47: Russia Metallized Pp Packaging Revenue (million) Forecast, by Application 2020 & 2033
- Table 48: Russia Metallized Pp Packaging Volume (K) Forecast, by Application 2020 & 2033
- Table 49: Benelux Metallized Pp Packaging Revenue (million) Forecast, by Application 2020 & 2033
- Table 50: Benelux Metallized Pp Packaging Volume (K) Forecast, by Application 2020 & 2033
- Table 51: Nordics Metallized Pp Packaging Revenue (million) Forecast, by Application 2020 & 2033
- Table 52: Nordics Metallized Pp Packaging Volume (K) Forecast, by Application 2020 & 2033
- Table 53: Rest of Europe Metallized Pp Packaging Revenue (million) Forecast, by Application 2020 & 2033
- Table 54: Rest of Europe Metallized Pp Packaging Volume (K) Forecast, by Application 2020 & 2033
- Table 55: Global Metallized Pp Packaging Revenue million Forecast, by Application 2020 & 2033
- Table 56: Global Metallized Pp Packaging Volume K Forecast, by Application 2020 & 2033
- Table 57: Global Metallized Pp Packaging Revenue million Forecast, by Type 2020 & 2033
- Table 58: Global Metallized Pp Packaging Volume K Forecast, by Type 2020 & 2033
- Table 59: Global Metallized Pp Packaging Revenue million Forecast, by Country 2020 & 2033
- Table 60: Global Metallized Pp Packaging Volume K Forecast, by Country 2020 & 2033
- Table 61: Turkey Metallized Pp Packaging Revenue (million) Forecast, by Application 2020 & 2033
- Table 62: Turkey Metallized Pp Packaging Volume (K) Forecast, by Application 2020 & 2033
- Table 63: Israel Metallized Pp Packaging Revenue (million) Forecast, by Application 2020 & 2033
- Table 64: Israel Metallized Pp Packaging Volume (K) Forecast, by Application 2020 & 2033
- Table 65: GCC Metallized Pp Packaging Revenue (million) Forecast, by Application 2020 & 2033
- Table 66: GCC Metallized Pp Packaging Volume (K) Forecast, by Application 2020 & 2033
- Table 67: North Africa Metallized Pp Packaging Revenue (million) Forecast, by Application 2020 & 2033
- Table 68: North Africa Metallized Pp Packaging Volume (K) Forecast, by Application 2020 & 2033
- Table 69: South Africa Metallized Pp Packaging Revenue (million) Forecast, by Application 2020 & 2033
- Table 70: South Africa Metallized Pp Packaging Volume (K) Forecast, by Application 2020 & 2033
- Table 71: Rest of Middle East & Africa Metallized Pp Packaging Revenue (million) Forecast, by Application 2020 & 2033
- Table 72: Rest of Middle East & Africa Metallized Pp Packaging Volume (K) Forecast, by Application 2020 & 2033
- Table 73: Global Metallized Pp Packaging Revenue million Forecast, by Application 2020 & 2033
- Table 74: Global Metallized Pp Packaging Volume K Forecast, by Application 2020 & 2033
- Table 75: Global Metallized Pp Packaging Revenue million Forecast, by Type 2020 & 2033
- Table 76: Global Metallized Pp Packaging Volume K Forecast, by Type 2020 & 2033
- Table 77: Global Metallized Pp Packaging Revenue million Forecast, by Country 2020 & 2033
- Table 78: Global Metallized Pp Packaging Volume K Forecast, by Country 2020 & 2033
- Table 79: China Metallized Pp Packaging Revenue (million) Forecast, by Application 2020 & 2033
- Table 80: China Metallized Pp Packaging Volume (K) Forecast, by Application 2020 & 2033
- Table 81: India Metallized Pp Packaging Revenue (million) Forecast, by Application 2020 & 2033
- Table 82: India Metallized Pp Packaging Volume (K) Forecast, by Application 2020 & 2033
- Table 83: Japan Metallized Pp Packaging Revenue (million) Forecast, by Application 2020 & 2033
- Table 84: Japan Metallized Pp Packaging Volume (K) Forecast, by Application 2020 & 2033
- Table 85: South Korea Metallized Pp Packaging Revenue (million) Forecast, by Application 2020 & 2033
- Table 86: South Korea Metallized Pp Packaging Volume (K) Forecast, by Application 2020 & 2033
- Table 87: ASEAN Metallized Pp Packaging Revenue (million) Forecast, by Application 2020 & 2033
- Table 88: ASEAN Metallized Pp Packaging Volume (K) Forecast, by Application 2020 & 2033
- Table 89: Oceania Metallized Pp Packaging Revenue (million) Forecast, by Application 2020 & 2033
- Table 90: Oceania Metallized Pp Packaging Volume (K) Forecast, by Application 2020 & 2033
- Table 91: Rest of Asia Pacific Metallized Pp Packaging Revenue (million) Forecast, by Application 2020 & 2033
- Table 92: Rest of Asia Pacific Metallized Pp Packaging Volume (K) Forecast, by Application 2020 & 2033
Frequently Asked Questions
1. What is the projected Compound Annual Growth Rate (CAGR) of the Metallized Pp Packaging?
The projected CAGR is approximately XXX%.
2. Which companies are prominent players in the Metallized Pp Packaging?
Key companies in the market include Uflex, Treofan Group, Toray Plastics, SRF Limited, Klockner Pentaplast, Jindal Poly Films Limited, DUNMORE Corporation, Cosmo Films, AR Metallizing.
3. What are the main segments of the Metallized Pp Packaging?
The market segments include Application, Type.
4. Can you provide details about the market size?
The market size is estimated to be USD XXX million as of 2022.
5. What are some drivers contributing to market growth?
N/A
6. What are the notable trends driving market growth?
N/A
7. Are there any restraints impacting market growth?
N/A
8. Can you provide examples of recent developments in the market?
N/A
9. What pricing options are available for accessing the report?
Pricing options include single-user, multi-user, and enterprise licenses priced at USD 3950.00, USD 5925.00, and USD 7900.00 respectively.
10. Is the market size provided in terms of value or volume?
The market size is provided in terms of value, measured in million and volume, measured in K.
11. Are there any specific market keywords associated with the report?
Yes, the market keyword associated with the report is "Metallized Pp Packaging," which aids in identifying and referencing the specific market segment covered.
12. How do I determine which pricing option suits my needs best?
The pricing options vary based on user requirements and access needs. Individual users may opt for single-user licenses, while businesses requiring broader access may choose multi-user or enterprise licenses for cost-effective access to the report.
13. Are there any additional resources or data provided in the Metallized Pp Packaging report?
While the report offers comprehensive insights, it's advisable to review the specific contents or supplementary materials provided to ascertain if additional resources or data are available.
14. How can I stay updated on further developments or reports in the Metallized Pp Packaging?
To stay informed about further developments, trends, and reports in the Metallized Pp Packaging, consider subscribing to industry newsletters, following relevant companies and organizations, or regularly checking reputable industry news sources and publications.
Methodology
Step 1 - Identification of Relevant Samples Size from Population Database


Step 2 - Approaches for Defining Global Market Size (Value, Volume* & Price*)

Note*: In applicable scenarios
Step 3 - Data Sources
Primary Research
- Web Analytics
- Survey Reports
- Research Institute
- Latest Research Reports
- Opinion Leaders
Secondary Research
- Annual Reports
- White Paper
- Latest Press Release
- Industry Association
- Paid Database
- Investor Presentations

Step 4 - Data Triangulation
Involves using different sources of information in order to increase the validity of a study
These sources are likely to be stakeholders in a program - participants, other researchers, program staff, other community members, and so on.
Then we put all data in single framework & apply various statistical tools to find out the dynamic on the market.
During the analysis stage, feedback from the stakeholder groups would be compared to determine areas of agreement as well as areas of divergence