

Key Insights
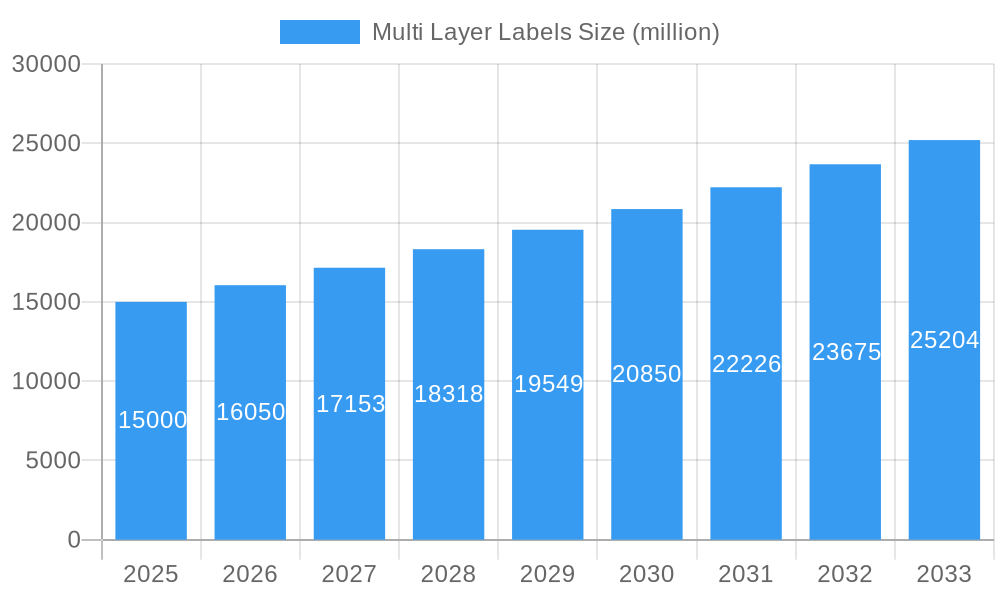
The multi-layer label market is projected for substantial expansion, propelled by escalating demand for advanced packaging solutions across a spectrum of industries. Key growth catalysts include brand owners' increasing reliance on multi-layer labels for enhanced product appeal and functionality, incorporating features like tamper evidence, unique identification, and promotional inserts. The burgeoning e-commerce sector and the imperative for secure, informative product labeling further drive demand. Multi-layer labels are pivotal for integrating essential data such as barcodes, QR codes, and variable information, optimizing supply chain inventory management and traceability. Concurrently, advancements in digital and flexographic printing technologies are improving label quality, design versatility, and cost-effectiveness. The global multi-layer label market size was estimated at $6.48 billion in the base year of 2025 and is forecast to grow at a Compound Annual Growth Rate (CAGR) of 8.85% through 2033, influenced by ongoing technological innovation, rising consumer preference for branded goods, and the continuous growth of global e-commerce.
Multi Layer Labels Market Size (In Billion)
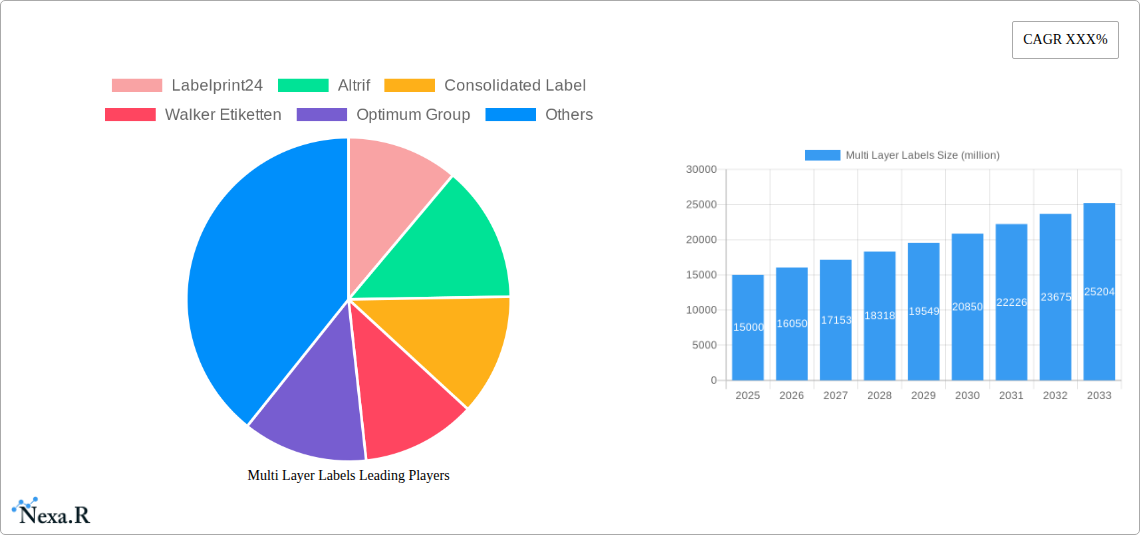
Market segmentation spans label type, printing technology, application, and end-use industry. Leading companies such as Labelprint24, Alrif, and Consolidated Label are key contributors to market dynamism through product development and strategic alliances. Persistent challenges include raw material price volatility and the complexities inherent in multi-layer label manufacturing. Significant regional growth is anticipated in North America and Europe, owing to mature packaging industries and robust consumer expenditure. Emerging economies in the Asia-Pacific region are also poised for substantial contributions, presenting considerable opportunities for manufacturers and suppliers. Sustained innovation in materials, printing processes, and application techniques will be critical for sustained market leadership.
Multi Layer Labels Company Market Share
Multi Layer Labels Market Report: 2019-2033
This comprehensive report provides an in-depth analysis of the multi-layer labels market, offering invaluable insights for industry professionals, investors, and strategic decision-makers. Covering the period 2019-2033, with a base year of 2025 and a forecast period of 2025-2033, this report leverages extensive primary and secondary research to deliver a precise and actionable market overview. The global market is expected to reach xx million units by 2033, exhibiting significant growth potential across various segments and geographic regions.
Multi Layer Labels Market Dynamics & Structure
The multi-layer labels market is characterized by a moderately consolidated structure, with key players like Labelprint24, Altrif, and Consolidated Label holding significant market share. However, the market also features several smaller, specialized players, fostering competition and innovation. Technological advancements, particularly in digital printing and material science, are key drivers of market growth. Stringent regulatory frameworks concerning food safety and environmental sustainability are shaping product development and manufacturing processes. The increasing demand for tamper-evident and secure labels further fuels market expansion. Competitive substitutes, such as single-layer labels and other packaging solutions, pose a challenge, but the unique functionalities and benefits of multi-layer labels ensure sustained demand. Mergers and acquisitions (M&A) activity has been moderate in recent years, with approximately xx deals recorded between 2019 and 2024, primarily focused on expanding product portfolios and geographic reach.
- Market Concentration: Moderately consolidated, with top 5 players holding xx% market share in 2024.
- Technological Innovation: Digital printing, advanced adhesives, and sustainable materials are driving innovation.
- Regulatory Landscape: Stringent food safety and environmental regulations impact product development.
- Competitive Substitutes: Single-layer labels and other packaging solutions pose a moderate competitive threat.
- M&A Activity: Approximately xx M&A deals between 2019 and 2024, focusing on expansion and diversification.
- End-User Demographics: Growth driven by increasing demand across food & beverage, pharmaceuticals, and consumer goods sectors.
Multi Layer Labels Growth Trends & Insights
The multi-layer labels market has witnessed consistent growth over the past five years (2019-2024), expanding at a CAGR of xx%. This growth is attributed to several factors, including the rising demand for product authentication and brand protection, increased consumer awareness of product information, and the growing adoption of sophisticated packaging solutions across various industries. The market penetration of multi-layer labels in key segments like food and beverage is increasing, particularly in developing economies. Technological disruptions, such as the widespread adoption of digital printing technologies, are driving efficiency gains and customization options. Consumer behavior shifts, particularly towards sustainable and environmentally friendly packaging, influence product development and market dynamics. The projected CAGR for 2025-2033 is estimated at xx%, indicating a robust growth trajectory. The market size is predicted to reach xx million units by 2033.
Dominant Regions, Countries, or Segments in Multi Layer Labels
North America currently holds the largest market share in the multi-layer labels sector, driven by strong demand from the food and beverage, pharmaceuticals, and consumer goods industries. This dominance is attributed to factors such as high disposable income, advanced technological infrastructure, and stringent product safety regulations. Europe and Asia-Pacific are also significant markets, exhibiting robust growth potential. Within the segments, the food and beverage sector dominates, owing to its substantial demand for tamper-evident labels and product information labeling.
- North America: High demand, advanced infrastructure, stringent regulations drive market leadership.
- Europe: Strong growth potential fueled by increasing consumer demand for premium packaging solutions.
- Asia-Pacific: Rapidly expanding market, driven by economic growth and rising consumption.
- Food & Beverage: Largest segment driven by demand for tamper-evident labels and product information.
- Pharmaceuticals: Significant growth due to stringent safety and traceability requirements.
Multi Layer Labels Product Landscape
Multi-layer labels offer a wide range of functionalities, including tamper evidence, variable data printing, and enhanced durability. Recent product innovations include the development of sustainable materials, such as recycled paper and biodegradable plastics, to meet growing environmental concerns. Advancements in printing technologies allow for high-quality graphics, complex designs, and improved security features. The unique selling propositions of multi-layer labels lie in their ability to combine multiple functionalities within a single label, offering cost-effectiveness and enhanced product protection.
Key Drivers, Barriers & Challenges in Multi Layer Labels
Key Drivers:
- Increasing demand for product authentication and brand protection.
- Growing adoption of sophisticated packaging solutions across industries.
- Technological advancements in printing and materials science.
- Stringent regulatory compliance requirements in various sectors.
Challenges & Restraints:
- High initial investment costs associated with specialized printing equipment.
- Fluctuations in raw material prices, particularly for specialized adhesives and films.
- Intense competition from substitute products and alternative packaging solutions.
- Stringent environmental regulations imposing limitations on certain materials.
Emerging Opportunities in Multi Layer Labels
The market presents significant opportunities in emerging economies, where demand for branded consumer goods is rapidly increasing. There is considerable potential for innovation in sustainable materials and environmentally friendly production processes. The development of new functionalities, such as integrated RFID tags for product tracking and smart packaging, presents exciting prospects.
Growth Accelerators in the Multi Layer Labels Industry
Technological breakthroughs in digital printing and material science are key catalysts. Strategic partnerships between label manufacturers and brand owners are fostering innovation and driving market expansion. The expansion into new geographic markets, especially in developing regions, offers significant growth potential.
Key Players Shaping the Multi Layer Labels Market
- Labelprint24
- Altrif
- Consolidated Label
- Walker Etiketten
- Optimum Group
- Albeniz
- Faubel
- Froben Druck
- Bizerba
- MPS
- S. Anand Packaging
- Eltronis
- Labelnet
- Etiketa
- MD Labels
Notable Milestones in Multi Layer Labels Sector
- 2020: Introduction of a new biodegradable multi-layer label material by Altrif.
- 2021: Labelprint24 acquired a smaller competitor, expanding its market reach.
- 2022: Consolidated Label launched a new digital printing technology for high-volume production.
- 2023: Increased adoption of sustainable materials across the industry.
In-Depth Multi Layer Labels Market Outlook
The multi-layer labels market is poised for continued growth, driven by technological advancements, increasing demand for enhanced product security, and the growing adoption of sustainable packaging solutions. Strategic partnerships and expansion into new markets will further fuel this growth. The long-term outlook is positive, with significant opportunities for innovation and market expansion.
Multi Layer Labels Segmentation
-
1. Application
- 1.1. Pharmaceutical Industry
- 1.2. Chemical Industry
- 1.3. Food and Beverage
- 1.4. Cosmetic
- 1.5. Others
-
2. Type
- 2.1. Peel and Seal Label
- 2.2. Dry peel label
- 2.3. Backpack label
- 2.4. Booklet label
- 2.5. Others
Multi Layer Labels Segmentation By Geography
-
1. North America
- 1.1. United States
- 1.2. Canada
- 1.3. Mexico
-
2. South America
- 2.1. Brazil
- 2.2. Argentina
- 2.3. Rest of South America
-
3. Europe
- 3.1. United Kingdom
- 3.2. Germany
- 3.3. France
- 3.4. Italy
- 3.5. Spain
- 3.6. Russia
- 3.7. Benelux
- 3.8. Nordics
- 3.9. Rest of Europe
-
4. Middle East & Africa
- 4.1. Turkey
- 4.2. Israel
- 4.3. GCC
- 4.4. North Africa
- 4.5. South Africa
- 4.6. Rest of Middle East & Africa
-
5. Asia Pacific
- 5.1. China
- 5.2. India
- 5.3. Japan
- 5.4. South Korea
- 5.5. ASEAN
- 5.6. Oceania
- 5.7. Rest of Asia Pacific

Multi Layer Labels Regional Market Share
Geographic Coverage of Multi Layer Labels
Multi Layer Labels REPORT HIGHLIGHTS
| Aspects | Details |
|---|---|
| Study Period | 2020-2034 |
| Base Year | 2025 |
| Estimated Year | 2026 |
| Forecast Period | 2026-2034 |
| Historical Period | 2020-2025 |
| Growth Rate | CAGR of 8.85% from 2020-2034 |
| Segmentation |
|
Table of Contents
- 1. Introduction
- 1.1. Research Scope
- 1.2. Market Segmentation
- 1.3. Research Methodology
- 1.4. Definitions and Assumptions
- 2. Executive Summary
- 2.1. Introduction
- 3. Market Dynamics
- 3.1. Introduction
- 3.2. Market Drivers
- 3.3. Market Restrains
- 3.4. Market Trends
- 4. Market Factor Analysis
- 4.1. Porters Five Forces
- 4.2. Supply/Value Chain
- 4.3. PESTEL analysis
- 4.4. Market Entropy
- 4.5. Patent/Trademark Analysis
- 5. Global Multi Layer Labels Analysis, Insights and Forecast, 2020-2032
- 5.1. Market Analysis, Insights and Forecast - by Application
- 5.1.1. Pharmaceutical Industry
- 5.1.2. Chemical Industry
- 5.1.3. Food and Beverage
- 5.1.4. Cosmetic
- 5.1.5. Others
- 5.2. Market Analysis, Insights and Forecast - by Type
- 5.2.1. Peel and Seal Label
- 5.2.2. Dry peel label
- 5.2.3. Backpack label
- 5.2.4. Booklet label
- 5.2.5. Others
- 5.3. Market Analysis, Insights and Forecast - by Region
- 5.3.1. North America
- 5.3.2. South America
- 5.3.3. Europe
- 5.3.4. Middle East & Africa
- 5.3.5. Asia Pacific
- 5.1. Market Analysis, Insights and Forecast - by Application
- 6. North America Multi Layer Labels Analysis, Insights and Forecast, 2020-2032
- 6.1. Market Analysis, Insights and Forecast - by Application
- 6.1.1. Pharmaceutical Industry
- 6.1.2. Chemical Industry
- 6.1.3. Food and Beverage
- 6.1.4. Cosmetic
- 6.1.5. Others
- 6.2. Market Analysis, Insights and Forecast - by Type
- 6.2.1. Peel and Seal Label
- 6.2.2. Dry peel label
- 6.2.3. Backpack label
- 6.2.4. Booklet label
- 6.2.5. Others
- 6.1. Market Analysis, Insights and Forecast - by Application
- 7. South America Multi Layer Labels Analysis, Insights and Forecast, 2020-2032
- 7.1. Market Analysis, Insights and Forecast - by Application
- 7.1.1. Pharmaceutical Industry
- 7.1.2. Chemical Industry
- 7.1.3. Food and Beverage
- 7.1.4. Cosmetic
- 7.1.5. Others
- 7.2. Market Analysis, Insights and Forecast - by Type
- 7.2.1. Peel and Seal Label
- 7.2.2. Dry peel label
- 7.2.3. Backpack label
- 7.2.4. Booklet label
- 7.2.5. Others
- 7.1. Market Analysis, Insights and Forecast - by Application
- 8. Europe Multi Layer Labels Analysis, Insights and Forecast, 2020-2032
- 8.1. Market Analysis, Insights and Forecast - by Application
- 8.1.1. Pharmaceutical Industry
- 8.1.2. Chemical Industry
- 8.1.3. Food and Beverage
- 8.1.4. Cosmetic
- 8.1.5. Others
- 8.2. Market Analysis, Insights and Forecast - by Type
- 8.2.1. Peel and Seal Label
- 8.2.2. Dry peel label
- 8.2.3. Backpack label
- 8.2.4. Booklet label
- 8.2.5. Others
- 8.1. Market Analysis, Insights and Forecast - by Application
- 9. Middle East & Africa Multi Layer Labels Analysis, Insights and Forecast, 2020-2032
- 9.1. Market Analysis, Insights and Forecast - by Application
- 9.1.1. Pharmaceutical Industry
- 9.1.2. Chemical Industry
- 9.1.3. Food and Beverage
- 9.1.4. Cosmetic
- 9.1.5. Others
- 9.2. Market Analysis, Insights and Forecast - by Type
- 9.2.1. Peel and Seal Label
- 9.2.2. Dry peel label
- 9.2.3. Backpack label
- 9.2.4. Booklet label
- 9.2.5. Others
- 9.1. Market Analysis, Insights and Forecast - by Application
- 10. Asia Pacific Multi Layer Labels Analysis, Insights and Forecast, 2020-2032
- 10.1. Market Analysis, Insights and Forecast - by Application
- 10.1.1. Pharmaceutical Industry
- 10.1.2. Chemical Industry
- 10.1.3. Food and Beverage
- 10.1.4. Cosmetic
- 10.1.5. Others
- 10.2. Market Analysis, Insights and Forecast - by Type
- 10.2.1. Peel and Seal Label
- 10.2.2. Dry peel label
- 10.2.3. Backpack label
- 10.2.4. Booklet label
- 10.2.5. Others
- 10.1. Market Analysis, Insights and Forecast - by Application
- 11. Competitive Analysis
- 11.1. Global Market Share Analysis 2025
- 11.2. Company Profiles
- 11.2.1 Labelprint24
- 11.2.1.1. Overview
- 11.2.1.2. Products
- 11.2.1.3. SWOT Analysis
- 11.2.1.4. Recent Developments
- 11.2.1.5. Financials (Based on Availability)
- 11.2.2 Altrif
- 11.2.2.1. Overview
- 11.2.2.2. Products
- 11.2.2.3. SWOT Analysis
- 11.2.2.4. Recent Developments
- 11.2.2.5. Financials (Based on Availability)
- 11.2.3 Consolidated Label
- 11.2.3.1. Overview
- 11.2.3.2. Products
- 11.2.3.3. SWOT Analysis
- 11.2.3.4. Recent Developments
- 11.2.3.5. Financials (Based on Availability)
- 11.2.4 Walker Etiketten
- 11.2.4.1. Overview
- 11.2.4.2. Products
- 11.2.4.3. SWOT Analysis
- 11.2.4.4. Recent Developments
- 11.2.4.5. Financials (Based on Availability)
- 11.2.5 Optimum Group
- 11.2.5.1. Overview
- 11.2.5.2. Products
- 11.2.5.3. SWOT Analysis
- 11.2.5.4. Recent Developments
- 11.2.5.5. Financials (Based on Availability)
- 11.2.6 Albeniz
- 11.2.6.1. Overview
- 11.2.6.2. Products
- 11.2.6.3. SWOT Analysis
- 11.2.6.4. Recent Developments
- 11.2.6.5. Financials (Based on Availability)
- 11.2.7 Faubel
- 11.2.7.1. Overview
- 11.2.7.2. Products
- 11.2.7.3. SWOT Analysis
- 11.2.7.4. Recent Developments
- 11.2.7.5. Financials (Based on Availability)
- 11.2.8 Froben Druck
- 11.2.8.1. Overview
- 11.2.8.2. Products
- 11.2.8.3. SWOT Analysis
- 11.2.8.4. Recent Developments
- 11.2.8.5. Financials (Based on Availability)
- 11.2.9 Bizerba
- 11.2.9.1. Overview
- 11.2.9.2. Products
- 11.2.9.3. SWOT Analysis
- 11.2.9.4. Recent Developments
- 11.2.9.5. Financials (Based on Availability)
- 11.2.10 MPS
- 11.2.10.1. Overview
- 11.2.10.2. Products
- 11.2.10.3. SWOT Analysis
- 11.2.10.4. Recent Developments
- 11.2.10.5. Financials (Based on Availability)
- 11.2.11 S. Anand Packaging
- 11.2.11.1. Overview
- 11.2.11.2. Products
- 11.2.11.3. SWOT Analysis
- 11.2.11.4. Recent Developments
- 11.2.11.5. Financials (Based on Availability)
- 11.2.12 Eltronis
- 11.2.12.1. Overview
- 11.2.12.2. Products
- 11.2.12.3. SWOT Analysis
- 11.2.12.4. Recent Developments
- 11.2.12.5. Financials (Based on Availability)
- 11.2.13 Labelnet
- 11.2.13.1. Overview
- 11.2.13.2. Products
- 11.2.13.3. SWOT Analysis
- 11.2.13.4. Recent Developments
- 11.2.13.5. Financials (Based on Availability)
- 11.2.14 Etiketa
- 11.2.14.1. Overview
- 11.2.14.2. Products
- 11.2.14.3. SWOT Analysis
- 11.2.14.4. Recent Developments
- 11.2.14.5. Financials (Based on Availability)
- 11.2.15 MD Labels
- 11.2.15.1. Overview
- 11.2.15.2. Products
- 11.2.15.3. SWOT Analysis
- 11.2.15.4. Recent Developments
- 11.2.15.5. Financials (Based on Availability)
- 11.2.1 Labelprint24
List of Figures
- Figure 1: Global Multi Layer Labels Revenue Breakdown (billion, %) by Region 2025 & 2033
- Figure 2: Global Multi Layer Labels Volume Breakdown (K, %) by Region 2025 & 2033
- Figure 3: North America Multi Layer Labels Revenue (billion), by Application 2025 & 2033
- Figure 4: North America Multi Layer Labels Volume (K), by Application 2025 & 2033
- Figure 5: North America Multi Layer Labels Revenue Share (%), by Application 2025 & 2033
- Figure 6: North America Multi Layer Labels Volume Share (%), by Application 2025 & 2033
- Figure 7: North America Multi Layer Labels Revenue (billion), by Type 2025 & 2033
- Figure 8: North America Multi Layer Labels Volume (K), by Type 2025 & 2033
- Figure 9: North America Multi Layer Labels Revenue Share (%), by Type 2025 & 2033
- Figure 10: North America Multi Layer Labels Volume Share (%), by Type 2025 & 2033
- Figure 11: North America Multi Layer Labels Revenue (billion), by Country 2025 & 2033
- Figure 12: North America Multi Layer Labels Volume (K), by Country 2025 & 2033
- Figure 13: North America Multi Layer Labels Revenue Share (%), by Country 2025 & 2033
- Figure 14: North America Multi Layer Labels Volume Share (%), by Country 2025 & 2033
- Figure 15: South America Multi Layer Labels Revenue (billion), by Application 2025 & 2033
- Figure 16: South America Multi Layer Labels Volume (K), by Application 2025 & 2033
- Figure 17: South America Multi Layer Labels Revenue Share (%), by Application 2025 & 2033
- Figure 18: South America Multi Layer Labels Volume Share (%), by Application 2025 & 2033
- Figure 19: South America Multi Layer Labels Revenue (billion), by Type 2025 & 2033
- Figure 20: South America Multi Layer Labels Volume (K), by Type 2025 & 2033
- Figure 21: South America Multi Layer Labels Revenue Share (%), by Type 2025 & 2033
- Figure 22: South America Multi Layer Labels Volume Share (%), by Type 2025 & 2033
- Figure 23: South America Multi Layer Labels Revenue (billion), by Country 2025 & 2033
- Figure 24: South America Multi Layer Labels Volume (K), by Country 2025 & 2033
- Figure 25: South America Multi Layer Labels Revenue Share (%), by Country 2025 & 2033
- Figure 26: South America Multi Layer Labels Volume Share (%), by Country 2025 & 2033
- Figure 27: Europe Multi Layer Labels Revenue (billion), by Application 2025 & 2033
- Figure 28: Europe Multi Layer Labels Volume (K), by Application 2025 & 2033
- Figure 29: Europe Multi Layer Labels Revenue Share (%), by Application 2025 & 2033
- Figure 30: Europe Multi Layer Labels Volume Share (%), by Application 2025 & 2033
- Figure 31: Europe Multi Layer Labels Revenue (billion), by Type 2025 & 2033
- Figure 32: Europe Multi Layer Labels Volume (K), by Type 2025 & 2033
- Figure 33: Europe Multi Layer Labels Revenue Share (%), by Type 2025 & 2033
- Figure 34: Europe Multi Layer Labels Volume Share (%), by Type 2025 & 2033
- Figure 35: Europe Multi Layer Labels Revenue (billion), by Country 2025 & 2033
- Figure 36: Europe Multi Layer Labels Volume (K), by Country 2025 & 2033
- Figure 37: Europe Multi Layer Labels Revenue Share (%), by Country 2025 & 2033
- Figure 38: Europe Multi Layer Labels Volume Share (%), by Country 2025 & 2033
- Figure 39: Middle East & Africa Multi Layer Labels Revenue (billion), by Application 2025 & 2033
- Figure 40: Middle East & Africa Multi Layer Labels Volume (K), by Application 2025 & 2033
- Figure 41: Middle East & Africa Multi Layer Labels Revenue Share (%), by Application 2025 & 2033
- Figure 42: Middle East & Africa Multi Layer Labels Volume Share (%), by Application 2025 & 2033
- Figure 43: Middle East & Africa Multi Layer Labels Revenue (billion), by Type 2025 & 2033
- Figure 44: Middle East & Africa Multi Layer Labels Volume (K), by Type 2025 & 2033
- Figure 45: Middle East & Africa Multi Layer Labels Revenue Share (%), by Type 2025 & 2033
- Figure 46: Middle East & Africa Multi Layer Labels Volume Share (%), by Type 2025 & 2033
- Figure 47: Middle East & Africa Multi Layer Labels Revenue (billion), by Country 2025 & 2033
- Figure 48: Middle East & Africa Multi Layer Labels Volume (K), by Country 2025 & 2033
- Figure 49: Middle East & Africa Multi Layer Labels Revenue Share (%), by Country 2025 & 2033
- Figure 50: Middle East & Africa Multi Layer Labels Volume Share (%), by Country 2025 & 2033
- Figure 51: Asia Pacific Multi Layer Labels Revenue (billion), by Application 2025 & 2033
- Figure 52: Asia Pacific Multi Layer Labels Volume (K), by Application 2025 & 2033
- Figure 53: Asia Pacific Multi Layer Labels Revenue Share (%), by Application 2025 & 2033
- Figure 54: Asia Pacific Multi Layer Labels Volume Share (%), by Application 2025 & 2033
- Figure 55: Asia Pacific Multi Layer Labels Revenue (billion), by Type 2025 & 2033
- Figure 56: Asia Pacific Multi Layer Labels Volume (K), by Type 2025 & 2033
- Figure 57: Asia Pacific Multi Layer Labels Revenue Share (%), by Type 2025 & 2033
- Figure 58: Asia Pacific Multi Layer Labels Volume Share (%), by Type 2025 & 2033
- Figure 59: Asia Pacific Multi Layer Labels Revenue (billion), by Country 2025 & 2033
- Figure 60: Asia Pacific Multi Layer Labels Volume (K), by Country 2025 & 2033
- Figure 61: Asia Pacific Multi Layer Labels Revenue Share (%), by Country 2025 & 2033
- Figure 62: Asia Pacific Multi Layer Labels Volume Share (%), by Country 2025 & 2033
List of Tables
- Table 1: Global Multi Layer Labels Revenue billion Forecast, by Application 2020 & 2033
- Table 2: Global Multi Layer Labels Volume K Forecast, by Application 2020 & 2033
- Table 3: Global Multi Layer Labels Revenue billion Forecast, by Type 2020 & 2033
- Table 4: Global Multi Layer Labels Volume K Forecast, by Type 2020 & 2033
- Table 5: Global Multi Layer Labels Revenue billion Forecast, by Region 2020 & 2033
- Table 6: Global Multi Layer Labels Volume K Forecast, by Region 2020 & 2033
- Table 7: Global Multi Layer Labels Revenue billion Forecast, by Application 2020 & 2033
- Table 8: Global Multi Layer Labels Volume K Forecast, by Application 2020 & 2033
- Table 9: Global Multi Layer Labels Revenue billion Forecast, by Type 2020 & 2033
- Table 10: Global Multi Layer Labels Volume K Forecast, by Type 2020 & 2033
- Table 11: Global Multi Layer Labels Revenue billion Forecast, by Country 2020 & 2033
- Table 12: Global Multi Layer Labels Volume K Forecast, by Country 2020 & 2033
- Table 13: United States Multi Layer Labels Revenue (billion) Forecast, by Application 2020 & 2033
- Table 14: United States Multi Layer Labels Volume (K) Forecast, by Application 2020 & 2033
- Table 15: Canada Multi Layer Labels Revenue (billion) Forecast, by Application 2020 & 2033
- Table 16: Canada Multi Layer Labels Volume (K) Forecast, by Application 2020 & 2033
- Table 17: Mexico Multi Layer Labels Revenue (billion) Forecast, by Application 2020 & 2033
- Table 18: Mexico Multi Layer Labels Volume (K) Forecast, by Application 2020 & 2033
- Table 19: Global Multi Layer Labels Revenue billion Forecast, by Application 2020 & 2033
- Table 20: Global Multi Layer Labels Volume K Forecast, by Application 2020 & 2033
- Table 21: Global Multi Layer Labels Revenue billion Forecast, by Type 2020 & 2033
- Table 22: Global Multi Layer Labels Volume K Forecast, by Type 2020 & 2033
- Table 23: Global Multi Layer Labels Revenue billion Forecast, by Country 2020 & 2033
- Table 24: Global Multi Layer Labels Volume K Forecast, by Country 2020 & 2033
- Table 25: Brazil Multi Layer Labels Revenue (billion) Forecast, by Application 2020 & 2033
- Table 26: Brazil Multi Layer Labels Volume (K) Forecast, by Application 2020 & 2033
- Table 27: Argentina Multi Layer Labels Revenue (billion) Forecast, by Application 2020 & 2033
- Table 28: Argentina Multi Layer Labels Volume (K) Forecast, by Application 2020 & 2033
- Table 29: Rest of South America Multi Layer Labels Revenue (billion) Forecast, by Application 2020 & 2033
- Table 30: Rest of South America Multi Layer Labels Volume (K) Forecast, by Application 2020 & 2033
- Table 31: Global Multi Layer Labels Revenue billion Forecast, by Application 2020 & 2033
- Table 32: Global Multi Layer Labels Volume K Forecast, by Application 2020 & 2033
- Table 33: Global Multi Layer Labels Revenue billion Forecast, by Type 2020 & 2033
- Table 34: Global Multi Layer Labels Volume K Forecast, by Type 2020 & 2033
- Table 35: Global Multi Layer Labels Revenue billion Forecast, by Country 2020 & 2033
- Table 36: Global Multi Layer Labels Volume K Forecast, by Country 2020 & 2033
- Table 37: United Kingdom Multi Layer Labels Revenue (billion) Forecast, by Application 2020 & 2033
- Table 38: United Kingdom Multi Layer Labels Volume (K) Forecast, by Application 2020 & 2033
- Table 39: Germany Multi Layer Labels Revenue (billion) Forecast, by Application 2020 & 2033
- Table 40: Germany Multi Layer Labels Volume (K) Forecast, by Application 2020 & 2033
- Table 41: France Multi Layer Labels Revenue (billion) Forecast, by Application 2020 & 2033
- Table 42: France Multi Layer Labels Volume (K) Forecast, by Application 2020 & 2033
- Table 43: Italy Multi Layer Labels Revenue (billion) Forecast, by Application 2020 & 2033
- Table 44: Italy Multi Layer Labels Volume (K) Forecast, by Application 2020 & 2033
- Table 45: Spain Multi Layer Labels Revenue (billion) Forecast, by Application 2020 & 2033
- Table 46: Spain Multi Layer Labels Volume (K) Forecast, by Application 2020 & 2033
- Table 47: Russia Multi Layer Labels Revenue (billion) Forecast, by Application 2020 & 2033
- Table 48: Russia Multi Layer Labels Volume (K) Forecast, by Application 2020 & 2033
- Table 49: Benelux Multi Layer Labels Revenue (billion) Forecast, by Application 2020 & 2033
- Table 50: Benelux Multi Layer Labels Volume (K) Forecast, by Application 2020 & 2033
- Table 51: Nordics Multi Layer Labels Revenue (billion) Forecast, by Application 2020 & 2033
- Table 52: Nordics Multi Layer Labels Volume (K) Forecast, by Application 2020 & 2033
- Table 53: Rest of Europe Multi Layer Labels Revenue (billion) Forecast, by Application 2020 & 2033
- Table 54: Rest of Europe Multi Layer Labels Volume (K) Forecast, by Application 2020 & 2033
- Table 55: Global Multi Layer Labels Revenue billion Forecast, by Application 2020 & 2033
- Table 56: Global Multi Layer Labels Volume K Forecast, by Application 2020 & 2033
- Table 57: Global Multi Layer Labels Revenue billion Forecast, by Type 2020 & 2033
- Table 58: Global Multi Layer Labels Volume K Forecast, by Type 2020 & 2033
- Table 59: Global Multi Layer Labels Revenue billion Forecast, by Country 2020 & 2033
- Table 60: Global Multi Layer Labels Volume K Forecast, by Country 2020 & 2033
- Table 61: Turkey Multi Layer Labels Revenue (billion) Forecast, by Application 2020 & 2033
- Table 62: Turkey Multi Layer Labels Volume (K) Forecast, by Application 2020 & 2033
- Table 63: Israel Multi Layer Labels Revenue (billion) Forecast, by Application 2020 & 2033
- Table 64: Israel Multi Layer Labels Volume (K) Forecast, by Application 2020 & 2033
- Table 65: GCC Multi Layer Labels Revenue (billion) Forecast, by Application 2020 & 2033
- Table 66: GCC Multi Layer Labels Volume (K) Forecast, by Application 2020 & 2033
- Table 67: North Africa Multi Layer Labels Revenue (billion) Forecast, by Application 2020 & 2033
- Table 68: North Africa Multi Layer Labels Volume (K) Forecast, by Application 2020 & 2033
- Table 69: South Africa Multi Layer Labels Revenue (billion) Forecast, by Application 2020 & 2033
- Table 70: South Africa Multi Layer Labels Volume (K) Forecast, by Application 2020 & 2033
- Table 71: Rest of Middle East & Africa Multi Layer Labels Revenue (billion) Forecast, by Application 2020 & 2033
- Table 72: Rest of Middle East & Africa Multi Layer Labels Volume (K) Forecast, by Application 2020 & 2033
- Table 73: Global Multi Layer Labels Revenue billion Forecast, by Application 2020 & 2033
- Table 74: Global Multi Layer Labels Volume K Forecast, by Application 2020 & 2033
- Table 75: Global Multi Layer Labels Revenue billion Forecast, by Type 2020 & 2033
- Table 76: Global Multi Layer Labels Volume K Forecast, by Type 2020 & 2033
- Table 77: Global Multi Layer Labels Revenue billion Forecast, by Country 2020 & 2033
- Table 78: Global Multi Layer Labels Volume K Forecast, by Country 2020 & 2033
- Table 79: China Multi Layer Labels Revenue (billion) Forecast, by Application 2020 & 2033
- Table 80: China Multi Layer Labels Volume (K) Forecast, by Application 2020 & 2033
- Table 81: India Multi Layer Labels Revenue (billion) Forecast, by Application 2020 & 2033
- Table 82: India Multi Layer Labels Volume (K) Forecast, by Application 2020 & 2033
- Table 83: Japan Multi Layer Labels Revenue (billion) Forecast, by Application 2020 & 2033
- Table 84: Japan Multi Layer Labels Volume (K) Forecast, by Application 2020 & 2033
- Table 85: South Korea Multi Layer Labels Revenue (billion) Forecast, by Application 2020 & 2033
- Table 86: South Korea Multi Layer Labels Volume (K) Forecast, by Application 2020 & 2033
- Table 87: ASEAN Multi Layer Labels Revenue (billion) Forecast, by Application 2020 & 2033
- Table 88: ASEAN Multi Layer Labels Volume (K) Forecast, by Application 2020 & 2033
- Table 89: Oceania Multi Layer Labels Revenue (billion) Forecast, by Application 2020 & 2033
- Table 90: Oceania Multi Layer Labels Volume (K) Forecast, by Application 2020 & 2033
- Table 91: Rest of Asia Pacific Multi Layer Labels Revenue (billion) Forecast, by Application 2020 & 2033
- Table 92: Rest of Asia Pacific Multi Layer Labels Volume (K) Forecast, by Application 2020 & 2033
Frequently Asked Questions
1. What is the projected Compound Annual Growth Rate (CAGR) of the Multi Layer Labels?
The projected CAGR is approximately 8.85%.
2. Which companies are prominent players in the Multi Layer Labels?
Key companies in the market include Labelprint24, Altrif, Consolidated Label, Walker Etiketten, Optimum Group, Albeniz, Faubel, Froben Druck, Bizerba, MPS, S. Anand Packaging, Eltronis, Labelnet, Etiketa, MD Labels.
3. What are the main segments of the Multi Layer Labels?
The market segments include Application, Type.
4. Can you provide details about the market size?
The market size is estimated to be USD 6.48 billion as of 2022.
5. What are some drivers contributing to market growth?
N/A
6. What are the notable trends driving market growth?
N/A
7. Are there any restraints impacting market growth?
N/A
8. Can you provide examples of recent developments in the market?
N/A
9. What pricing options are available for accessing the report?
Pricing options include single-user, multi-user, and enterprise licenses priced at USD 3950.00, USD 5925.00, and USD 7900.00 respectively.
10. Is the market size provided in terms of value or volume?
The market size is provided in terms of value, measured in billion and volume, measured in K.
11. Are there any specific market keywords associated with the report?
Yes, the market keyword associated with the report is "Multi Layer Labels," which aids in identifying and referencing the specific market segment covered.
12. How do I determine which pricing option suits my needs best?
The pricing options vary based on user requirements and access needs. Individual users may opt for single-user licenses, while businesses requiring broader access may choose multi-user or enterprise licenses for cost-effective access to the report.
13. Are there any additional resources or data provided in the Multi Layer Labels report?
While the report offers comprehensive insights, it's advisable to review the specific contents or supplementary materials provided to ascertain if additional resources or data are available.
14. How can I stay updated on further developments or reports in the Multi Layer Labels?
To stay informed about further developments, trends, and reports in the Multi Layer Labels, consider subscribing to industry newsletters, following relevant companies and organizations, or regularly checking reputable industry news sources and publications.
Methodology
Step 1 - Identification of Relevant Samples Size from Population Database


Step 2 - Approaches for Defining Global Market Size (Value, Volume* & Price*)

Note*: In applicable scenarios
Step 3 - Data Sources
Primary Research
- Web Analytics
- Survey Reports
- Research Institute
- Latest Research Reports
- Opinion Leaders
Secondary Research
- Annual Reports
- White Paper
- Latest Press Release
- Industry Association
- Paid Database
- Investor Presentations

Step 4 - Data Triangulation
Involves using different sources of information in order to increase the validity of a study
These sources are likely to be stakeholders in a program - participants, other researchers, program staff, other community members, and so on.
Then we put all data in single framework & apply various statistical tools to find out the dynamic on the market.
During the analysis stage, feedback from the stakeholder groups would be compared to determine areas of agreement as well as areas of divergence