

Key Insights
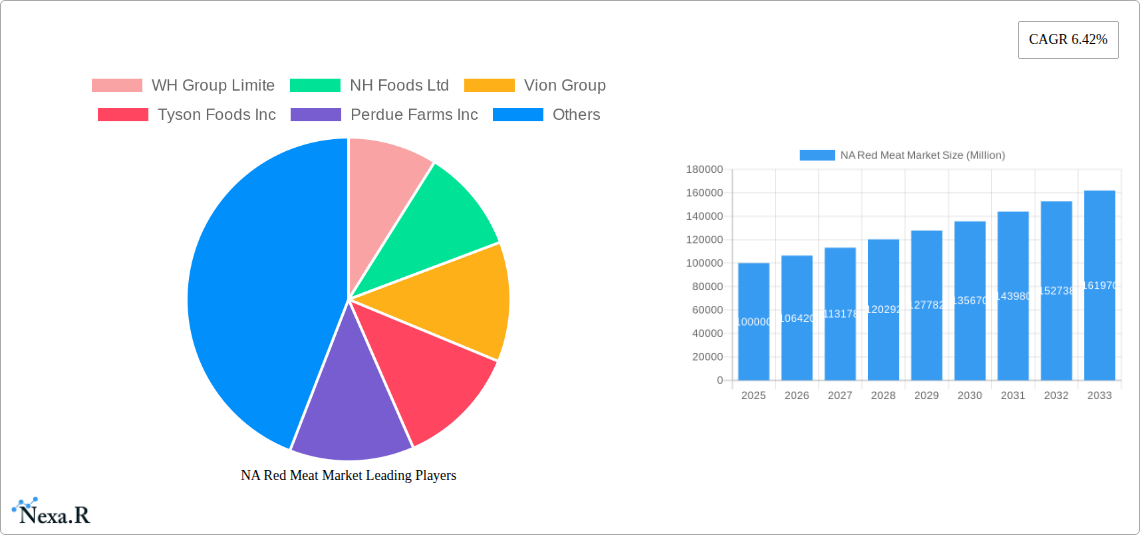
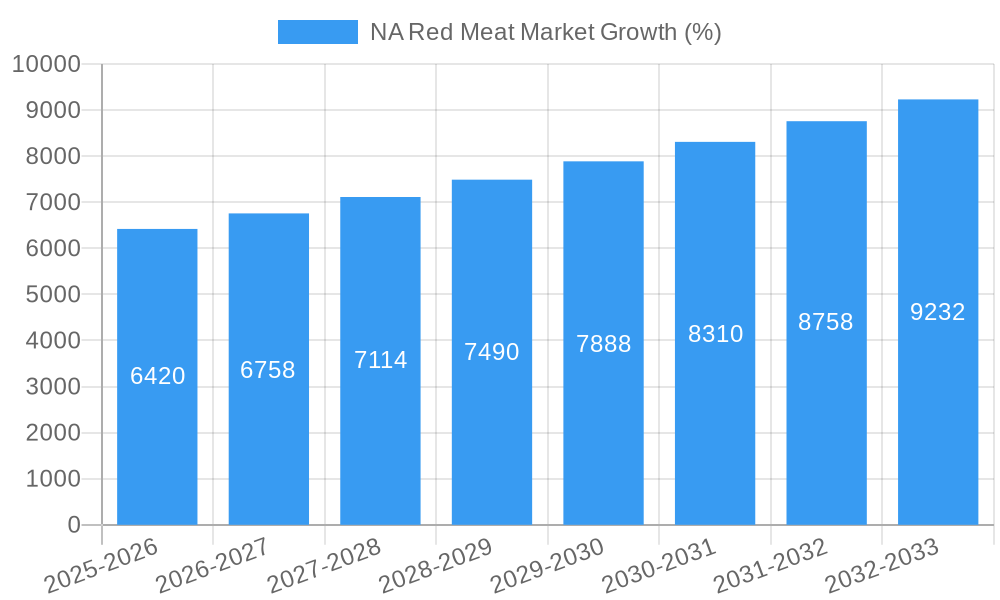
The North American red meat market, encompassing beef, mutton, pork, and other meats, presents a dynamic landscape characterized by steady growth and evolving consumer preferences. With a 2025 market size estimated at $100 billion (based on a global market size and reasonable regional allocation, considering North America’s significant red meat consumption), the market is projected to experience a compound annual growth rate (CAGR) of 6.42% from 2025 to 2033. This growth is fueled by several key drivers. Increasing consumer demand for protein-rich diets, particularly in rapidly growing urban populations, continues to propel market expansion. Innovation in processing and packaging technologies, leading to extended shelf life and enhanced convenience, further contributes to market growth. The rise of value-added red meat products, such as ready-to-eat meals and marinated cuts, caters to busy lifestyles and is a major trend impacting the market's composition.
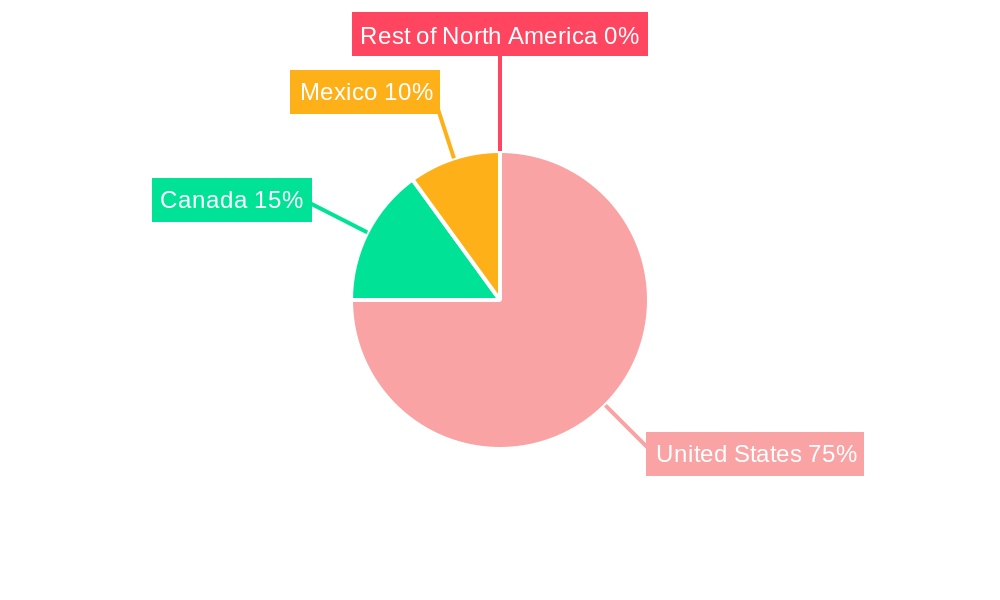
However, the market is not without its challenges. Growing concerns regarding the environmental impact of red meat production, including greenhouse gas emissions and land use, pose a significant restraint. Fluctuations in livestock prices and feed costs directly affect profitability and market stability. Furthermore, shifting consumer preferences towards healthier alternatives, such as plant-based proteins, present a challenge to sustained growth. Market segmentation reveals strong performance across various forms (canned, fresh/chilled, frozen, processed) and distribution channels (off-trade and on-trade). The competition among major players, including WH Group Limited, Tyson Foods Inc., and JBS S.A., is intense, necessitating strategic innovations in product offerings and supply chain management to maintain market share and capture growth opportunities. Regional variations exist, with the United States dominating the North American market, followed by Canada and Mexico.
North America Red Meat Market Report: 2019-2033
This comprehensive report provides an in-depth analysis of the North America (NA) red meat market, encompassing its dynamics, growth trends, dominant segments, and key players. With a study period spanning 2019-2033 (Base Year: 2025, Estimated Year: 2025, Forecast Period: 2025-2033, Historical Period: 2019-2024), this report offers invaluable insights for industry professionals, investors, and strategic decision-makers. The market is segmented by Form (Canned, Fresh/Chilled, Frozen, Processed), Type (Beef, Mutton, Pork, Other Meat), and Distribution Channel (Off-Trade, On-Trade). The total market size is predicted to reach xx Million units by 2033.
NA Red Meat Market Market Dynamics & Structure
The NA red meat market is characterized by moderate concentration, with a few large players dominating alongside numerous smaller regional players. Technological innovations, particularly in processing and packaging, are key drivers, alongside evolving consumer preferences towards value-added and organic products. Stringent regulatory frameworks regarding food safety and animal welfare impact market operations. Competitive substitutes, like plant-based alternatives, present challenges, though red meat retains strong consumer loyalty. The market is also influenced by end-user demographics, with shifts in consumer preferences toward health and sustainability shaping demand. Mergers and acquisitions (M&A) activity is significant, with larger companies consolidating their market share. In the past five years, the M&A deal volume averaged xx deals annually, resulting in a market share concentration of approximately xx% amongst the top 5 players by 2024.
- Market Concentration: Moderately concentrated, with top 5 players holding xx% market share (2024).
- Technological Innovation: Focus on automation, improved processing techniques, and sustainable packaging solutions.
- Regulatory Landscape: Stringent food safety and animal welfare regulations.
- Competitive Substitutes: Growing plant-based meat alternatives pose a competitive threat.
- End-User Demographics: Shifting consumer preferences towards healthier and more sustainable options.
- M&A Activity: Significant consolidation through acquisitions and mergers, enhancing market share.
NA Red Meat Market Growth Trends & Insights
The NA red meat market experienced a compound annual growth rate (CAGR) of xx% during the historical period (2019-2024). This growth is attributed to several factors, including stable population growth, increasing disposable incomes, and sustained demand for protein-rich diets. However, growth is anticipated to moderate in the forecast period (2025-2033) to a CAGR of xx%, primarily due to increased competition from plant-based alternatives and heightened consumer awareness regarding health and sustainability. Technological disruptions, such as precision livestock farming and advanced processing technologies, are influencing efficiency and production capacity. Consumer behavior is shifting towards premium and value-added products, creating opportunities for innovation and differentiation. Market penetration of organic and grass-fed red meat is gradually increasing, though it remains a niche segment.
Dominant Regions, Countries, or Segments in NA Red Meat Market
The US remains the dominant market within NA, accounting for approximately xx% of the total red meat market in 2024. Within the US, the Midwest region exhibits strong growth due to robust livestock production and established processing infrastructure. The Fresh/Chilled segment dominates the market by form, holding a market share of xx% in 2024, driven by consumer preference for freshness and quality. Beef constitutes the largest type segment, with a market share of around xx% in 2024, while the Off-Trade channel, encompassing grocery stores and supermarkets, accounts for the largest distribution share.
- Key Drivers: Robust livestock production, established infrastructure, high consumer spending.
- Dominance Factors: High per capita consumption, established supply chain, strong consumer demand for beef.
- Growth Potential: Continued growth expected in the US, driven by population growth and sustained demand, while opportunities exist in expanding niche segments like organic and grass-fed options.
NA Red Meat Market Product Landscape
Product innovation focuses on value-added offerings, including marinated, seasoned, and ready-to-cook red meat products. Convenience and ease of preparation are key selling propositions. Technological advancements include improved packaging solutions extending shelf life and reducing food waste. Premium products like organic and grass-fed meat command higher price points, catering to the growing health-conscious consumer segment.
Key Drivers, Barriers & Challenges in NA Red Meat Market
Key Drivers: Growing population, rising disposable incomes, increasing demand for protein-rich food, and technological advancements in processing and packaging.
Challenges & Restraints: Increasing competition from plant-based meat alternatives, rising input costs (feed, labor), stringent regulatory compliance, and concerns regarding animal welfare and environmental sustainability. Supply chain disruptions can also have quantifiable impacts, resulting in price fluctuations of xx% during periods of volatility (e.g., xx).
Emerging Opportunities in NA Red Meat Market
Growing demand for organic and sustainably produced red meat presents significant opportunities. Expanding into niche markets targeting specific dietary needs and preferences (e.g., low-sodium, low-fat options) creates avenues for growth. Innovative packaging and value-added products that enhance convenience and reduce food waste represent key opportunities for market expansion.
Growth Accelerators in the NA Red Meat Market Industry
Technological advancements, such as precision livestock farming and automated processing, significantly enhance efficiency and productivity. Strategic partnerships between producers and retailers improve supply chain management and optimize product distribution. Expansion into new markets and tapping into emerging consumer trends (e.g., personalized nutrition) drives market growth.
Key Players Shaping the NA Red Meat Market Market
- WH Group Limited
- NH Foods Ltd
- Vion Group
- Tyson Foods Inc
- Perdue Farms Inc
- Conagra Brands Inc
- Sysco Corporation
- The Kraft Heinz Company
- Hormel Foods Corporation
- Cargill Inc
- Marfrig Global Foods S.A
- The Clemens Family Corporation
- JBS S.A
- OSI Group
Notable Milestones in NA Red Meat Market Sector
- November 2022: Conagra Brands, Inc. announced a USD 60 million investment to expand its Troy facility, increasing production capacity for Slim Jim products.
- December 2022: JBS acquired certain assets from TriOak Foods, strengthening its supply chain control.
- April 2023: JBS USA's Swift Prepared Food launched Principe Foods, a producer of high-quality Italian meats and charcuterie.
In-Depth NA Red Meat Market Market Outlook
The NA red meat market is poised for continued growth, driven by technological advancements, strategic partnerships, and evolving consumer preferences. Opportunities exist in expanding niche segments, enhancing sustainability practices, and developing innovative product offerings. The focus on value-added products, health-conscious options, and sustainable production will shape the future of the market, creating new avenues for growth and profitability.
NA Red Meat Market Segmentation
-
1. Type
- 1.1. Beef
- 1.2. Mutton
- 1.3. Pork
- 1.4. Other Meat
-
2. Form
- 2.1. Canned
- 2.2. Fresh / Chilled
- 2.3. Frozen
- 2.4. Processed
-
3. Distribution Channel
-
3.1. Off-Trade
- 3.1.1. Convenience Stores
- 3.1.2. Online Channel
- 3.1.3. Supermarkets and Hypermarkets
- 3.1.4. Others
- 3.2. On-Trade
-
3.1. Off-Trade
NA Red Meat Market Segmentation By Geography
-
1. North America
- 1.1. United States
- 1.2. Canada
- 1.3. Mexico
-
2. South America
- 2.1. Brazil
- 2.2. Argentina
- 2.3. Rest of South America
-
3. Europe
- 3.1. United Kingdom
- 3.2. Germany
- 3.3. France
- 3.4. Italy
- 3.5. Spain
- 3.6. Russia
- 3.7. Benelux
- 3.8. Nordics
- 3.9. Rest of Europe
-
4. Middle East & Africa
- 4.1. Turkey
- 4.2. Israel
- 4.3. GCC
- 4.4. North Africa
- 4.5. South Africa
- 4.6. Rest of Middle East & Africa
-
5. Asia Pacific
- 5.1. China
- 5.2. India
- 5.3. Japan
- 5.4. South Korea
- 5.5. ASEAN
- 5.6. Oceania
- 5.7. Rest of Asia Pacific
NA Red Meat Market REPORT HIGHLIGHTS
| Aspects | Details |
|---|---|
| Study Period | 2019-2033 |
| Base Year | 2024 |
| Estimated Year | 2025 |
| Forecast Period | 2025-2033 |
| Historical Period | 2019-2024 |
| Growth Rate | CAGR of 6.42% from 2019-2033 |
| Segmentation |
|
Table of Contents
- 1. Introduction
- 1.1. Research Scope
- 1.2. Market Segmentation
- 1.3. Research Methodology
- 1.4. Definitions and Assumptions
- 2. Executive Summary
- 2.1. Introduction
- 3. Market Dynamics
- 3.1. Introduction
- 3.2. Market Drivers
- 3.2.1. Increasing Demand for Low-Fat and Low-Calorie Food; Increasing Product Innovation
- 3.3. Market Restrains
- 3.3.1. ; Threat of New Entrants; Bargaining Power of Buyers/Consumers; Bargaining Power of Suppliers; Threat of Substitute Products; Degree Of Competition
- 3.4. Market Trends
- 3.4.1. OTHER KEY INDUSTRY TRENDS COVERED IN THE REPORT
- 4. Market Factor Analysis
- 4.1. Porters Five Forces
- 4.2. Supply/Value Chain
- 4.3. PESTEL analysis
- 4.4. Market Entropy
- 4.5. Patent/Trademark Analysis
- 5. Global NA Red Meat Market Analysis, Insights and Forecast, 2019-2031
- 5.1. Market Analysis, Insights and Forecast - by Type
- 5.1.1. Beef
- 5.1.2. Mutton
- 5.1.3. Pork
- 5.1.4. Other Meat
- 5.2. Market Analysis, Insights and Forecast - by Form
- 5.2.1. Canned
- 5.2.2. Fresh / Chilled
- 5.2.3. Frozen
- 5.2.4. Processed
- 5.3. Market Analysis, Insights and Forecast - by Distribution Channel
- 5.3.1. Off-Trade
- 5.3.1.1. Convenience Stores
- 5.3.1.2. Online Channel
- 5.3.1.3. Supermarkets and Hypermarkets
- 5.3.1.4. Others
- 5.3.2. On-Trade
- 5.3.1. Off-Trade
- 5.4. Market Analysis, Insights and Forecast - by Region
- 5.4.1. North America
- 5.4.2. South America
- 5.4.3. Europe
- 5.4.4. Middle East & Africa
- 5.4.5. Asia Pacific
- 5.1. Market Analysis, Insights and Forecast - by Type
- 6. North America NA Red Meat Market Analysis, Insights and Forecast, 2019-2031
- 6.1. Market Analysis, Insights and Forecast - by Type
- 6.1.1. Beef
- 6.1.2. Mutton
- 6.1.3. Pork
- 6.1.4. Other Meat
- 6.2. Market Analysis, Insights and Forecast - by Form
- 6.2.1. Canned
- 6.2.2. Fresh / Chilled
- 6.2.3. Frozen
- 6.2.4. Processed
- 6.3. Market Analysis, Insights and Forecast - by Distribution Channel
- 6.3.1. Off-Trade
- 6.3.1.1. Convenience Stores
- 6.3.1.2. Online Channel
- 6.3.1.3. Supermarkets and Hypermarkets
- 6.3.1.4. Others
- 6.3.2. On-Trade
- 6.3.1. Off-Trade
- 6.1. Market Analysis, Insights and Forecast - by Type
- 7. South America NA Red Meat Market Analysis, Insights and Forecast, 2019-2031
- 7.1. Market Analysis, Insights and Forecast - by Type
- 7.1.1. Beef
- 7.1.2. Mutton
- 7.1.3. Pork
- 7.1.4. Other Meat
- 7.2. Market Analysis, Insights and Forecast - by Form
- 7.2.1. Canned
- 7.2.2. Fresh / Chilled
- 7.2.3. Frozen
- 7.2.4. Processed
- 7.3. Market Analysis, Insights and Forecast - by Distribution Channel
- 7.3.1. Off-Trade
- 7.3.1.1. Convenience Stores
- 7.3.1.2. Online Channel
- 7.3.1.3. Supermarkets and Hypermarkets
- 7.3.1.4. Others
- 7.3.2. On-Trade
- 7.3.1. Off-Trade
- 7.1. Market Analysis, Insights and Forecast - by Type
- 8. Europe NA Red Meat Market Analysis, Insights and Forecast, 2019-2031
- 8.1. Market Analysis, Insights and Forecast - by Type
- 8.1.1. Beef
- 8.1.2. Mutton
- 8.1.3. Pork
- 8.1.4. Other Meat
- 8.2. Market Analysis, Insights and Forecast - by Form
- 8.2.1. Canned
- 8.2.2. Fresh / Chilled
- 8.2.3. Frozen
- 8.2.4. Processed
- 8.3. Market Analysis, Insights and Forecast - by Distribution Channel
- 8.3.1. Off-Trade
- 8.3.1.1. Convenience Stores
- 8.3.1.2. Online Channel
- 8.3.1.3. Supermarkets and Hypermarkets
- 8.3.1.4. Others
- 8.3.2. On-Trade
- 8.3.1. Off-Trade
- 8.1. Market Analysis, Insights and Forecast - by Type
- 9. Middle East & Africa NA Red Meat Market Analysis, Insights and Forecast, 2019-2031
- 9.1. Market Analysis, Insights and Forecast - by Type
- 9.1.1. Beef
- 9.1.2. Mutton
- 9.1.3. Pork
- 9.1.4. Other Meat
- 9.2. Market Analysis, Insights and Forecast - by Form
- 9.2.1. Canned
- 9.2.2. Fresh / Chilled
- 9.2.3. Frozen
- 9.2.4. Processed
- 9.3. Market Analysis, Insights and Forecast - by Distribution Channel
- 9.3.1. Off-Trade
- 9.3.1.1. Convenience Stores
- 9.3.1.2. Online Channel
- 9.3.1.3. Supermarkets and Hypermarkets
- 9.3.1.4. Others
- 9.3.2. On-Trade
- 9.3.1. Off-Trade
- 9.1. Market Analysis, Insights and Forecast - by Type
- 10. Asia Pacific NA Red Meat Market Analysis, Insights and Forecast, 2019-2031
- 10.1. Market Analysis, Insights and Forecast - by Type
- 10.1.1. Beef
- 10.1.2. Mutton
- 10.1.3. Pork
- 10.1.4. Other Meat
- 10.2. Market Analysis, Insights and Forecast - by Form
- 10.2.1. Canned
- 10.2.2. Fresh / Chilled
- 10.2.3. Frozen
- 10.2.4. Processed
- 10.3. Market Analysis, Insights and Forecast - by Distribution Channel
- 10.3.1. Off-Trade
- 10.3.1.1. Convenience Stores
- 10.3.1.2. Online Channel
- 10.3.1.3. Supermarkets and Hypermarkets
- 10.3.1.4. Others
- 10.3.2. On-Trade
- 10.3.1. Off-Trade
- 10.1. Market Analysis, Insights and Forecast - by Type
- 11. North America NA Red Meat Market Analysis, Insights and Forecast, 2019-2031
- 11.1. Market Analysis, Insights and Forecast - By Country/Sub-region
- 11.1.1 United States
- 11.1.2 Canada
- 11.1.3 Mexico
- 11.1.4 Rest of North America
- 12. Europe NA Red Meat Market Analysis, Insights and Forecast, 2019-2031
- 12.1. Market Analysis, Insights and Forecast - By Country/Sub-region
- 12.1.1 Spain
- 12.1.2 United Kingdom
- 12.1.3 Germany
- 12.1.4 France
- 12.1.5 Italy
- 12.1.6 Russia
- 12.1.7 Rest of Europe
- 13. Asia Pacific NA Red Meat Market Analysis, Insights and Forecast, 2019-2031
- 13.1. Market Analysis, Insights and Forecast - By Country/Sub-region
- 13.1.1 China
- 13.1.2 Japan
- 13.1.3 India
- 13.1.4 Australia
- 13.1.5 Rest of Asia Pacific
- 14. South America NA Red Meat Market Analysis, Insights and Forecast, 2019-2031
- 14.1. Market Analysis, Insights and Forecast - By Country/Sub-region
- 14.1.1 Brazil
- 14.1.2 Argentina
- 14.1.3 Rest of South America
- 15. Middle East and Africa NA Red Meat Market Analysis, Insights and Forecast, 2019-2031
- 15.1. Market Analysis, Insights and Forecast - By Country/Sub-region
- 15.1.1 South Africa
- 15.1.2 United Arab Emirates
- 15.1.3 Rest of Middle East and Africa
- 16. Competitive Analysis
- 16.1. Global Market Share Analysis 2024
- 16.2. Company Profiles
- 16.2.1 WH Group Limite
- 16.2.1.1. Overview
- 16.2.1.2. Products
- 16.2.1.3. SWOT Analysis
- 16.2.1.4. Recent Developments
- 16.2.1.5. Financials (Based on Availability)
- 16.2.2 NH Foods Ltd
- 16.2.2.1. Overview
- 16.2.2.2. Products
- 16.2.2.3. SWOT Analysis
- 16.2.2.4. Recent Developments
- 16.2.2.5. Financials (Based on Availability)
- 16.2.3 Vion Group
- 16.2.3.1. Overview
- 16.2.3.2. Products
- 16.2.3.3. SWOT Analysis
- 16.2.3.4. Recent Developments
- 16.2.3.5. Financials (Based on Availability)
- 16.2.4 Tyson Foods Inc
- 16.2.4.1. Overview
- 16.2.4.2. Products
- 16.2.4.3. SWOT Analysis
- 16.2.4.4. Recent Developments
- 16.2.4.5. Financials (Based on Availability)
- 16.2.5 Perdue Farms Inc
- 16.2.5.1. Overview
- 16.2.5.2. Products
- 16.2.5.3. SWOT Analysis
- 16.2.5.4. Recent Developments
- 16.2.5.5. Financials (Based on Availability)
- 16.2.6 Conagra Brands Inc
- 16.2.6.1. Overview
- 16.2.6.2. Products
- 16.2.6.3. SWOT Analysis
- 16.2.6.4. Recent Developments
- 16.2.6.5. Financials (Based on Availability)
- 16.2.7 Sysco Corporation
- 16.2.7.1. Overview
- 16.2.7.2. Products
- 16.2.7.3. SWOT Analysis
- 16.2.7.4. Recent Developments
- 16.2.7.5. Financials (Based on Availability)
- 16.2.8 The Kraft Heinz Company
- 16.2.8.1. Overview
- 16.2.8.2. Products
- 16.2.8.3. SWOT Analysis
- 16.2.8.4. Recent Developments
- 16.2.8.5. Financials (Based on Availability)
- 16.2.9 Hormel Foods Corporation
- 16.2.9.1. Overview
- 16.2.9.2. Products
- 16.2.9.3. SWOT Analysis
- 16.2.9.4. Recent Developments
- 16.2.9.5. Financials (Based on Availability)
- 16.2.10 Cargill Inc
- 16.2.10.1. Overview
- 16.2.10.2. Products
- 16.2.10.3. SWOT Analysis
- 16.2.10.4. Recent Developments
- 16.2.10.5. Financials (Based on Availability)
- 16.2.11 Marfrig Global Foods S A
- 16.2.11.1. Overview
- 16.2.11.2. Products
- 16.2.11.3. SWOT Analysis
- 16.2.11.4. Recent Developments
- 16.2.11.5. Financials (Based on Availability)
- 16.2.12 The Clemens Family Corporation
- 16.2.12.1. Overview
- 16.2.12.2. Products
- 16.2.12.3. SWOT Analysis
- 16.2.12.4. Recent Developments
- 16.2.12.5. Financials (Based on Availability)
- 16.2.13 JBS SA
- 16.2.13.1. Overview
- 16.2.13.2. Products
- 16.2.13.3. SWOT Analysis
- 16.2.13.4. Recent Developments
- 16.2.13.5. Financials (Based on Availability)
- 16.2.14 OSI Group
- 16.2.14.1. Overview
- 16.2.14.2. Products
- 16.2.14.3. SWOT Analysis
- 16.2.14.4. Recent Developments
- 16.2.14.5. Financials (Based on Availability)
- 16.2.1 WH Group Limite
List of Figures
- Figure 1: Global NA Red Meat Market Revenue Breakdown (Million, %) by Region 2024 & 2032
- Figure 2: North America NA Red Meat Market Revenue (Million), by Country 2024 & 2032
- Figure 3: North America NA Red Meat Market Revenue Share (%), by Country 2024 & 2032
- Figure 4: Europe NA Red Meat Market Revenue (Million), by Country 2024 & 2032
- Figure 5: Europe NA Red Meat Market Revenue Share (%), by Country 2024 & 2032
- Figure 6: Asia Pacific NA Red Meat Market Revenue (Million), by Country 2024 & 2032
- Figure 7: Asia Pacific NA Red Meat Market Revenue Share (%), by Country 2024 & 2032
- Figure 8: South America NA Red Meat Market Revenue (Million), by Country 2024 & 2032
- Figure 9: South America NA Red Meat Market Revenue Share (%), by Country 2024 & 2032
- Figure 10: Middle East and Africa NA Red Meat Market Revenue (Million), by Country 2024 & 2032
- Figure 11: Middle East and Africa NA Red Meat Market Revenue Share (%), by Country 2024 & 2032
- Figure 12: North America NA Red Meat Market Revenue (Million), by Type 2024 & 2032
- Figure 13: North America NA Red Meat Market Revenue Share (%), by Type 2024 & 2032
- Figure 14: North America NA Red Meat Market Revenue (Million), by Form 2024 & 2032
- Figure 15: North America NA Red Meat Market Revenue Share (%), by Form 2024 & 2032
- Figure 16: North America NA Red Meat Market Revenue (Million), by Distribution Channel 2024 & 2032
- Figure 17: North America NA Red Meat Market Revenue Share (%), by Distribution Channel 2024 & 2032
- Figure 18: North America NA Red Meat Market Revenue (Million), by Country 2024 & 2032
- Figure 19: North America NA Red Meat Market Revenue Share (%), by Country 2024 & 2032
- Figure 20: South America NA Red Meat Market Revenue (Million), by Type 2024 & 2032
- Figure 21: South America NA Red Meat Market Revenue Share (%), by Type 2024 & 2032
- Figure 22: South America NA Red Meat Market Revenue (Million), by Form 2024 & 2032
- Figure 23: South America NA Red Meat Market Revenue Share (%), by Form 2024 & 2032
- Figure 24: South America NA Red Meat Market Revenue (Million), by Distribution Channel 2024 & 2032
- Figure 25: South America NA Red Meat Market Revenue Share (%), by Distribution Channel 2024 & 2032
- Figure 26: South America NA Red Meat Market Revenue (Million), by Country 2024 & 2032
- Figure 27: South America NA Red Meat Market Revenue Share (%), by Country 2024 & 2032
- Figure 28: Europe NA Red Meat Market Revenue (Million), by Type 2024 & 2032
- Figure 29: Europe NA Red Meat Market Revenue Share (%), by Type 2024 & 2032
- Figure 30: Europe NA Red Meat Market Revenue (Million), by Form 2024 & 2032
- Figure 31: Europe NA Red Meat Market Revenue Share (%), by Form 2024 & 2032
- Figure 32: Europe NA Red Meat Market Revenue (Million), by Distribution Channel 2024 & 2032
- Figure 33: Europe NA Red Meat Market Revenue Share (%), by Distribution Channel 2024 & 2032
- Figure 34: Europe NA Red Meat Market Revenue (Million), by Country 2024 & 2032
- Figure 35: Europe NA Red Meat Market Revenue Share (%), by Country 2024 & 2032
- Figure 36: Middle East & Africa NA Red Meat Market Revenue (Million), by Type 2024 & 2032
- Figure 37: Middle East & Africa NA Red Meat Market Revenue Share (%), by Type 2024 & 2032
- Figure 38: Middle East & Africa NA Red Meat Market Revenue (Million), by Form 2024 & 2032
- Figure 39: Middle East & Africa NA Red Meat Market Revenue Share (%), by Form 2024 & 2032
- Figure 40: Middle East & Africa NA Red Meat Market Revenue (Million), by Distribution Channel 2024 & 2032
- Figure 41: Middle East & Africa NA Red Meat Market Revenue Share (%), by Distribution Channel 2024 & 2032
- Figure 42: Middle East & Africa NA Red Meat Market Revenue (Million), by Country 2024 & 2032
- Figure 43: Middle East & Africa NA Red Meat Market Revenue Share (%), by Country 2024 & 2032
- Figure 44: Asia Pacific NA Red Meat Market Revenue (Million), by Type 2024 & 2032
- Figure 45: Asia Pacific NA Red Meat Market Revenue Share (%), by Type 2024 & 2032
- Figure 46: Asia Pacific NA Red Meat Market Revenue (Million), by Form 2024 & 2032
- Figure 47: Asia Pacific NA Red Meat Market Revenue Share (%), by Form 2024 & 2032
- Figure 48: Asia Pacific NA Red Meat Market Revenue (Million), by Distribution Channel 2024 & 2032
- Figure 49: Asia Pacific NA Red Meat Market Revenue Share (%), by Distribution Channel 2024 & 2032
- Figure 50: Asia Pacific NA Red Meat Market Revenue (Million), by Country 2024 & 2032
- Figure 51: Asia Pacific NA Red Meat Market Revenue Share (%), by Country 2024 & 2032
List of Tables
- Table 1: Global NA Red Meat Market Revenue Million Forecast, by Region 2019 & 2032
- Table 2: Global NA Red Meat Market Revenue Million Forecast, by Type 2019 & 2032
- Table 3: Global NA Red Meat Market Revenue Million Forecast, by Form 2019 & 2032
- Table 4: Global NA Red Meat Market Revenue Million Forecast, by Distribution Channel 2019 & 2032
- Table 5: Global NA Red Meat Market Revenue Million Forecast, by Region 2019 & 2032
- Table 6: Global NA Red Meat Market Revenue Million Forecast, by Country 2019 & 2032
- Table 7: United States NA Red Meat Market Revenue (Million) Forecast, by Application 2019 & 2032
- Table 8: Canada NA Red Meat Market Revenue (Million) Forecast, by Application 2019 & 2032
- Table 9: Mexico NA Red Meat Market Revenue (Million) Forecast, by Application 2019 & 2032
- Table 10: Rest of North America NA Red Meat Market Revenue (Million) Forecast, by Application 2019 & 2032
- Table 11: Global NA Red Meat Market Revenue Million Forecast, by Country 2019 & 2032
- Table 12: Spain NA Red Meat Market Revenue (Million) Forecast, by Application 2019 & 2032
- Table 13: United Kingdom NA Red Meat Market Revenue (Million) Forecast, by Application 2019 & 2032
- Table 14: Germany NA Red Meat Market Revenue (Million) Forecast, by Application 2019 & 2032
- Table 15: France NA Red Meat Market Revenue (Million) Forecast, by Application 2019 & 2032
- Table 16: Italy NA Red Meat Market Revenue (Million) Forecast, by Application 2019 & 2032
- Table 17: Russia NA Red Meat Market Revenue (Million) Forecast, by Application 2019 & 2032
- Table 18: Rest of Europe NA Red Meat Market Revenue (Million) Forecast, by Application 2019 & 2032
- Table 19: Global NA Red Meat Market Revenue Million Forecast, by Country 2019 & 2032
- Table 20: China NA Red Meat Market Revenue (Million) Forecast, by Application 2019 & 2032
- Table 21: Japan NA Red Meat Market Revenue (Million) Forecast, by Application 2019 & 2032
- Table 22: India NA Red Meat Market Revenue (Million) Forecast, by Application 2019 & 2032
- Table 23: Australia NA Red Meat Market Revenue (Million) Forecast, by Application 2019 & 2032
- Table 24: Rest of Asia Pacific NA Red Meat Market Revenue (Million) Forecast, by Application 2019 & 2032
- Table 25: Global NA Red Meat Market Revenue Million Forecast, by Country 2019 & 2032
- Table 26: Brazil NA Red Meat Market Revenue (Million) Forecast, by Application 2019 & 2032
- Table 27: Argentina NA Red Meat Market Revenue (Million) Forecast, by Application 2019 & 2032
- Table 28: Rest of South America NA Red Meat Market Revenue (Million) Forecast, by Application 2019 & 2032
- Table 29: Global NA Red Meat Market Revenue Million Forecast, by Country 2019 & 2032
- Table 30: South Africa NA Red Meat Market Revenue (Million) Forecast, by Application 2019 & 2032
- Table 31: United Arab Emirates NA Red Meat Market Revenue (Million) Forecast, by Application 2019 & 2032
- Table 32: Rest of Middle East and Africa NA Red Meat Market Revenue (Million) Forecast, by Application 2019 & 2032
- Table 33: Global NA Red Meat Market Revenue Million Forecast, by Type 2019 & 2032
- Table 34: Global NA Red Meat Market Revenue Million Forecast, by Form 2019 & 2032
- Table 35: Global NA Red Meat Market Revenue Million Forecast, by Distribution Channel 2019 & 2032
- Table 36: Global NA Red Meat Market Revenue Million Forecast, by Country 2019 & 2032
- Table 37: United States NA Red Meat Market Revenue (Million) Forecast, by Application 2019 & 2032
- Table 38: Canada NA Red Meat Market Revenue (Million) Forecast, by Application 2019 & 2032
- Table 39: Mexico NA Red Meat Market Revenue (Million) Forecast, by Application 2019 & 2032
- Table 40: Global NA Red Meat Market Revenue Million Forecast, by Type 2019 & 2032
- Table 41: Global NA Red Meat Market Revenue Million Forecast, by Form 2019 & 2032
- Table 42: Global NA Red Meat Market Revenue Million Forecast, by Distribution Channel 2019 & 2032
- Table 43: Global NA Red Meat Market Revenue Million Forecast, by Country 2019 & 2032
- Table 44: Brazil NA Red Meat Market Revenue (Million) Forecast, by Application 2019 & 2032
- Table 45: Argentina NA Red Meat Market Revenue (Million) Forecast, by Application 2019 & 2032
- Table 46: Rest of South America NA Red Meat Market Revenue (Million) Forecast, by Application 2019 & 2032
- Table 47: Global NA Red Meat Market Revenue Million Forecast, by Type 2019 & 2032
- Table 48: Global NA Red Meat Market Revenue Million Forecast, by Form 2019 & 2032
- Table 49: Global NA Red Meat Market Revenue Million Forecast, by Distribution Channel 2019 & 2032
- Table 50: Global NA Red Meat Market Revenue Million Forecast, by Country 2019 & 2032
- Table 51: United Kingdom NA Red Meat Market Revenue (Million) Forecast, by Application 2019 & 2032
- Table 52: Germany NA Red Meat Market Revenue (Million) Forecast, by Application 2019 & 2032
- Table 53: France NA Red Meat Market Revenue (Million) Forecast, by Application 2019 & 2032
- Table 54: Italy NA Red Meat Market Revenue (Million) Forecast, by Application 2019 & 2032
- Table 55: Spain NA Red Meat Market Revenue (Million) Forecast, by Application 2019 & 2032
- Table 56: Russia NA Red Meat Market Revenue (Million) Forecast, by Application 2019 & 2032
- Table 57: Benelux NA Red Meat Market Revenue (Million) Forecast, by Application 2019 & 2032
- Table 58: Nordics NA Red Meat Market Revenue (Million) Forecast, by Application 2019 & 2032
- Table 59: Rest of Europe NA Red Meat Market Revenue (Million) Forecast, by Application 2019 & 2032
- Table 60: Global NA Red Meat Market Revenue Million Forecast, by Type 2019 & 2032
- Table 61: Global NA Red Meat Market Revenue Million Forecast, by Form 2019 & 2032
- Table 62: Global NA Red Meat Market Revenue Million Forecast, by Distribution Channel 2019 & 2032
- Table 63: Global NA Red Meat Market Revenue Million Forecast, by Country 2019 & 2032
- Table 64: Turkey NA Red Meat Market Revenue (Million) Forecast, by Application 2019 & 2032
- Table 65: Israel NA Red Meat Market Revenue (Million) Forecast, by Application 2019 & 2032
- Table 66: GCC NA Red Meat Market Revenue (Million) Forecast, by Application 2019 & 2032
- Table 67: North Africa NA Red Meat Market Revenue (Million) Forecast, by Application 2019 & 2032
- Table 68: South Africa NA Red Meat Market Revenue (Million) Forecast, by Application 2019 & 2032
- Table 69: Rest of Middle East & Africa NA Red Meat Market Revenue (Million) Forecast, by Application 2019 & 2032
- Table 70: Global NA Red Meat Market Revenue Million Forecast, by Type 2019 & 2032
- Table 71: Global NA Red Meat Market Revenue Million Forecast, by Form 2019 & 2032
- Table 72: Global NA Red Meat Market Revenue Million Forecast, by Distribution Channel 2019 & 2032
- Table 73: Global NA Red Meat Market Revenue Million Forecast, by Country 2019 & 2032
- Table 74: China NA Red Meat Market Revenue (Million) Forecast, by Application 2019 & 2032
- Table 75: India NA Red Meat Market Revenue (Million) Forecast, by Application 2019 & 2032
- Table 76: Japan NA Red Meat Market Revenue (Million) Forecast, by Application 2019 & 2032
- Table 77: South Korea NA Red Meat Market Revenue (Million) Forecast, by Application 2019 & 2032
- Table 78: ASEAN NA Red Meat Market Revenue (Million) Forecast, by Application 2019 & 2032
- Table 79: Oceania NA Red Meat Market Revenue (Million) Forecast, by Application 2019 & 2032
- Table 80: Rest of Asia Pacific NA Red Meat Market Revenue (Million) Forecast, by Application 2019 & 2032
Frequently Asked Questions
1. What is the projected Compound Annual Growth Rate (CAGR) of the NA Red Meat Market?
The projected CAGR is approximately 6.42%.
2. Which companies are prominent players in the NA Red Meat Market?
Key companies in the market include WH Group Limite, NH Foods Ltd, Vion Group, Tyson Foods Inc, Perdue Farms Inc, Conagra Brands Inc, Sysco Corporation, The Kraft Heinz Company, Hormel Foods Corporation, Cargill Inc, Marfrig Global Foods S A, The Clemens Family Corporation, JBS SA, OSI Group.
3. What are the main segments of the NA Red Meat Market?
The market segments include Type, Form, Distribution Channel.
4. Can you provide details about the market size?
The market size is estimated to be USD XX Million as of 2022.
5. What are some drivers contributing to market growth?
Increasing Demand for Low-Fat and Low-Calorie Food; Increasing Product Innovation.
6. What are the notable trends driving market growth?
OTHER KEY INDUSTRY TRENDS COVERED IN THE REPORT.
7. Are there any restraints impacting market growth?
; Threat of New Entrants; Bargaining Power of Buyers/Consumers; Bargaining Power of Suppliers; Threat of Substitute Products; Degree Of Competition.
8. Can you provide examples of recent developments in the market?
April 2023: Swift Prepared Food, a subsidiary of JBS USA, launched Principe Foods, which produces high-quality Italian meats and charcuterie.December 2022: JBS has acquired “certain assets” from US-based pork supplier TriOak Foods, strengthening its control over the supply chain.November 2022: Conagra Brands, Inc. has announced plans to invest about USD 60 million to expand the Troy facility's production capacity in Ohio, United States. Slim Jim products are mainly manufactured in the facility. Conagra stated that the 389,000 square foot plant will gain around 15,000 square feet as part of the expansion.
9. What pricing options are available for accessing the report?
Pricing options include single-user, multi-user, and enterprise licenses priced at USD 3800, USD 4500, and USD 5800 respectively.
10. Is the market size provided in terms of value or volume?
The market size is provided in terms of value, measured in Million.
11. Are there any specific market keywords associated with the report?
Yes, the market keyword associated with the report is "NA Red Meat Market," which aids in identifying and referencing the specific market segment covered.
12. How do I determine which pricing option suits my needs best?
The pricing options vary based on user requirements and access needs. Individual users may opt for single-user licenses, while businesses requiring broader access may choose multi-user or enterprise licenses for cost-effective access to the report.
13. Are there any additional resources or data provided in the NA Red Meat Market report?
While the report offers comprehensive insights, it's advisable to review the specific contents or supplementary materials provided to ascertain if additional resources or data are available.
14. How can I stay updated on further developments or reports in the NA Red Meat Market?
To stay informed about further developments, trends, and reports in the NA Red Meat Market, consider subscribing to industry newsletters, following relevant companies and organizations, or regularly checking reputable industry news sources and publications.
Methodology
Step 1 - Identification of Relevant Samples Size from Population Database


Step 2 - Approaches for Defining Global Market Size (Value, Volume* & Price*)

Note*: In applicable scenarios
Step 3 - Data Sources
Primary Research
- Web Analytics
- Survey Reports
- Research Institute
- Latest Research Reports
- Opinion Leaders
Secondary Research
- Annual Reports
- White Paper
- Latest Press Release
- Industry Association
- Paid Database
- Investor Presentations

Step 4 - Data Triangulation
Involves using different sources of information in order to increase the validity of a study
These sources are likely to be stakeholders in a program - participants, other researchers, program staff, other community members, and so on.
Then we put all data in single framework & apply various statistical tools to find out the dynamic on the market.
During the analysis stage, feedback from the stakeholder groups would be compared to determine areas of agreement as well as areas of divergence
