

Key Insights
The optical transceivers market, valued at $13.34 billion in 2025, is projected to experience robust growth, driven by the expanding data center infrastructure, increasing adoption of high-speed networking technologies (like 100Gbps and beyond), and the surge in 5G and cloud computing deployments. The Compound Annual Growth Rate (CAGR) of 13.09% from 2025 to 2033 indicates a significant market expansion. Key growth drivers include the ever-increasing demand for higher bandwidth and lower latency in data transmission, fueling the adoption of advanced protocols like DWDM and FTTX. The market is segmented by protocol (Ethernet, Fiber Channel, CWDM/DWDM, FTTX, and others), data rate (categorized by speed tiers), and application (data centers and telecommunications). Data center applications dominate the market share due to their increasing reliance on high-speed interconnectivity for efficient data processing and storage. The North American region currently holds a significant market share, followed by Asia-Pacific, driven by substantial investments in digital infrastructure and technological advancements in these regions. However, other regions, particularly in developing economies, show immense growth potential. Restraints to market growth include the high cost of advanced transceivers and the need for specialized expertise in deployment and maintenance.
Competitive dynamics are characterized by a mix of established players like Coherent Corp, Lumentum, Broadcom, and Fujitsu, alongside emerging players actively innovating to capture market share. The market is likely to witness increased consolidation and strategic partnerships to support the escalating demand for high-performance optical transceivers. Technological advancements, specifically in silicon photonics, are expected to further enhance the efficiency and affordability of these devices, opening up new opportunities in the years to come. The market's future hinges on the continuous evolution of data transmission technologies and the consistent growth of data-intensive applications globally. Maintaining a competitive edge will rely on continuous research and development, coupled with strategic market positioning to cater to the ever-changing needs of the industry.
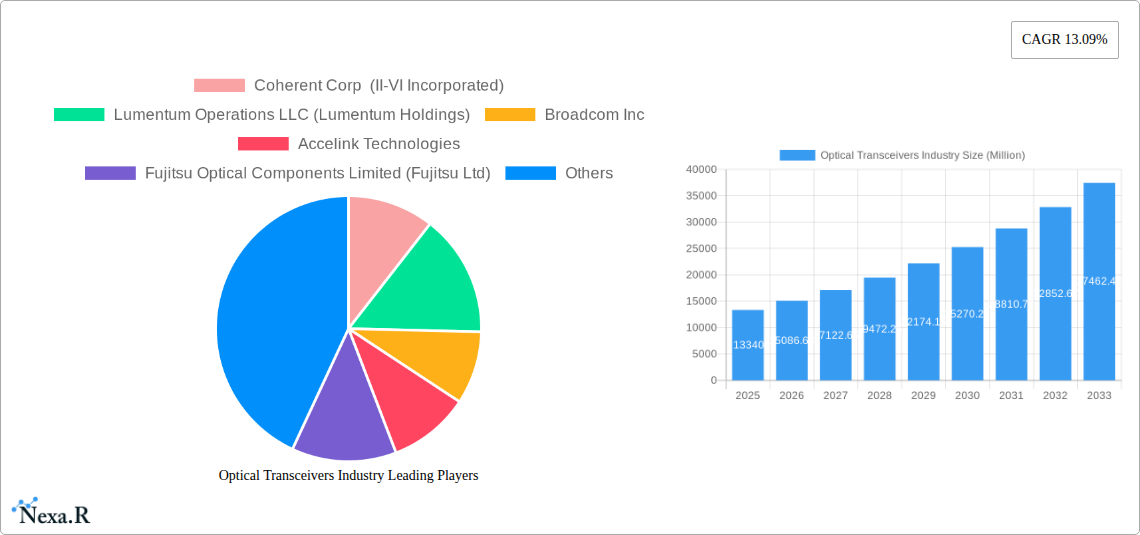
Optical Transceivers Industry Market Report: 2019-2033
This comprehensive report provides an in-depth analysis of the Optical Transceivers market, encompassing market dynamics, growth trends, regional dominance, product landscape, key players, and future outlook. The study period spans from 2019 to 2033, with 2025 serving as the base and estimated year. The report utilizes data from the historical period (2019-2024) and provides forecasts for 2025-2033. The market is segmented by protocol (Ethernet, Fiber Channel, CWDM/DWDM, FTTX, Other Protocols), data rate (Less than 10 Gbps, 10 Gbps to 40 Gbps, 100 Gbps, Greater than 100 Gbps), and application (Data Center, Telecommunication). Key players analyzed include Coherent Corp (II-VI Incorporated), Lumentum Operations LLC (Lumentum Holdings), Broadcom Inc, Accelink Technologies, Fujitsu Optical Components Limited (Fujitsu Ltd), Huawei Technologies Co Ltd, Source Photonics (Redview Capital), HUBER+SUHNER Cube Optics, Smiths Interconnect (Reflex Photonics Inc), and Sumitomo Electric Industries Ltd.
Optical Transceivers Industry Market Dynamics & Structure
The optical transceiver market is characterized by a moderately concentrated landscape with a few dominant players holding significant market share. Technological innovation, driven by the increasing demand for higher bandwidth and faster data transmission speeds, is a key driver. Regulatory frameworks, particularly those related to network infrastructure development and data security, influence market growth. Competitive substitutes, such as alternative transmission technologies, pose a challenge. End-user demographics, primarily driven by data center expansion and the growth of cloud computing, are a major determinant of market demand. M&A activity has been moderate, with xx major deals recorded between 2019 and 2024, primarily focused on strengthening technological capabilities and expanding market reach.
- Market Concentration: Moderately concentrated, with top 5 players holding approximately xx% market share in 2024.
- Technological Innovation: Driven by the need for higher data rates (400G, 800G, 1.6T) and improved power efficiency.
- Regulatory Frameworks: Government initiatives promoting digital infrastructure development influence market growth.
- Competitive Substitutes: Wireless communication technologies and other transmission methods pose indirect competition.
- End-User Demographics: Growth largely driven by data centers, cloud computing, and 5G telecommunications expansion.
- M&A Trends: xx major mergers and acquisitions observed between 2019 and 2024.
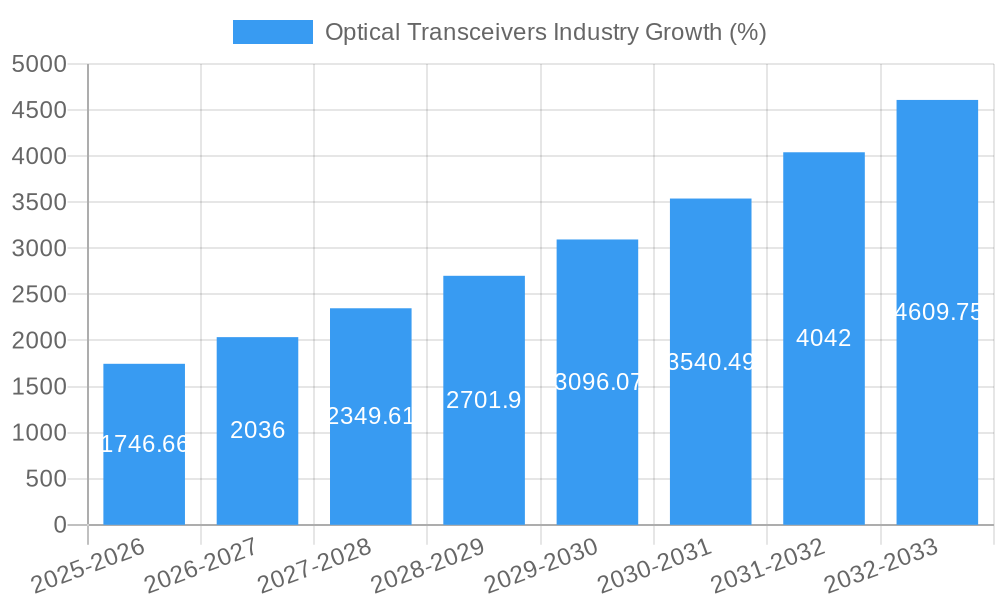
Optical Transceivers Industry Growth Trends & Insights
The optical transceiver market experienced significant growth during the historical period (2019-2024), with a Compound Annual Growth Rate (CAGR) of xx%. This growth is primarily attributed to the increasing adoption of high-speed data networks, driven by the proliferation of cloud computing, big data analytics, and the expansion of 5G networks. Technological disruptions, such as the introduction of coherent optical transceivers and advanced modulation formats, have significantly enhanced data transmission capabilities and contributed to market growth. Consumer behavior shifts toward increased data consumption and demand for higher bandwidth services have further fueled market expansion. The market is projected to maintain a strong growth trajectory throughout the forecast period (2025-2033), driven by continued advancements in technology and the expanding global demand for high-speed data transmission. Market penetration of 100Gbps and higher data rate transceivers is expected to increase from xx% in 2024 to xx% by 2033.
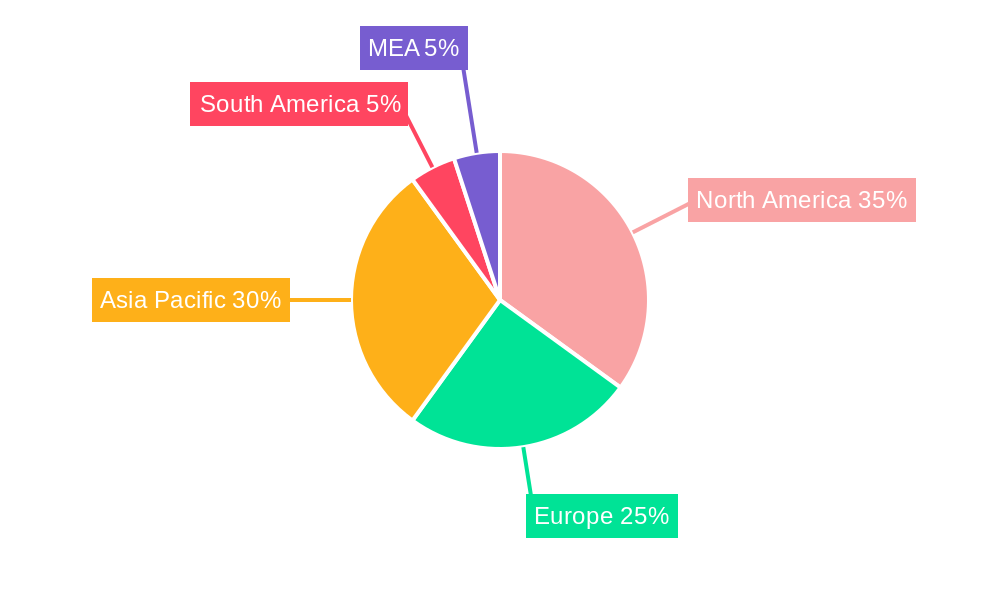
Dominant Regions, Countries, or Segments in Optical Transceivers Industry
North America and Asia-Pacific are currently the dominant regions in the optical transceiver market, driven by strong investments in data center infrastructure and the rapid expansion of 5G networks. Within these regions, countries like the United States, China, and Japan are major contributors to market growth.
By Protocol: The Ethernet segment holds the largest market share due to its widespread use in data centers and enterprise networks.
By Data Rate: The 100 Gbps and greater than 100 Gbps segments are experiencing the fastest growth rates, driven by the increasing demand for higher bandwidth applications.
By Application: The data center segment is the primary driver of market growth, fueled by the rapid expansion of cloud computing and the growth of hyperscale data centers.
- Key Drivers:
- Robust investments in data center infrastructure.
- Rapid deployment of 5G networks.
- Growing demand for high-speed data transmission.
- Favorable government policies and regulations.
- Dominance Factors: High concentration of data centers and telecommunication infrastructure.
Optical Transceivers Industry Product Landscape
The optical transceiver market offers a wide range of products with varying data rates, protocols, and form factors. Recent innovations include the development of higher-capacity transceivers (400G, 800G, and beyond) with enhanced power efficiency and improved reach. These advancements are driven by the increasing demand for higher bandwidth and lower latency in data center and telecommunication networks. Key selling propositions include increased data rates, reduced power consumption, and improved reliability. Technological advancements focus on coherent detection, advanced modulation formats, and integrated photonics.
Key Drivers, Barriers & Challenges in Optical Transceivers Industry
Key Drivers: The increasing demand for high-speed data transmission driven by the growth of cloud computing, big data analytics, and 5G networks is a primary driver. Advancements in optical technology, such as coherent detection and advanced modulation formats, are enabling higher data rates and longer transmission distances. Government initiatives promoting digital infrastructure development are also contributing to market growth.
Key Challenges: Competition from established and emerging players is intense. Supply chain disruptions and the availability of key components (e.g., lasers, photodetectors) can affect production capacity. Regulatory hurdles and compliance requirements can add complexity and cost to market entry. The high cost of advanced optical transceivers can limit adoption in certain applications.
Emerging Opportunities in Optical Transceivers Industry
Emerging opportunities include the increasing adoption of 800G and 1.6T technology in data centers, expansion into emerging markets with growing digital infrastructure needs, and the development of cost-effective transceivers for applications such as FTTx. Innovative applications in areas like automotive, industrial automation, and high-performance computing also present significant growth potential. The growing demand for low-latency connectivity will drive the adoption of shorter-reach optical transceivers optimized for specific applications.
Growth Accelerators in the Optical Transceivers Industry Industry
Technological advancements, particularly in coherent optical technology and silicon photonics, are key growth accelerators. Strategic partnerships between technology providers and network operators are facilitating faster adoption of new technologies. Expansion into emerging markets with developing digital infrastructure will create significant growth opportunities. The ongoing development of higher-speed transceivers will further stimulate market growth.
Key Players Shaping the Optical Transceivers Industry Market
- Coherent Corp (II-VI Incorporated)
- Lumentum Operations LLC (Lumentum Holdings)
- Broadcom Inc
- Accelink Technologies
- Fujitsu Optical Components Limited (Fujitsu Ltd)
- Huawei Technologies Co Ltd
- Source Photonics (Redview Capital)
- HUBER+SUHNER Cube Optics
- Smiths Interconnect (Reflex Photonics Inc)
- Sumitomo Electric Industries Ltd
Notable Milestones in Optical Transceivers Industry Sector
- October 2023: Broadcom and Semtech Corporation demonstrated a 200 G/lane optical transceiver at ECOC 2023.
- October 2023: II-VI Incorporated demonstrated next-generation transceivers and laser technology for 800 G and 1.6T datacom transmission at ECOC 2023.
In-Depth Optical Transceivers Industry Market Outlook
The optical transceiver market is poised for sustained growth over the next decade, driven by the relentless demand for higher bandwidth and lower latency in data communication networks. Continued innovation in coherent optical technology and silicon photonics will enable even higher data rates and more efficient transmission. Strategic partnerships and market expansion into new geographical regions will unlock further growth opportunities. The development of cost-effective and energy-efficient transceivers will drive wider adoption across diverse applications.
Optical Transceivers Industry Segmentation
-
1. Protocol
- 1.1. Ethernet
- 1.2. Fiber Channel
- 1.3. CWDM/DWDM
- 1.4. FTTX
- 1.5. Other Protocols
-
2. Data Rate
- 2.1. Less than 10 Gbps
- 2.2. 10 Gbps to 40 Gbps
- 2.3. 100 Gbps
- 2.4. Greater than 100 Gbps
-
3. Application
- 3.1. Data Center
- 3.2. Telecommunication
Optical Transceivers Industry Segmentation By Geography
- 1. North America
- 2. Europe
- 3. Asia
- 4. Australia and New Zealand
- 5. Latin America
- 6. Middle East and Africa
Optical Transceivers Industry REPORT HIGHLIGHTS
| Aspects | Details |
|---|---|
| Study Period | 2019-2033 |
| Base Year | 2024 |
| Estimated Year | 2025 |
| Forecast Period | 2025-2033 |
| Historical Period | 2019-2024 |
| Growth Rate | CAGR of 13.09% from 2019-2033 |
| Segmentation |
|
Table of Contents
- 1. Introduction
- 1.1. Research Scope
- 1.2. Market Segmentation
- 1.3. Research Methodology
- 1.4. Definitions and Assumptions
- 2. Executive Summary
- 2.1. Introduction
- 3. Market Dynamics
- 3.1. Introduction
- 3.2. Market Drivers
- 3.2.1. Increasing Need for Advanced Communication; Increasing Demand for Cloud-based Services
- 3.3. Market Restrains
- 3.3.1. Increase in Network Complexity
- 3.4. Market Trends
- 3.4.1. Data Centers to the Fastest Growing Application for Optical Transceivers
- 4. Market Factor Analysis
- 4.1. Porters Five Forces
- 4.2. Supply/Value Chain
- 4.3. PESTEL analysis
- 4.4. Market Entropy
- 4.5. Patent/Trademark Analysis
- 5. Global Optical Transceivers Industry Analysis, Insights and Forecast, 2019-2031
- 5.1. Market Analysis, Insights and Forecast - by Protocol
- 5.1.1. Ethernet
- 5.1.2. Fiber Channel
- 5.1.3. CWDM/DWDM
- 5.1.4. FTTX
- 5.1.5. Other Protocols
- 5.2. Market Analysis, Insights and Forecast - by Data Rate
- 5.2.1. Less than 10 Gbps
- 5.2.2. 10 Gbps to 40 Gbps
- 5.2.3. 100 Gbps
- 5.2.4. Greater than 100 Gbps
- 5.3. Market Analysis, Insights and Forecast - by Application
- 5.3.1. Data Center
- 5.3.2. Telecommunication
- 5.4. Market Analysis, Insights and Forecast - by Region
- 5.4.1. North America
- 5.4.2. Europe
- 5.4.3. Asia
- 5.4.4. Australia and New Zealand
- 5.4.5. Latin America
- 5.4.6. Middle East and Africa
- 5.1. Market Analysis, Insights and Forecast - by Protocol
- 6. North America Optical Transceivers Industry Analysis, Insights and Forecast, 2019-2031
- 6.1. Market Analysis, Insights and Forecast - by Protocol
- 6.1.1. Ethernet
- 6.1.2. Fiber Channel
- 6.1.3. CWDM/DWDM
- 6.1.4. FTTX
- 6.1.5. Other Protocols
- 6.2. Market Analysis, Insights and Forecast - by Data Rate
- 6.2.1. Less than 10 Gbps
- 6.2.2. 10 Gbps to 40 Gbps
- 6.2.3. 100 Gbps
- 6.2.4. Greater than 100 Gbps
- 6.3. Market Analysis, Insights and Forecast - by Application
- 6.3.1. Data Center
- 6.3.2. Telecommunication
- 6.1. Market Analysis, Insights and Forecast - by Protocol
- 7. Europe Optical Transceivers Industry Analysis, Insights and Forecast, 2019-2031
- 7.1. Market Analysis, Insights and Forecast - by Protocol
- 7.1.1. Ethernet
- 7.1.2. Fiber Channel
- 7.1.3. CWDM/DWDM
- 7.1.4. FTTX
- 7.1.5. Other Protocols
- 7.2. Market Analysis, Insights and Forecast - by Data Rate
- 7.2.1. Less than 10 Gbps
- 7.2.2. 10 Gbps to 40 Gbps
- 7.2.3. 100 Gbps
- 7.2.4. Greater than 100 Gbps
- 7.3. Market Analysis, Insights and Forecast - by Application
- 7.3.1. Data Center
- 7.3.2. Telecommunication
- 7.1. Market Analysis, Insights and Forecast - by Protocol
- 8. Asia Optical Transceivers Industry Analysis, Insights and Forecast, 2019-2031
- 8.1. Market Analysis, Insights and Forecast - by Protocol
- 8.1.1. Ethernet
- 8.1.2. Fiber Channel
- 8.1.3. CWDM/DWDM
- 8.1.4. FTTX
- 8.1.5. Other Protocols
- 8.2. Market Analysis, Insights and Forecast - by Data Rate
- 8.2.1. Less than 10 Gbps
- 8.2.2. 10 Gbps to 40 Gbps
- 8.2.3. 100 Gbps
- 8.2.4. Greater than 100 Gbps
- 8.3. Market Analysis, Insights and Forecast - by Application
- 8.3.1. Data Center
- 8.3.2. Telecommunication
- 8.1. Market Analysis, Insights and Forecast - by Protocol
- 9. Australia and New Zealand Optical Transceivers Industry Analysis, Insights and Forecast, 2019-2031
- 9.1. Market Analysis, Insights and Forecast - by Protocol
- 9.1.1. Ethernet
- 9.1.2. Fiber Channel
- 9.1.3. CWDM/DWDM
- 9.1.4. FTTX
- 9.1.5. Other Protocols
- 9.2. Market Analysis, Insights and Forecast - by Data Rate
- 9.2.1. Less than 10 Gbps
- 9.2.2. 10 Gbps to 40 Gbps
- 9.2.3. 100 Gbps
- 9.2.4. Greater than 100 Gbps
- 9.3. Market Analysis, Insights and Forecast - by Application
- 9.3.1. Data Center
- 9.3.2. Telecommunication
- 9.1. Market Analysis, Insights and Forecast - by Protocol
- 10. Latin America Optical Transceivers Industry Analysis, Insights and Forecast, 2019-2031
- 10.1. Market Analysis, Insights and Forecast - by Protocol
- 10.1.1. Ethernet
- 10.1.2. Fiber Channel
- 10.1.3. CWDM/DWDM
- 10.1.4. FTTX
- 10.1.5. Other Protocols
- 10.2. Market Analysis, Insights and Forecast - by Data Rate
- 10.2.1. Less than 10 Gbps
- 10.2.2. 10 Gbps to 40 Gbps
- 10.2.3. 100 Gbps
- 10.2.4. Greater than 100 Gbps
- 10.3. Market Analysis, Insights and Forecast - by Application
- 10.3.1. Data Center
- 10.3.2. Telecommunication
- 10.1. Market Analysis, Insights and Forecast - by Protocol
- 11. Middle East and Africa Optical Transceivers Industry Analysis, Insights and Forecast, 2019-2031
- 11.1. Market Analysis, Insights and Forecast - by Protocol
- 11.1.1. Ethernet
- 11.1.2. Fiber Channel
- 11.1.3. CWDM/DWDM
- 11.1.4. FTTX
- 11.1.5. Other Protocols
- 11.2. Market Analysis, Insights and Forecast - by Data Rate
- 11.2.1. Less than 10 Gbps
- 11.2.2. 10 Gbps to 40 Gbps
- 11.2.3. 100 Gbps
- 11.2.4. Greater than 100 Gbps
- 11.3. Market Analysis, Insights and Forecast - by Application
- 11.3.1. Data Center
- 11.3.2. Telecommunication
- 11.1. Market Analysis, Insights and Forecast - by Protocol
- 12. North America Optical Transceivers Industry Analysis, Insights and Forecast, 2019-2031
- 12.1. Market Analysis, Insights and Forecast - By Country/Sub-region
- 12.1.1 United States
- 12.1.2 Canada
- 12.1.3 Mexico
- 13. Europe Optical Transceivers Industry Analysis, Insights and Forecast, 2019-2031
- 13.1. Market Analysis, Insights and Forecast - By Country/Sub-region
- 13.1.1 Germany
- 13.1.2 United Kingdom
- 13.1.3 France
- 13.1.4 Spain
- 13.1.5 Italy
- 13.1.6 Spain
- 13.1.7 Belgium
- 13.1.8 Netherland
- 13.1.9 Nordics
- 13.1.10 Rest of Europe
- 14. Asia Pacific Optical Transceivers Industry Analysis, Insights and Forecast, 2019-2031
- 14.1. Market Analysis, Insights and Forecast - By Country/Sub-region
- 14.1.1 China
- 14.1.2 Japan
- 14.1.3 India
- 14.1.4 South Korea
- 14.1.5 Southeast Asia
- 14.1.6 Australia
- 14.1.7 Indonesia
- 14.1.8 Phillipes
- 14.1.9 Singapore
- 14.1.10 Thailandc
- 14.1.11 Rest of Asia Pacific
- 15. South America Optical Transceivers Industry Analysis, Insights and Forecast, 2019-2031
- 15.1. Market Analysis, Insights and Forecast - By Country/Sub-region
- 15.1.1 Brazil
- 15.1.2 Argentina
- 15.1.3 Peru
- 15.1.4 Chile
- 15.1.5 Colombia
- 15.1.6 Ecuador
- 15.1.7 Venezuela
- 15.1.8 Rest of South America
- 16. North America Optical Transceivers Industry Analysis, Insights and Forecast, 2019-2031
- 16.1. Market Analysis, Insights and Forecast - By Country/Sub-region
- 16.1.1 United States
- 16.1.2 Canada
- 16.1.3 Mexico
- 17. MEA Optical Transceivers Industry Analysis, Insights and Forecast, 2019-2031
- 17.1. Market Analysis, Insights and Forecast - By Country/Sub-region
- 17.1.1 United Arab Emirates
- 17.1.2 Saudi Arabia
- 17.1.3 South Africa
- 17.1.4 Rest of Middle East and Africa
- 18. Competitive Analysis
- 18.1. Global Market Share Analysis 2024
- 18.2. Company Profiles
- 18.2.1 Coherent Corp (II-VI Incorporated)
- 18.2.1.1. Overview
- 18.2.1.2. Products
- 18.2.1.3. SWOT Analysis
- 18.2.1.4. Recent Developments
- 18.2.1.5. Financials (Based on Availability)
- 18.2.2 Lumentum Operations LLC (Lumentum Holdings)
- 18.2.2.1. Overview
- 18.2.2.2. Products
- 18.2.2.3. SWOT Analysis
- 18.2.2.4. Recent Developments
- 18.2.2.5. Financials (Based on Availability)
- 18.2.3 Broadcom Inc
- 18.2.3.1. Overview
- 18.2.3.2. Products
- 18.2.3.3. SWOT Analysis
- 18.2.3.4. Recent Developments
- 18.2.3.5. Financials (Based on Availability)
- 18.2.4 Accelink Technologies
- 18.2.4.1. Overview
- 18.2.4.2. Products
- 18.2.4.3. SWOT Analysis
- 18.2.4.4. Recent Developments
- 18.2.4.5. Financials (Based on Availability)
- 18.2.5 Fujitsu Optical Components Limited (Fujitsu Ltd)
- 18.2.5.1. Overview
- 18.2.5.2. Products
- 18.2.5.3. SWOT Analysis
- 18.2.5.4. Recent Developments
- 18.2.5.5. Financials (Based on Availability)
- 18.2.6 Huawei Technologies Co Ltd
- 18.2.6.1. Overview
- 18.2.6.2. Products
- 18.2.6.3. SWOT Analysis
- 18.2.6.4. Recent Developments
- 18.2.6.5. Financials (Based on Availability)
- 18.2.7 Source Photonics (Redview Capital)
- 18.2.7.1. Overview
- 18.2.7.2. Products
- 18.2.7.3. SWOT Analysis
- 18.2.7.4. Recent Developments
- 18.2.7.5. Financials (Based on Availability)
- 18.2.8 HUBER+SUHNER Cube Optics
- 18.2.8.1. Overview
- 18.2.8.2. Products
- 18.2.8.3. SWOT Analysis
- 18.2.8.4. Recent Developments
- 18.2.8.5. Financials (Based on Availability)
- 18.2.9 Smiths Interconnect (Reflex Photonics Inc )
- 18.2.9.1. Overview
- 18.2.9.2. Products
- 18.2.9.3. SWOT Analysis
- 18.2.9.4. Recent Developments
- 18.2.9.5. Financials (Based on Availability)
- 18.2.10 Sumitomo Electric Industries Ltd
- 18.2.10.1. Overview
- 18.2.10.2. Products
- 18.2.10.3. SWOT Analysis
- 18.2.10.4. Recent Developments
- 18.2.10.5. Financials (Based on Availability)
- 18.2.1 Coherent Corp (II-VI Incorporated)
List of Figures
- Figure 1: Global Optical Transceivers Industry Revenue Breakdown (Million, %) by Region 2024 & 2032
- Figure 2: North America Optical Transceivers Industry Revenue (Million), by Country 2024 & 2032
- Figure 3: North America Optical Transceivers Industry Revenue Share (%), by Country 2024 & 2032
- Figure 4: Europe Optical Transceivers Industry Revenue (Million), by Country 2024 & 2032
- Figure 5: Europe Optical Transceivers Industry Revenue Share (%), by Country 2024 & 2032
- Figure 6: Asia Pacific Optical Transceivers Industry Revenue (Million), by Country 2024 & 2032
- Figure 7: Asia Pacific Optical Transceivers Industry Revenue Share (%), by Country 2024 & 2032
- Figure 8: South America Optical Transceivers Industry Revenue (Million), by Country 2024 & 2032
- Figure 9: South America Optical Transceivers Industry Revenue Share (%), by Country 2024 & 2032
- Figure 10: North America Optical Transceivers Industry Revenue (Million), by Country 2024 & 2032
- Figure 11: North America Optical Transceivers Industry Revenue Share (%), by Country 2024 & 2032
- Figure 12: MEA Optical Transceivers Industry Revenue (Million), by Country 2024 & 2032
- Figure 13: MEA Optical Transceivers Industry Revenue Share (%), by Country 2024 & 2032
- Figure 14: North America Optical Transceivers Industry Revenue (Million), by Protocol 2024 & 2032
- Figure 15: North America Optical Transceivers Industry Revenue Share (%), by Protocol 2024 & 2032
- Figure 16: North America Optical Transceivers Industry Revenue (Million), by Data Rate 2024 & 2032
- Figure 17: North America Optical Transceivers Industry Revenue Share (%), by Data Rate 2024 & 2032
- Figure 18: North America Optical Transceivers Industry Revenue (Million), by Application 2024 & 2032
- Figure 19: North America Optical Transceivers Industry Revenue Share (%), by Application 2024 & 2032
- Figure 20: North America Optical Transceivers Industry Revenue (Million), by Country 2024 & 2032
- Figure 21: North America Optical Transceivers Industry Revenue Share (%), by Country 2024 & 2032
- Figure 22: Europe Optical Transceivers Industry Revenue (Million), by Protocol 2024 & 2032
- Figure 23: Europe Optical Transceivers Industry Revenue Share (%), by Protocol 2024 & 2032
- Figure 24: Europe Optical Transceivers Industry Revenue (Million), by Data Rate 2024 & 2032
- Figure 25: Europe Optical Transceivers Industry Revenue Share (%), by Data Rate 2024 & 2032
- Figure 26: Europe Optical Transceivers Industry Revenue (Million), by Application 2024 & 2032
- Figure 27: Europe Optical Transceivers Industry Revenue Share (%), by Application 2024 & 2032
- Figure 28: Europe Optical Transceivers Industry Revenue (Million), by Country 2024 & 2032
- Figure 29: Europe Optical Transceivers Industry Revenue Share (%), by Country 2024 & 2032
- Figure 30: Asia Optical Transceivers Industry Revenue (Million), by Protocol 2024 & 2032
- Figure 31: Asia Optical Transceivers Industry Revenue Share (%), by Protocol 2024 & 2032
- Figure 32: Asia Optical Transceivers Industry Revenue (Million), by Data Rate 2024 & 2032
- Figure 33: Asia Optical Transceivers Industry Revenue Share (%), by Data Rate 2024 & 2032
- Figure 34: Asia Optical Transceivers Industry Revenue (Million), by Application 2024 & 2032
- Figure 35: Asia Optical Transceivers Industry Revenue Share (%), by Application 2024 & 2032
- Figure 36: Asia Optical Transceivers Industry Revenue (Million), by Country 2024 & 2032
- Figure 37: Asia Optical Transceivers Industry Revenue Share (%), by Country 2024 & 2032
- Figure 38: Australia and New Zealand Optical Transceivers Industry Revenue (Million), by Protocol 2024 & 2032
- Figure 39: Australia and New Zealand Optical Transceivers Industry Revenue Share (%), by Protocol 2024 & 2032
- Figure 40: Australia and New Zealand Optical Transceivers Industry Revenue (Million), by Data Rate 2024 & 2032
- Figure 41: Australia and New Zealand Optical Transceivers Industry Revenue Share (%), by Data Rate 2024 & 2032
- Figure 42: Australia and New Zealand Optical Transceivers Industry Revenue (Million), by Application 2024 & 2032
- Figure 43: Australia and New Zealand Optical Transceivers Industry Revenue Share (%), by Application 2024 & 2032
- Figure 44: Australia and New Zealand Optical Transceivers Industry Revenue (Million), by Country 2024 & 2032
- Figure 45: Australia and New Zealand Optical Transceivers Industry Revenue Share (%), by Country 2024 & 2032
- Figure 46: Latin America Optical Transceivers Industry Revenue (Million), by Protocol 2024 & 2032
- Figure 47: Latin America Optical Transceivers Industry Revenue Share (%), by Protocol 2024 & 2032
- Figure 48: Latin America Optical Transceivers Industry Revenue (Million), by Data Rate 2024 & 2032
- Figure 49: Latin America Optical Transceivers Industry Revenue Share (%), by Data Rate 2024 & 2032
- Figure 50: Latin America Optical Transceivers Industry Revenue (Million), by Application 2024 & 2032
- Figure 51: Latin America Optical Transceivers Industry Revenue Share (%), by Application 2024 & 2032
- Figure 52: Latin America Optical Transceivers Industry Revenue (Million), by Country 2024 & 2032
- Figure 53: Latin America Optical Transceivers Industry Revenue Share (%), by Country 2024 & 2032
- Figure 54: Middle East and Africa Optical Transceivers Industry Revenue (Million), by Protocol 2024 & 2032
- Figure 55: Middle East and Africa Optical Transceivers Industry Revenue Share (%), by Protocol 2024 & 2032
- Figure 56: Middle East and Africa Optical Transceivers Industry Revenue (Million), by Data Rate 2024 & 2032
- Figure 57: Middle East and Africa Optical Transceivers Industry Revenue Share (%), by Data Rate 2024 & 2032
- Figure 58: Middle East and Africa Optical Transceivers Industry Revenue (Million), by Application 2024 & 2032
- Figure 59: Middle East and Africa Optical Transceivers Industry Revenue Share (%), by Application 2024 & 2032
- Figure 60: Middle East and Africa Optical Transceivers Industry Revenue (Million), by Country 2024 & 2032
- Figure 61: Middle East and Africa Optical Transceivers Industry Revenue Share (%), by Country 2024 & 2032
List of Tables
- Table 1: Global Optical Transceivers Industry Revenue Million Forecast, by Region 2019 & 2032
- Table 2: Global Optical Transceivers Industry Revenue Million Forecast, by Protocol 2019 & 2032
- Table 3: Global Optical Transceivers Industry Revenue Million Forecast, by Data Rate 2019 & 2032
- Table 4: Global Optical Transceivers Industry Revenue Million Forecast, by Application 2019 & 2032
- Table 5: Global Optical Transceivers Industry Revenue Million Forecast, by Region 2019 & 2032
- Table 6: Global Optical Transceivers Industry Revenue Million Forecast, by Country 2019 & 2032
- Table 7: United States Optical Transceivers Industry Revenue (Million) Forecast, by Application 2019 & 2032
- Table 8: Canada Optical Transceivers Industry Revenue (Million) Forecast, by Application 2019 & 2032
- Table 9: Mexico Optical Transceivers Industry Revenue (Million) Forecast, by Application 2019 & 2032
- Table 10: Global Optical Transceivers Industry Revenue Million Forecast, by Country 2019 & 2032
- Table 11: Germany Optical Transceivers Industry Revenue (Million) Forecast, by Application 2019 & 2032
- Table 12: United Kingdom Optical Transceivers Industry Revenue (Million) Forecast, by Application 2019 & 2032
- Table 13: France Optical Transceivers Industry Revenue (Million) Forecast, by Application 2019 & 2032
- Table 14: Spain Optical Transceivers Industry Revenue (Million) Forecast, by Application 2019 & 2032
- Table 15: Italy Optical Transceivers Industry Revenue (Million) Forecast, by Application 2019 & 2032
- Table 16: Spain Optical Transceivers Industry Revenue (Million) Forecast, by Application 2019 & 2032
- Table 17: Belgium Optical Transceivers Industry Revenue (Million) Forecast, by Application 2019 & 2032
- Table 18: Netherland Optical Transceivers Industry Revenue (Million) Forecast, by Application 2019 & 2032
- Table 19: Nordics Optical Transceivers Industry Revenue (Million) Forecast, by Application 2019 & 2032
- Table 20: Rest of Europe Optical Transceivers Industry Revenue (Million) Forecast, by Application 2019 & 2032
- Table 21: Global Optical Transceivers Industry Revenue Million Forecast, by Country 2019 & 2032
- Table 22: China Optical Transceivers Industry Revenue (Million) Forecast, by Application 2019 & 2032
- Table 23: Japan Optical Transceivers Industry Revenue (Million) Forecast, by Application 2019 & 2032
- Table 24: India Optical Transceivers Industry Revenue (Million) Forecast, by Application 2019 & 2032
- Table 25: South Korea Optical Transceivers Industry Revenue (Million) Forecast, by Application 2019 & 2032
- Table 26: Southeast Asia Optical Transceivers Industry Revenue (Million) Forecast, by Application 2019 & 2032
- Table 27: Australia Optical Transceivers Industry Revenue (Million) Forecast, by Application 2019 & 2032
- Table 28: Indonesia Optical Transceivers Industry Revenue (Million) Forecast, by Application 2019 & 2032
- Table 29: Phillipes Optical Transceivers Industry Revenue (Million) Forecast, by Application 2019 & 2032
- Table 30: Singapore Optical Transceivers Industry Revenue (Million) Forecast, by Application 2019 & 2032
- Table 31: Thailandc Optical Transceivers Industry Revenue (Million) Forecast, by Application 2019 & 2032
- Table 32: Rest of Asia Pacific Optical Transceivers Industry Revenue (Million) Forecast, by Application 2019 & 2032
- Table 33: Global Optical Transceivers Industry Revenue Million Forecast, by Country 2019 & 2032
- Table 34: Brazil Optical Transceivers Industry Revenue (Million) Forecast, by Application 2019 & 2032
- Table 35: Argentina Optical Transceivers Industry Revenue (Million) Forecast, by Application 2019 & 2032
- Table 36: Peru Optical Transceivers Industry Revenue (Million) Forecast, by Application 2019 & 2032
- Table 37: Chile Optical Transceivers Industry Revenue (Million) Forecast, by Application 2019 & 2032
- Table 38: Colombia Optical Transceivers Industry Revenue (Million) Forecast, by Application 2019 & 2032
- Table 39: Ecuador Optical Transceivers Industry Revenue (Million) Forecast, by Application 2019 & 2032
- Table 40: Venezuela Optical Transceivers Industry Revenue (Million) Forecast, by Application 2019 & 2032
- Table 41: Rest of South America Optical Transceivers Industry Revenue (Million) Forecast, by Application 2019 & 2032
- Table 42: Global Optical Transceivers Industry Revenue Million Forecast, by Country 2019 & 2032
- Table 43: United States Optical Transceivers Industry Revenue (Million) Forecast, by Application 2019 & 2032
- Table 44: Canada Optical Transceivers Industry Revenue (Million) Forecast, by Application 2019 & 2032
- Table 45: Mexico Optical Transceivers Industry Revenue (Million) Forecast, by Application 2019 & 2032
- Table 46: Global Optical Transceivers Industry Revenue Million Forecast, by Country 2019 & 2032
- Table 47: United Arab Emirates Optical Transceivers Industry Revenue (Million) Forecast, by Application 2019 & 2032
- Table 48: Saudi Arabia Optical Transceivers Industry Revenue (Million) Forecast, by Application 2019 & 2032
- Table 49: South Africa Optical Transceivers Industry Revenue (Million) Forecast, by Application 2019 & 2032
- Table 50: Rest of Middle East and Africa Optical Transceivers Industry Revenue (Million) Forecast, by Application 2019 & 2032
- Table 51: Global Optical Transceivers Industry Revenue Million Forecast, by Protocol 2019 & 2032
- Table 52: Global Optical Transceivers Industry Revenue Million Forecast, by Data Rate 2019 & 2032
- Table 53: Global Optical Transceivers Industry Revenue Million Forecast, by Application 2019 & 2032
- Table 54: Global Optical Transceivers Industry Revenue Million Forecast, by Country 2019 & 2032
- Table 55: Global Optical Transceivers Industry Revenue Million Forecast, by Protocol 2019 & 2032
- Table 56: Global Optical Transceivers Industry Revenue Million Forecast, by Data Rate 2019 & 2032
- Table 57: Global Optical Transceivers Industry Revenue Million Forecast, by Application 2019 & 2032
- Table 58: Global Optical Transceivers Industry Revenue Million Forecast, by Country 2019 & 2032
- Table 59: Global Optical Transceivers Industry Revenue Million Forecast, by Protocol 2019 & 2032
- Table 60: Global Optical Transceivers Industry Revenue Million Forecast, by Data Rate 2019 & 2032
- Table 61: Global Optical Transceivers Industry Revenue Million Forecast, by Application 2019 & 2032
- Table 62: Global Optical Transceivers Industry Revenue Million Forecast, by Country 2019 & 2032
- Table 63: Global Optical Transceivers Industry Revenue Million Forecast, by Protocol 2019 & 2032
- Table 64: Global Optical Transceivers Industry Revenue Million Forecast, by Data Rate 2019 & 2032
- Table 65: Global Optical Transceivers Industry Revenue Million Forecast, by Application 2019 & 2032
- Table 66: Global Optical Transceivers Industry Revenue Million Forecast, by Country 2019 & 2032
- Table 67: Global Optical Transceivers Industry Revenue Million Forecast, by Protocol 2019 & 2032
- Table 68: Global Optical Transceivers Industry Revenue Million Forecast, by Data Rate 2019 & 2032
- Table 69: Global Optical Transceivers Industry Revenue Million Forecast, by Application 2019 & 2032
- Table 70: Global Optical Transceivers Industry Revenue Million Forecast, by Country 2019 & 2032
- Table 71: Global Optical Transceivers Industry Revenue Million Forecast, by Protocol 2019 & 2032
- Table 72: Global Optical Transceivers Industry Revenue Million Forecast, by Data Rate 2019 & 2032
- Table 73: Global Optical Transceivers Industry Revenue Million Forecast, by Application 2019 & 2032
- Table 74: Global Optical Transceivers Industry Revenue Million Forecast, by Country 2019 & 2032
Frequently Asked Questions
1. What is the projected Compound Annual Growth Rate (CAGR) of the Optical Transceivers Industry?
The projected CAGR is approximately 13.09%.
2. Which companies are prominent players in the Optical Transceivers Industry?
Key companies in the market include Coherent Corp (II-VI Incorporated), Lumentum Operations LLC (Lumentum Holdings), Broadcom Inc, Accelink Technologies, Fujitsu Optical Components Limited (Fujitsu Ltd), Huawei Technologies Co Ltd, Source Photonics (Redview Capital), HUBER+SUHNER Cube Optics, Smiths Interconnect (Reflex Photonics Inc ), Sumitomo Electric Industries Ltd.
3. What are the main segments of the Optical Transceivers Industry?
The market segments include Protocol, Data Rate, Application.
4. Can you provide details about the market size?
The market size is estimated to be USD 13.34 Million as of 2022.
5. What are some drivers contributing to market growth?
Increasing Need for Advanced Communication; Increasing Demand for Cloud-based Services.
6. What are the notable trends driving market growth?
Data Centers to the Fastest Growing Application for Optical Transceivers.
7. Are there any restraints impacting market growth?
Increase in Network Complexity.
8. Can you provide examples of recent developments in the market?
October 2023: Broadcom and Semtech Corporation announced the demonstration of a 200 G/lane optical transceiver at the ECOC 2023, featuring Semtech’s latest Fiberdge 200 G PAM4 PMDs and Broadcom’s latest generation DSP PHY and single-mode optics.
9. What pricing options are available for accessing the report?
Pricing options include single-user, multi-user, and enterprise licenses priced at USD 4750, USD 5250, and USD 8750 respectively.
10. Is the market size provided in terms of value or volume?
The market size is provided in terms of value, measured in Million.
11. Are there any specific market keywords associated with the report?
Yes, the market keyword associated with the report is "Optical Transceivers Industry," which aids in identifying and referencing the specific market segment covered.
12. How do I determine which pricing option suits my needs best?
The pricing options vary based on user requirements and access needs. Individual users may opt for single-user licenses, while businesses requiring broader access may choose multi-user or enterprise licenses for cost-effective access to the report.
13. Are there any additional resources or data provided in the Optical Transceivers Industry report?
While the report offers comprehensive insights, it's advisable to review the specific contents or supplementary materials provided to ascertain if additional resources or data are available.
14. How can I stay updated on further developments or reports in the Optical Transceivers Industry?
To stay informed about further developments, trends, and reports in the Optical Transceivers Industry, consider subscribing to industry newsletters, following relevant companies and organizations, or regularly checking reputable industry news sources and publications.
Methodology
Step 1 - Identification of Relevant Samples Size from Population Database


Step 2 - Approaches for Defining Global Market Size (Value, Volume* & Price*)

Note*: In applicable scenarios
Step 3 - Data Sources
Primary Research
- Web Analytics
- Survey Reports
- Research Institute
- Latest Research Reports
- Opinion Leaders
Secondary Research
- Annual Reports
- White Paper
- Latest Press Release
- Industry Association
- Paid Database
- Investor Presentations

Step 4 - Data Triangulation
Involves using different sources of information in order to increase the validity of a study
These sources are likely to be stakeholders in a program - participants, other researchers, program staff, other community members, and so on.
Then we put all data in single framework & apply various statistical tools to find out the dynamic on the market.
During the analysis stage, feedback from the stakeholder groups would be compared to determine areas of agreement as well as areas of divergence
