

Key Insights
The global aluminum aerosol can packaging market is poised for significant expansion, propelled by the escalating demand for convenient, lightweight, and sustainable packaging solutions across diverse sectors. With a projected market size of $7.72 billion in the base year 2025, the market is anticipated to grow at a Compound Annual Growth Rate (CAGR) of 4.62% between 2025 and 2033, reaching an estimated value of $15 billion by 2033. This robust growth is attributed to several key drivers: the increasing adoption of aerosol products in personal care, pharmaceuticals, and food and beverages; the inherent sustainability benefits of aluminum, including high recyclability and excellent barrier properties, which align with rising consumer demand for eco-friendly options; and ongoing advancements in can design and manufacturing technologies, enhancing functionality and aesthetic appeal. Leading companies such as Ball Corporation, Trivium Packaging, and CCL Containers are actively shaping the market through strategic collaborations, acquisitions, and capacity enhancements. However, market expansion may be influenced by volatile aluminum prices and the growing availability of alternative packaging materials.
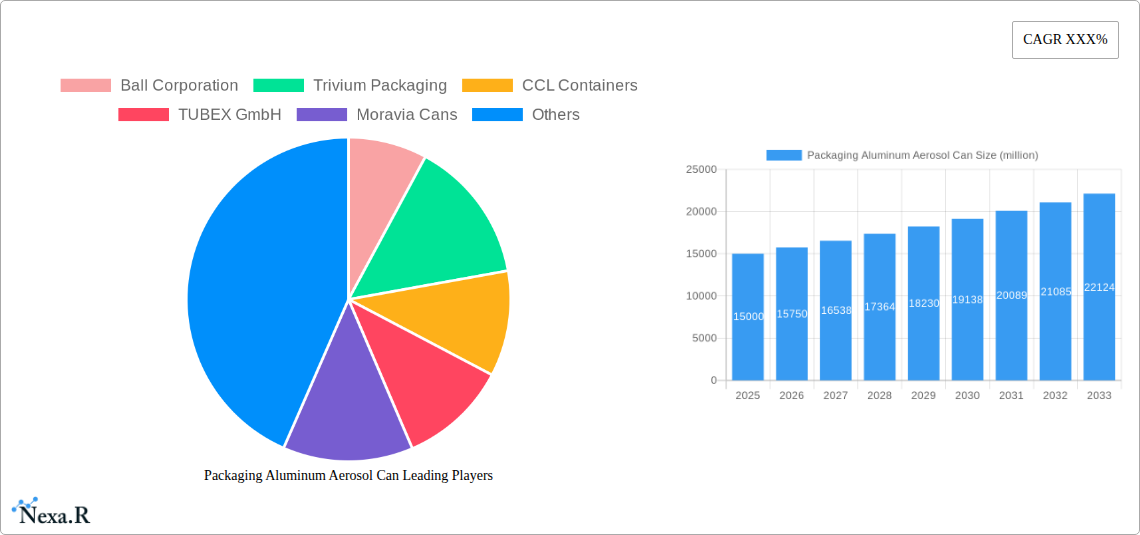
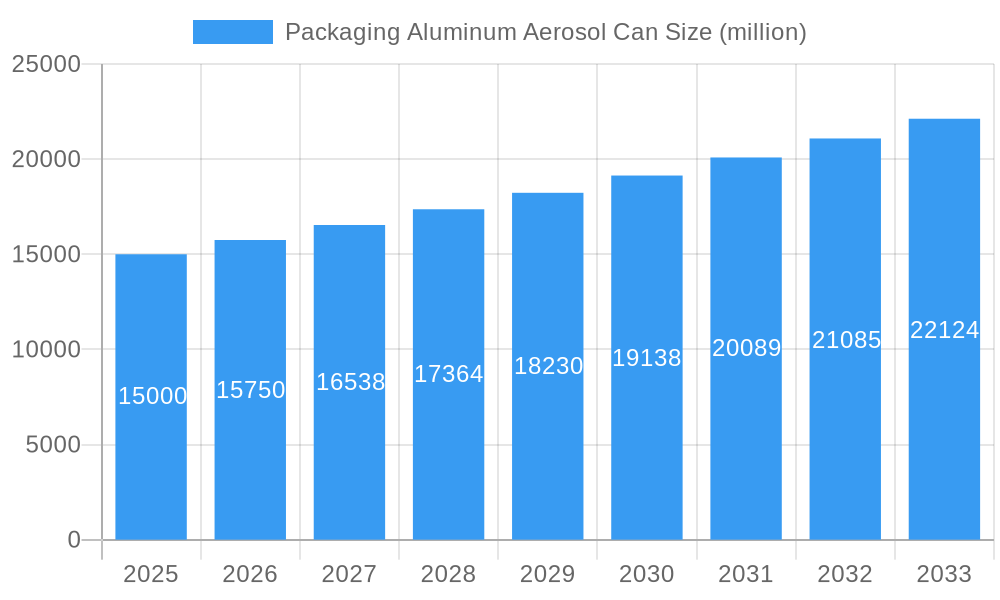
Packaging Aluminum Aerosol Can Market Size (In Billion)
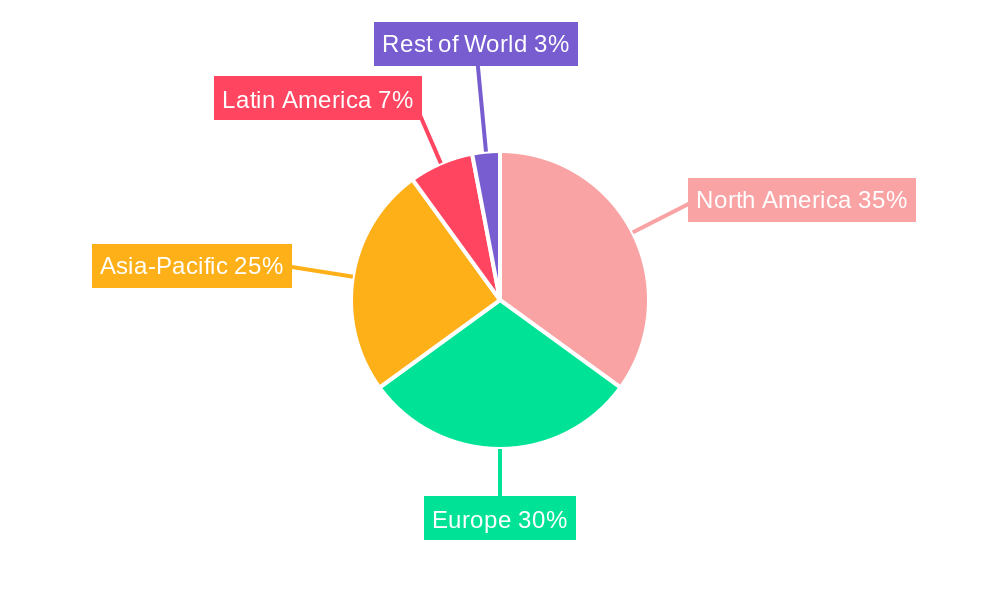
Geographically, North America and Europe currently dominate market share due to established manufacturing capabilities and high consumption levels. Conversely, emerging economies in the Asia-Pacific and Latin America regions exhibit substantial growth potential, driven by expanding consumer bases and the increasing adoption of aerosol products. Segmentation analysis reveals a dynamic market landscape characterized by variations in can size, material composition, and end-use applications. The growing demand for bespoke packaging solutions and specialized coatings, aimed at improving product protection and extending shelf life, further contributes to market vitality. The forecast period indicates a sustained upward trajectory, suggesting continued market attractiveness for both established and emerging players. Success in this evolving market will hinge on embracing sustainable manufacturing practices, adapting to shifting consumer preferences, and adhering to rigorous regulatory standards.
Packaging Aluminum Aerosol Can Company Market Share
Packaging Aluminum Aerosol Can Market Report: 2019-2033
This comprehensive report provides a detailed analysis of the global Packaging Aluminum Aerosol Can market, offering invaluable insights for industry professionals, investors, and strategic decision-makers. The study covers the period from 2019 to 2033, with a focus on the forecast period of 2025-2033 and a base year of 2025. The report meticulously examines market dynamics, growth trends, regional dominance, product landscapes, and key players, providing a 360-degree view of this dynamic sector. Expected market size in 2025 is xx million units.
Packaging Aluminum Aerosol Can Market Dynamics & Structure
The global Packaging Aluminum Aerosol Can market is characterized by a moderately consolidated structure, with key players holding significant market share. Ball Corporation, Trivium Packaging, and CCL Containers are prominent examples, together accounting for an estimated xx% of the market in 2025. However, the presence of numerous smaller regional players ensures a dynamic competitive landscape. Technological innovation is a significant driver, with ongoing research into lighter, more sustainable, and functional aluminum alloys. Regulatory frameworks, particularly those concerning recyclability and environmental impact, are increasingly influencing market trends. The market also faces competitive pressure from alternative packaging materials like plastic and glass, though aluminum's inherent advantages in terms of barrier properties and recyclability continue to support its dominance in certain applications. M&A activity has been moderate in recent years, with xx major deals recorded between 2019 and 2024, primarily focused on expanding geographic reach and enhancing product portfolios.
- Market Concentration: Moderately consolidated, with top three players holding xx% market share (2025).
- Technological Innovation: Focus on lightweighting, sustainability, and enhanced functionality.
- Regulatory Landscape: Increasing emphasis on recyclability and environmental impact.
- Competitive Substitutes: Plastic and glass packaging pose challenges.
- M&A Activity: xx major deals between 2019 and 2024, primarily for expansion and portfolio diversification.
- End-User Demographics: Growth driven by demand in personal care, food, and household products.
Packaging Aluminum Aerosol Can Growth Trends & Insights
The Packaging Aluminum Aerosol Can market witnessed a CAGR of xx% during the historical period (2019-2024) and is projected to maintain a CAGR of xx% during the forecast period (2025-2033). This growth is fueled by several key factors, including increasing demand for convenient and portable packaging in diverse end-use sectors. The rising adoption of aerosol products in personal care, pharmaceuticals, and food industries directly contributes to market expansion. Technological advancements in can manufacturing, resulting in improved durability, reduced weight, and enhanced designs, further stimulate market growth. Consumer preferences are also shifting towards sustainable packaging solutions, boosting the demand for recyclable aluminum cans. Market penetration in developing economies is also projected to rise significantly, particularly in regions with expanding middle classes and increasing disposable incomes. Disruptions in the supply chain due to global events have also been factored into this analysis and are expected to influence overall market growth.
Dominant Regions, Countries, or Segments in Packaging Aluminum Aerosol Can
North America and Europe currently dominate the Packaging Aluminum Aerosol Can market, driven by high per capita consumption of aerosol products and well-established recycling infrastructure. However, Asia-Pacific is emerging as a high-growth region, with significant increases in demand from countries like China and India, propelled by rapid economic expansion and increasing urbanization. Within the segments, personal care and household products contribute the largest share of the market, accounting for an estimated xx million units in 2025.
- North America: Strong demand, established recycling infrastructure.
- Europe: Mature market with high per capita consumption.
- Asia-Pacific: High growth potential, driven by rising disposable incomes and urbanization.
- Personal Care: Largest segment by volume (xx million units in 2025).
- Household Products: Significant market share.
Packaging Aluminum Aerosol Can Product Landscape
The Packaging Aluminum Aerosol Can market offers a diverse range of products, differing in size, shape, material composition, and surface finish. Innovations focus on lightweighting to reduce material costs and carbon footprint, improved barrier properties to enhance product shelf life, and enhanced printing techniques for improved aesthetics and branding. Many manufacturers offer customized solutions, tailored to specific client needs and product characteristics. Unique selling propositions include superior recyclability, excellent barrier properties, and the ability to withstand high pressures. Technological advancements include the use of thinner aluminum gauges and innovative coatings to minimize material usage while maintaining structural integrity.
Key Drivers, Barriers & Challenges in Packaging Aluminum Aerosol Can
Key Drivers: The increasing demand for convenient and portable packaging across various end-use industries is a major growth driver. Consumer preference for sustainable and recyclable packaging solutions further fuels market expansion. Technological advancements leading to improved can designs and manufacturing processes contribute significantly to growth.
Key Challenges: Fluctuations in raw material prices (aluminum) and potential disruptions in the global supply chain pose significant challenges. Stringent environmental regulations and the need for sustainable solutions add complexity to the manufacturing process. Intense competition from alternative packaging materials and the need for continuous innovation to maintain a competitive edge further challenge market players.
Emerging Opportunities in Packaging Aluminum Aerosol Can
Emerging opportunities lie in untapped markets within developing economies, as well as in innovative applications of aluminum aerosol cans in new product categories. The growing demand for sustainable packaging solutions presents opportunities for manufacturers to offer eco-friendly cans made from recycled aluminum. Furthermore, advancements in printing and decoration techniques allow for enhanced brand customization, driving innovation in the market. The development of specialized cans for niche applications will also lead to considerable expansion in market growth.
Growth Accelerators in the Packaging Aluminum Aerosol Can Industry
Technological advancements in can manufacturing, such as lightweighting and improved barrier properties, drive significant growth. Strategic partnerships between manufacturers and brand owners can ensure wider adoption of aluminum cans, accelerating market expansion. Expansion into new geographical markets with emerging demand for aerosol products will further fuel industry growth.
Key Players Shaping the Packaging Aluminum Aerosol Can Market
- Ball Corporation
- Trivium Packaging
- CCL Containers
- TUBEX GmbH
- Moravia Cans
- LINHARDT
- ALLTUB
- ALUCON
- Jamestrong
- Aryum
- Bispharma
- Gulf Cans Industries
- Euro Asia Packaging
- Bharat Containers
- Montebello Packaging
- Condensa
Notable Milestones in Packaging Aluminum Aerosol Can Sector
- 2021: Ball Corporation launched a new line of lightweight aluminum aerosol cans.
- 2022: Trivium Packaging invested in a new state-of-the-art can manufacturing facility.
- 2023: CCL Containers announced a strategic partnership with a major personal care brand.
- 2024: Several mergers and acquisitions occurred amongst smaller players, consolidating the market. (Specific details on M&A activity would be included in the full report).
In-Depth Packaging Aluminum Aerosol Can Market Outlook
The Packaging Aluminum Aerosol Can market is poised for robust growth over the forecast period, driven by a combination of factors including the rising popularity of aerosol products across diverse end-use segments and the increasing demand for sustainable packaging. Continued technological advancements, strategic collaborations within the industry, and expansion into new markets will collectively accelerate market expansion and present lucrative opportunities for existing and new players in the coming years. The global shift towards eco-conscious consumption further bolsters the prospects for aluminum cans, which offer superior recyclability compared to other packaging options.
Packaging Aluminum Aerosol Can Segmentation
-
1. Application
- 1.1. Cosmetics & Personal Care
- 1.2. Household Products
- 1.3. Medical and Medicine
- 1.4. Others
-
2. Type
- 2.1. Less than 200ml
- 2.2. 200ml-500ml
- 2.3. More than 500ml
Packaging Aluminum Aerosol Can Segmentation By Geography
-
1. North America
- 1.1. United States
- 1.2. Canada
- 1.3. Mexico
-
2. South America
- 2.1. Brazil
- 2.2. Argentina
- 2.3. Rest of South America
-
3. Europe
- 3.1. United Kingdom
- 3.2. Germany
- 3.3. France
- 3.4. Italy
- 3.5. Spain
- 3.6. Russia
- 3.7. Benelux
- 3.8. Nordics
- 3.9. Rest of Europe
-
4. Middle East & Africa
- 4.1. Turkey
- 4.2. Israel
- 4.3. GCC
- 4.4. North Africa
- 4.5. South Africa
- 4.6. Rest of Middle East & Africa
-
5. Asia Pacific
- 5.1. China
- 5.2. India
- 5.3. Japan
- 5.4. South Korea
- 5.5. ASEAN
- 5.6. Oceania
- 5.7. Rest of Asia Pacific
Packaging Aluminum Aerosol Can Regional Market Share
Geographic Coverage of Packaging Aluminum Aerosol Can
Packaging Aluminum Aerosol Can REPORT HIGHLIGHTS
| Aspects | Details |
|---|---|
| Study Period | 2020-2034 |
| Base Year | 2025 |
| Estimated Year | 2026 |
| Forecast Period | 2026-2034 |
| Historical Period | 2020-2025 |
| Growth Rate | CAGR of 4.62% from 2020-2034 |
| Segmentation |
|
Table of Contents
- 1. Introduction
- 1.1. Research Scope
- 1.2. Market Segmentation
- 1.3. Research Methodology
- 1.4. Definitions and Assumptions
- 2. Executive Summary
- 2.1. Introduction
- 3. Market Dynamics
- 3.1. Introduction
- 3.2. Market Drivers
- 3.3. Market Restrains
- 3.4. Market Trends
- 4. Market Factor Analysis
- 4.1. Porters Five Forces
- 4.2. Supply/Value Chain
- 4.3. PESTEL analysis
- 4.4. Market Entropy
- 4.5. Patent/Trademark Analysis
- 5. Global Packaging Aluminum Aerosol Can Analysis, Insights and Forecast, 2020-2032
- 5.1. Market Analysis, Insights and Forecast - by Application
- 5.1.1. Cosmetics & Personal Care
- 5.1.2. Household Products
- 5.1.3. Medical and Medicine
- 5.1.4. Others
- 5.2. Market Analysis, Insights and Forecast - by Type
- 5.2.1. Less than 200ml
- 5.2.2. 200ml-500ml
- 5.2.3. More than 500ml
- 5.3. Market Analysis, Insights and Forecast - by Region
- 5.3.1. North America
- 5.3.2. South America
- 5.3.3. Europe
- 5.3.4. Middle East & Africa
- 5.3.5. Asia Pacific
- 5.1. Market Analysis, Insights and Forecast - by Application
- 6. North America Packaging Aluminum Aerosol Can Analysis, Insights and Forecast, 2020-2032
- 6.1. Market Analysis, Insights and Forecast - by Application
- 6.1.1. Cosmetics & Personal Care
- 6.1.2. Household Products
- 6.1.3. Medical and Medicine
- 6.1.4. Others
- 6.2. Market Analysis, Insights and Forecast - by Type
- 6.2.1. Less than 200ml
- 6.2.2. 200ml-500ml
- 6.2.3. More than 500ml
- 6.1. Market Analysis, Insights and Forecast - by Application
- 7. South America Packaging Aluminum Aerosol Can Analysis, Insights and Forecast, 2020-2032
- 7.1. Market Analysis, Insights and Forecast - by Application
- 7.1.1. Cosmetics & Personal Care
- 7.1.2. Household Products
- 7.1.3. Medical and Medicine
- 7.1.4. Others
- 7.2. Market Analysis, Insights and Forecast - by Type
- 7.2.1. Less than 200ml
- 7.2.2. 200ml-500ml
- 7.2.3. More than 500ml
- 7.1. Market Analysis, Insights and Forecast - by Application
- 8. Europe Packaging Aluminum Aerosol Can Analysis, Insights and Forecast, 2020-2032
- 8.1. Market Analysis, Insights and Forecast - by Application
- 8.1.1. Cosmetics & Personal Care
- 8.1.2. Household Products
- 8.1.3. Medical and Medicine
- 8.1.4. Others
- 8.2. Market Analysis, Insights and Forecast - by Type
- 8.2.1. Less than 200ml
- 8.2.2. 200ml-500ml
- 8.2.3. More than 500ml
- 8.1. Market Analysis, Insights and Forecast - by Application
- 9. Middle East & Africa Packaging Aluminum Aerosol Can Analysis, Insights and Forecast, 2020-2032
- 9.1. Market Analysis, Insights and Forecast - by Application
- 9.1.1. Cosmetics & Personal Care
- 9.1.2. Household Products
- 9.1.3. Medical and Medicine
- 9.1.4. Others
- 9.2. Market Analysis, Insights and Forecast - by Type
- 9.2.1. Less than 200ml
- 9.2.2. 200ml-500ml
- 9.2.3. More than 500ml
- 9.1. Market Analysis, Insights and Forecast - by Application
- 10. Asia Pacific Packaging Aluminum Aerosol Can Analysis, Insights and Forecast, 2020-2032
- 10.1. Market Analysis, Insights and Forecast - by Application
- 10.1.1. Cosmetics & Personal Care
- 10.1.2. Household Products
- 10.1.3. Medical and Medicine
- 10.1.4. Others
- 10.2. Market Analysis, Insights and Forecast - by Type
- 10.2.1. Less than 200ml
- 10.2.2. 200ml-500ml
- 10.2.3. More than 500ml
- 10.1. Market Analysis, Insights and Forecast - by Application
- 11. Competitive Analysis
- 11.1. Global Market Share Analysis 2025
- 11.2. Company Profiles
- 11.2.1 Ball Corporation
- 11.2.1.1. Overview
- 11.2.1.2. Products
- 11.2.1.3. SWOT Analysis
- 11.2.1.4. Recent Developments
- 11.2.1.5. Financials (Based on Availability)
- 11.2.2 Trivium Packaging
- 11.2.2.1. Overview
- 11.2.2.2. Products
- 11.2.2.3. SWOT Analysis
- 11.2.2.4. Recent Developments
- 11.2.2.5. Financials (Based on Availability)
- 11.2.3 CCL Containers
- 11.2.3.1. Overview
- 11.2.3.2. Products
- 11.2.3.3. SWOT Analysis
- 11.2.3.4. Recent Developments
- 11.2.3.5. Financials (Based on Availability)
- 11.2.4 TUBEX GmbH
- 11.2.4.1. Overview
- 11.2.4.2. Products
- 11.2.4.3. SWOT Analysis
- 11.2.4.4. Recent Developments
- 11.2.4.5. Financials (Based on Availability)
- 11.2.5 Moravia Cans
- 11.2.5.1. Overview
- 11.2.5.2. Products
- 11.2.5.3. SWOT Analysis
- 11.2.5.4. Recent Developments
- 11.2.5.5. Financials (Based on Availability)
- 11.2.6 LINHARDT
- 11.2.6.1. Overview
- 11.2.6.2. Products
- 11.2.6.3. SWOT Analysis
- 11.2.6.4. Recent Developments
- 11.2.6.5. Financials (Based on Availability)
- 11.2.7 ALLTUB
- 11.2.7.1. Overview
- 11.2.7.2. Products
- 11.2.7.3. SWOT Analysis
- 11.2.7.4. Recent Developments
- 11.2.7.5. Financials (Based on Availability)
- 11.2.8 ALUCON
- 11.2.8.1. Overview
- 11.2.8.2. Products
- 11.2.8.3. SWOT Analysis
- 11.2.8.4. Recent Developments
- 11.2.8.5. Financials (Based on Availability)
- 11.2.9 Jamestrong
- 11.2.9.1. Overview
- 11.2.9.2. Products
- 11.2.9.3. SWOT Analysis
- 11.2.9.4. Recent Developments
- 11.2.9.5. Financials (Based on Availability)
- 11.2.10 Aryum
- 11.2.10.1. Overview
- 11.2.10.2. Products
- 11.2.10.3. SWOT Analysis
- 11.2.10.4. Recent Developments
- 11.2.10.5. Financials (Based on Availability)
- 11.2.11 Bispharma
- 11.2.11.1. Overview
- 11.2.11.2. Products
- 11.2.11.3. SWOT Analysis
- 11.2.11.4. Recent Developments
- 11.2.11.5. Financials (Based on Availability)
- 11.2.12 Gulf Cans Industries
- 11.2.12.1. Overview
- 11.2.12.2. Products
- 11.2.12.3. SWOT Analysis
- 11.2.12.4. Recent Developments
- 11.2.12.5. Financials (Based on Availability)
- 11.2.13 Euro Asia Packaging
- 11.2.13.1. Overview
- 11.2.13.2. Products
- 11.2.13.3. SWOT Analysis
- 11.2.13.4. Recent Developments
- 11.2.13.5. Financials (Based on Availability)
- 11.2.14 Bharat Containers
- 11.2.14.1. Overview
- 11.2.14.2. Products
- 11.2.14.3. SWOT Analysis
- 11.2.14.4. Recent Developments
- 11.2.14.5. Financials (Based on Availability)
- 11.2.15 Montebello Packaging
- 11.2.15.1. Overview
- 11.2.15.2. Products
- 11.2.15.3. SWOT Analysis
- 11.2.15.4. Recent Developments
- 11.2.15.5. Financials (Based on Availability)
- 11.2.16 Condensa
- 11.2.16.1. Overview
- 11.2.16.2. Products
- 11.2.16.3. SWOT Analysis
- 11.2.16.4. Recent Developments
- 11.2.16.5. Financials (Based on Availability)
- 11.2.1 Ball Corporation
List of Figures
- Figure 1: Global Packaging Aluminum Aerosol Can Revenue Breakdown (billion, %) by Region 2025 & 2033
- Figure 2: Global Packaging Aluminum Aerosol Can Volume Breakdown (K, %) by Region 2025 & 2033
- Figure 3: North America Packaging Aluminum Aerosol Can Revenue (billion), by Application 2025 & 2033
- Figure 4: North America Packaging Aluminum Aerosol Can Volume (K), by Application 2025 & 2033
- Figure 5: North America Packaging Aluminum Aerosol Can Revenue Share (%), by Application 2025 & 2033
- Figure 6: North America Packaging Aluminum Aerosol Can Volume Share (%), by Application 2025 & 2033
- Figure 7: North America Packaging Aluminum Aerosol Can Revenue (billion), by Type 2025 & 2033
- Figure 8: North America Packaging Aluminum Aerosol Can Volume (K), by Type 2025 & 2033
- Figure 9: North America Packaging Aluminum Aerosol Can Revenue Share (%), by Type 2025 & 2033
- Figure 10: North America Packaging Aluminum Aerosol Can Volume Share (%), by Type 2025 & 2033
- Figure 11: North America Packaging Aluminum Aerosol Can Revenue (billion), by Country 2025 & 2033
- Figure 12: North America Packaging Aluminum Aerosol Can Volume (K), by Country 2025 & 2033
- Figure 13: North America Packaging Aluminum Aerosol Can Revenue Share (%), by Country 2025 & 2033
- Figure 14: North America Packaging Aluminum Aerosol Can Volume Share (%), by Country 2025 & 2033
- Figure 15: South America Packaging Aluminum Aerosol Can Revenue (billion), by Application 2025 & 2033
- Figure 16: South America Packaging Aluminum Aerosol Can Volume (K), by Application 2025 & 2033
- Figure 17: South America Packaging Aluminum Aerosol Can Revenue Share (%), by Application 2025 & 2033
- Figure 18: South America Packaging Aluminum Aerosol Can Volume Share (%), by Application 2025 & 2033
- Figure 19: South America Packaging Aluminum Aerosol Can Revenue (billion), by Type 2025 & 2033
- Figure 20: South America Packaging Aluminum Aerosol Can Volume (K), by Type 2025 & 2033
- Figure 21: South America Packaging Aluminum Aerosol Can Revenue Share (%), by Type 2025 & 2033
- Figure 22: South America Packaging Aluminum Aerosol Can Volume Share (%), by Type 2025 & 2033
- Figure 23: South America Packaging Aluminum Aerosol Can Revenue (billion), by Country 2025 & 2033
- Figure 24: South America Packaging Aluminum Aerosol Can Volume (K), by Country 2025 & 2033
- Figure 25: South America Packaging Aluminum Aerosol Can Revenue Share (%), by Country 2025 & 2033
- Figure 26: South America Packaging Aluminum Aerosol Can Volume Share (%), by Country 2025 & 2033
- Figure 27: Europe Packaging Aluminum Aerosol Can Revenue (billion), by Application 2025 & 2033
- Figure 28: Europe Packaging Aluminum Aerosol Can Volume (K), by Application 2025 & 2033
- Figure 29: Europe Packaging Aluminum Aerosol Can Revenue Share (%), by Application 2025 & 2033
- Figure 30: Europe Packaging Aluminum Aerosol Can Volume Share (%), by Application 2025 & 2033
- Figure 31: Europe Packaging Aluminum Aerosol Can Revenue (billion), by Type 2025 & 2033
- Figure 32: Europe Packaging Aluminum Aerosol Can Volume (K), by Type 2025 & 2033
- Figure 33: Europe Packaging Aluminum Aerosol Can Revenue Share (%), by Type 2025 & 2033
- Figure 34: Europe Packaging Aluminum Aerosol Can Volume Share (%), by Type 2025 & 2033
- Figure 35: Europe Packaging Aluminum Aerosol Can Revenue (billion), by Country 2025 & 2033
- Figure 36: Europe Packaging Aluminum Aerosol Can Volume (K), by Country 2025 & 2033
- Figure 37: Europe Packaging Aluminum Aerosol Can Revenue Share (%), by Country 2025 & 2033
- Figure 38: Europe Packaging Aluminum Aerosol Can Volume Share (%), by Country 2025 & 2033
- Figure 39: Middle East & Africa Packaging Aluminum Aerosol Can Revenue (billion), by Application 2025 & 2033
- Figure 40: Middle East & Africa Packaging Aluminum Aerosol Can Volume (K), by Application 2025 & 2033
- Figure 41: Middle East & Africa Packaging Aluminum Aerosol Can Revenue Share (%), by Application 2025 & 2033
- Figure 42: Middle East & Africa Packaging Aluminum Aerosol Can Volume Share (%), by Application 2025 & 2033
- Figure 43: Middle East & Africa Packaging Aluminum Aerosol Can Revenue (billion), by Type 2025 & 2033
- Figure 44: Middle East & Africa Packaging Aluminum Aerosol Can Volume (K), by Type 2025 & 2033
- Figure 45: Middle East & Africa Packaging Aluminum Aerosol Can Revenue Share (%), by Type 2025 & 2033
- Figure 46: Middle East & Africa Packaging Aluminum Aerosol Can Volume Share (%), by Type 2025 & 2033
- Figure 47: Middle East & Africa Packaging Aluminum Aerosol Can Revenue (billion), by Country 2025 & 2033
- Figure 48: Middle East & Africa Packaging Aluminum Aerosol Can Volume (K), by Country 2025 & 2033
- Figure 49: Middle East & Africa Packaging Aluminum Aerosol Can Revenue Share (%), by Country 2025 & 2033
- Figure 50: Middle East & Africa Packaging Aluminum Aerosol Can Volume Share (%), by Country 2025 & 2033
- Figure 51: Asia Pacific Packaging Aluminum Aerosol Can Revenue (billion), by Application 2025 & 2033
- Figure 52: Asia Pacific Packaging Aluminum Aerosol Can Volume (K), by Application 2025 & 2033
- Figure 53: Asia Pacific Packaging Aluminum Aerosol Can Revenue Share (%), by Application 2025 & 2033
- Figure 54: Asia Pacific Packaging Aluminum Aerosol Can Volume Share (%), by Application 2025 & 2033
- Figure 55: Asia Pacific Packaging Aluminum Aerosol Can Revenue (billion), by Type 2025 & 2033
- Figure 56: Asia Pacific Packaging Aluminum Aerosol Can Volume (K), by Type 2025 & 2033
- Figure 57: Asia Pacific Packaging Aluminum Aerosol Can Revenue Share (%), by Type 2025 & 2033
- Figure 58: Asia Pacific Packaging Aluminum Aerosol Can Volume Share (%), by Type 2025 & 2033
- Figure 59: Asia Pacific Packaging Aluminum Aerosol Can Revenue (billion), by Country 2025 & 2033
- Figure 60: Asia Pacific Packaging Aluminum Aerosol Can Volume (K), by Country 2025 & 2033
- Figure 61: Asia Pacific Packaging Aluminum Aerosol Can Revenue Share (%), by Country 2025 & 2033
- Figure 62: Asia Pacific Packaging Aluminum Aerosol Can Volume Share (%), by Country 2025 & 2033
List of Tables
- Table 1: Global Packaging Aluminum Aerosol Can Revenue billion Forecast, by Application 2020 & 2033
- Table 2: Global Packaging Aluminum Aerosol Can Volume K Forecast, by Application 2020 & 2033
- Table 3: Global Packaging Aluminum Aerosol Can Revenue billion Forecast, by Type 2020 & 2033
- Table 4: Global Packaging Aluminum Aerosol Can Volume K Forecast, by Type 2020 & 2033
- Table 5: Global Packaging Aluminum Aerosol Can Revenue billion Forecast, by Region 2020 & 2033
- Table 6: Global Packaging Aluminum Aerosol Can Volume K Forecast, by Region 2020 & 2033
- Table 7: Global Packaging Aluminum Aerosol Can Revenue billion Forecast, by Application 2020 & 2033
- Table 8: Global Packaging Aluminum Aerosol Can Volume K Forecast, by Application 2020 & 2033
- Table 9: Global Packaging Aluminum Aerosol Can Revenue billion Forecast, by Type 2020 & 2033
- Table 10: Global Packaging Aluminum Aerosol Can Volume K Forecast, by Type 2020 & 2033
- Table 11: Global Packaging Aluminum Aerosol Can Revenue billion Forecast, by Country 2020 & 2033
- Table 12: Global Packaging Aluminum Aerosol Can Volume K Forecast, by Country 2020 & 2033
- Table 13: United States Packaging Aluminum Aerosol Can Revenue (billion) Forecast, by Application 2020 & 2033
- Table 14: United States Packaging Aluminum Aerosol Can Volume (K) Forecast, by Application 2020 & 2033
- Table 15: Canada Packaging Aluminum Aerosol Can Revenue (billion) Forecast, by Application 2020 & 2033
- Table 16: Canada Packaging Aluminum Aerosol Can Volume (K) Forecast, by Application 2020 & 2033
- Table 17: Mexico Packaging Aluminum Aerosol Can Revenue (billion) Forecast, by Application 2020 & 2033
- Table 18: Mexico Packaging Aluminum Aerosol Can Volume (K) Forecast, by Application 2020 & 2033
- Table 19: Global Packaging Aluminum Aerosol Can Revenue billion Forecast, by Application 2020 & 2033
- Table 20: Global Packaging Aluminum Aerosol Can Volume K Forecast, by Application 2020 & 2033
- Table 21: Global Packaging Aluminum Aerosol Can Revenue billion Forecast, by Type 2020 & 2033
- Table 22: Global Packaging Aluminum Aerosol Can Volume K Forecast, by Type 2020 & 2033
- Table 23: Global Packaging Aluminum Aerosol Can Revenue billion Forecast, by Country 2020 & 2033
- Table 24: Global Packaging Aluminum Aerosol Can Volume K Forecast, by Country 2020 & 2033
- Table 25: Brazil Packaging Aluminum Aerosol Can Revenue (billion) Forecast, by Application 2020 & 2033
- Table 26: Brazil Packaging Aluminum Aerosol Can Volume (K) Forecast, by Application 2020 & 2033
- Table 27: Argentina Packaging Aluminum Aerosol Can Revenue (billion) Forecast, by Application 2020 & 2033
- Table 28: Argentina Packaging Aluminum Aerosol Can Volume (K) Forecast, by Application 2020 & 2033
- Table 29: Rest of South America Packaging Aluminum Aerosol Can Revenue (billion) Forecast, by Application 2020 & 2033
- Table 30: Rest of South America Packaging Aluminum Aerosol Can Volume (K) Forecast, by Application 2020 & 2033
- Table 31: Global Packaging Aluminum Aerosol Can Revenue billion Forecast, by Application 2020 & 2033
- Table 32: Global Packaging Aluminum Aerosol Can Volume K Forecast, by Application 2020 & 2033
- Table 33: Global Packaging Aluminum Aerosol Can Revenue billion Forecast, by Type 2020 & 2033
- Table 34: Global Packaging Aluminum Aerosol Can Volume K Forecast, by Type 2020 & 2033
- Table 35: Global Packaging Aluminum Aerosol Can Revenue billion Forecast, by Country 2020 & 2033
- Table 36: Global Packaging Aluminum Aerosol Can Volume K Forecast, by Country 2020 & 2033
- Table 37: United Kingdom Packaging Aluminum Aerosol Can Revenue (billion) Forecast, by Application 2020 & 2033
- Table 38: United Kingdom Packaging Aluminum Aerosol Can Volume (K) Forecast, by Application 2020 & 2033
- Table 39: Germany Packaging Aluminum Aerosol Can Revenue (billion) Forecast, by Application 2020 & 2033
- Table 40: Germany Packaging Aluminum Aerosol Can Volume (K) Forecast, by Application 2020 & 2033
- Table 41: France Packaging Aluminum Aerosol Can Revenue (billion) Forecast, by Application 2020 & 2033
- Table 42: France Packaging Aluminum Aerosol Can Volume (K) Forecast, by Application 2020 & 2033
- Table 43: Italy Packaging Aluminum Aerosol Can Revenue (billion) Forecast, by Application 2020 & 2033
- Table 44: Italy Packaging Aluminum Aerosol Can Volume (K) Forecast, by Application 2020 & 2033
- Table 45: Spain Packaging Aluminum Aerosol Can Revenue (billion) Forecast, by Application 2020 & 2033
- Table 46: Spain Packaging Aluminum Aerosol Can Volume (K) Forecast, by Application 2020 & 2033
- Table 47: Russia Packaging Aluminum Aerosol Can Revenue (billion) Forecast, by Application 2020 & 2033
- Table 48: Russia Packaging Aluminum Aerosol Can Volume (K) Forecast, by Application 2020 & 2033
- Table 49: Benelux Packaging Aluminum Aerosol Can Revenue (billion) Forecast, by Application 2020 & 2033
- Table 50: Benelux Packaging Aluminum Aerosol Can Volume (K) Forecast, by Application 2020 & 2033
- Table 51: Nordics Packaging Aluminum Aerosol Can Revenue (billion) Forecast, by Application 2020 & 2033
- Table 52: Nordics Packaging Aluminum Aerosol Can Volume (K) Forecast, by Application 2020 & 2033
- Table 53: Rest of Europe Packaging Aluminum Aerosol Can Revenue (billion) Forecast, by Application 2020 & 2033
- Table 54: Rest of Europe Packaging Aluminum Aerosol Can Volume (K) Forecast, by Application 2020 & 2033
- Table 55: Global Packaging Aluminum Aerosol Can Revenue billion Forecast, by Application 2020 & 2033
- Table 56: Global Packaging Aluminum Aerosol Can Volume K Forecast, by Application 2020 & 2033
- Table 57: Global Packaging Aluminum Aerosol Can Revenue billion Forecast, by Type 2020 & 2033
- Table 58: Global Packaging Aluminum Aerosol Can Volume K Forecast, by Type 2020 & 2033
- Table 59: Global Packaging Aluminum Aerosol Can Revenue billion Forecast, by Country 2020 & 2033
- Table 60: Global Packaging Aluminum Aerosol Can Volume K Forecast, by Country 2020 & 2033
- Table 61: Turkey Packaging Aluminum Aerosol Can Revenue (billion) Forecast, by Application 2020 & 2033
- Table 62: Turkey Packaging Aluminum Aerosol Can Volume (K) Forecast, by Application 2020 & 2033
- Table 63: Israel Packaging Aluminum Aerosol Can Revenue (billion) Forecast, by Application 2020 & 2033
- Table 64: Israel Packaging Aluminum Aerosol Can Volume (K) Forecast, by Application 2020 & 2033
- Table 65: GCC Packaging Aluminum Aerosol Can Revenue (billion) Forecast, by Application 2020 & 2033
- Table 66: GCC Packaging Aluminum Aerosol Can Volume (K) Forecast, by Application 2020 & 2033
- Table 67: North Africa Packaging Aluminum Aerosol Can Revenue (billion) Forecast, by Application 2020 & 2033
- Table 68: North Africa Packaging Aluminum Aerosol Can Volume (K) Forecast, by Application 2020 & 2033
- Table 69: South Africa Packaging Aluminum Aerosol Can Revenue (billion) Forecast, by Application 2020 & 2033
- Table 70: South Africa Packaging Aluminum Aerosol Can Volume (K) Forecast, by Application 2020 & 2033
- Table 71: Rest of Middle East & Africa Packaging Aluminum Aerosol Can Revenue (billion) Forecast, by Application 2020 & 2033
- Table 72: Rest of Middle East & Africa Packaging Aluminum Aerosol Can Volume (K) Forecast, by Application 2020 & 2033
- Table 73: Global Packaging Aluminum Aerosol Can Revenue billion Forecast, by Application 2020 & 2033
- Table 74: Global Packaging Aluminum Aerosol Can Volume K Forecast, by Application 2020 & 2033
- Table 75: Global Packaging Aluminum Aerosol Can Revenue billion Forecast, by Type 2020 & 2033
- Table 76: Global Packaging Aluminum Aerosol Can Volume K Forecast, by Type 2020 & 2033
- Table 77: Global Packaging Aluminum Aerosol Can Revenue billion Forecast, by Country 2020 & 2033
- Table 78: Global Packaging Aluminum Aerosol Can Volume K Forecast, by Country 2020 & 2033
- Table 79: China Packaging Aluminum Aerosol Can Revenue (billion) Forecast, by Application 2020 & 2033
- Table 80: China Packaging Aluminum Aerosol Can Volume (K) Forecast, by Application 2020 & 2033
- Table 81: India Packaging Aluminum Aerosol Can Revenue (billion) Forecast, by Application 2020 & 2033
- Table 82: India Packaging Aluminum Aerosol Can Volume (K) Forecast, by Application 2020 & 2033
- Table 83: Japan Packaging Aluminum Aerosol Can Revenue (billion) Forecast, by Application 2020 & 2033
- Table 84: Japan Packaging Aluminum Aerosol Can Volume (K) Forecast, by Application 2020 & 2033
- Table 85: South Korea Packaging Aluminum Aerosol Can Revenue (billion) Forecast, by Application 2020 & 2033
- Table 86: South Korea Packaging Aluminum Aerosol Can Volume (K) Forecast, by Application 2020 & 2033
- Table 87: ASEAN Packaging Aluminum Aerosol Can Revenue (billion) Forecast, by Application 2020 & 2033
- Table 88: ASEAN Packaging Aluminum Aerosol Can Volume (K) Forecast, by Application 2020 & 2033
- Table 89: Oceania Packaging Aluminum Aerosol Can Revenue (billion) Forecast, by Application 2020 & 2033
- Table 90: Oceania Packaging Aluminum Aerosol Can Volume (K) Forecast, by Application 2020 & 2033
- Table 91: Rest of Asia Pacific Packaging Aluminum Aerosol Can Revenue (billion) Forecast, by Application 2020 & 2033
- Table 92: Rest of Asia Pacific Packaging Aluminum Aerosol Can Volume (K) Forecast, by Application 2020 & 2033
Frequently Asked Questions
1. What is the projected Compound Annual Growth Rate (CAGR) of the Packaging Aluminum Aerosol Can?
The projected CAGR is approximately 4.62%.
2. Which companies are prominent players in the Packaging Aluminum Aerosol Can?
Key companies in the market include Ball Corporation, Trivium Packaging, CCL Containers, TUBEX GmbH, Moravia Cans, LINHARDT, ALLTUB, ALUCON, Jamestrong, Aryum, Bispharma, Gulf Cans Industries, Euro Asia Packaging, Bharat Containers, Montebello Packaging, Condensa.
3. What are the main segments of the Packaging Aluminum Aerosol Can?
The market segments include Application, Type.
4. Can you provide details about the market size?
The market size is estimated to be USD 7.72 billion as of 2022.
5. What are some drivers contributing to market growth?
N/A
6. What are the notable trends driving market growth?
N/A
7. Are there any restraints impacting market growth?
N/A
8. Can you provide examples of recent developments in the market?
N/A
9. What pricing options are available for accessing the report?
Pricing options include single-user, multi-user, and enterprise licenses priced at USD 3950.00, USD 5925.00, and USD 7900.00 respectively.
10. Is the market size provided in terms of value or volume?
The market size is provided in terms of value, measured in billion and volume, measured in K.
11. Are there any specific market keywords associated with the report?
Yes, the market keyword associated with the report is "Packaging Aluminum Aerosol Can," which aids in identifying and referencing the specific market segment covered.
12. How do I determine which pricing option suits my needs best?
The pricing options vary based on user requirements and access needs. Individual users may opt for single-user licenses, while businesses requiring broader access may choose multi-user or enterprise licenses for cost-effective access to the report.
13. Are there any additional resources or data provided in the Packaging Aluminum Aerosol Can report?
While the report offers comprehensive insights, it's advisable to review the specific contents or supplementary materials provided to ascertain if additional resources or data are available.
14. How can I stay updated on further developments or reports in the Packaging Aluminum Aerosol Can?
To stay informed about further developments, trends, and reports in the Packaging Aluminum Aerosol Can, consider subscribing to industry newsletters, following relevant companies and organizations, or regularly checking reputable industry news sources and publications.
Methodology
Step 1 - Identification of Relevant Samples Size from Population Database


Step 2 - Approaches for Defining Global Market Size (Value, Volume* & Price*)

Note*: In applicable scenarios
Step 3 - Data Sources
Primary Research
- Web Analytics
- Survey Reports
- Research Institute
- Latest Research Reports
- Opinion Leaders
Secondary Research
- Annual Reports
- White Paper
- Latest Press Release
- Industry Association
- Paid Database
- Investor Presentations

Step 4 - Data Triangulation
Involves using different sources of information in order to increase the validity of a study
These sources are likely to be stakeholders in a program - participants, other researchers, program staff, other community members, and so on.
Then we put all data in single framework & apply various statistical tools to find out the dynamic on the market.
During the analysis stage, feedback from the stakeholder groups would be compared to determine areas of agreement as well as areas of divergence