

Key Insights
The global paper bag market is experiencing robust growth, driven by the increasing demand for eco-friendly packaging solutions and a rising consumer preference for sustainable products. The market's expansion is fueled by several factors, including the growing e-commerce sector, which necessitates efficient and cost-effective packaging, and the increasing regulations on plastic bag usage worldwide. Furthermore, the versatility of paper bags, suitable for various applications from grocery shopping to retail packaging, contributes to their widespread adoption. Major players like Mondi, BillerudKorsnäs, and Huhtamaki Group are actively shaping the market landscape through innovations in material science, design, and sustainable manufacturing practices. The market is segmented by material type (kraft paper, recycled paper, etc.), application (food, retail, industrial), and region, with noticeable regional variations in growth rates reflecting differing environmental regulations and consumer behavior. While rising raw material costs and fluctuating pulp prices pose challenges, the long-term outlook remains positive, driven by continuous advancements in biodegradable and recyclable paper bag technology.
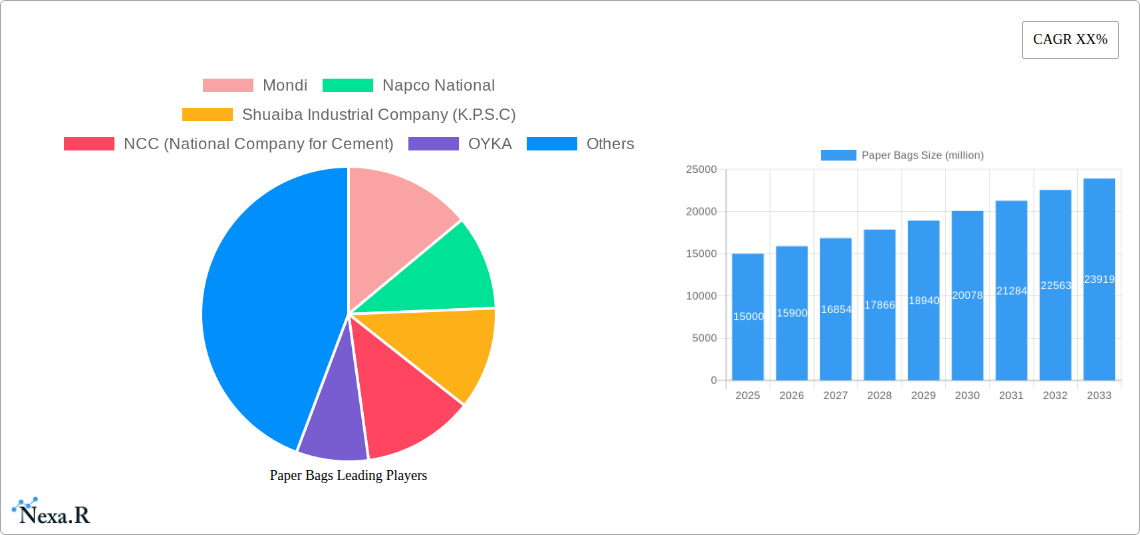
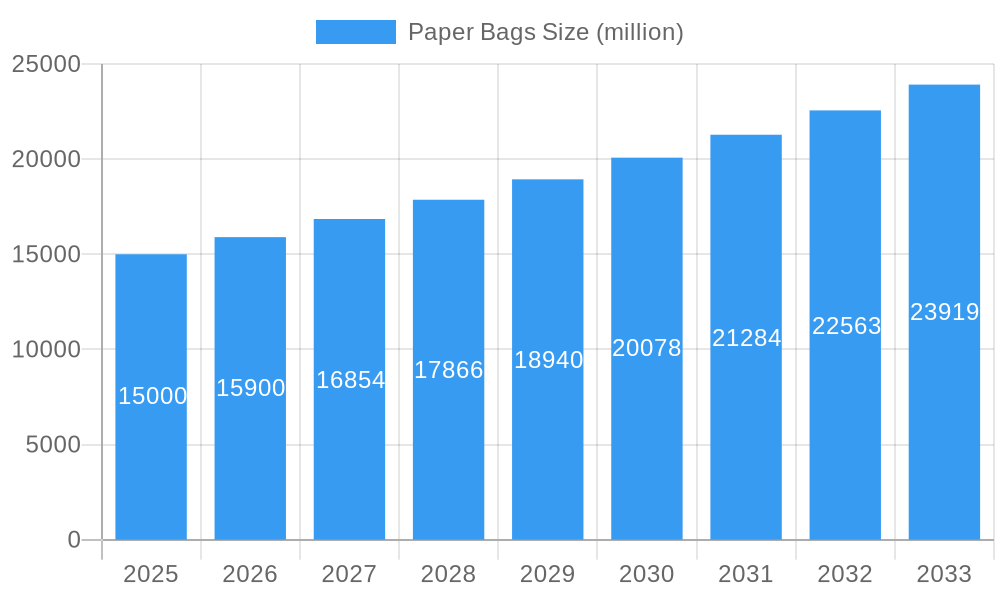
Paper Bags Market Size (In Billion)
Despite the positive market trends, several restraints influence the market's growth trajectory. Competition from alternative packaging materials, such as plastic bags and reusable alternatives, continues to challenge the paper bag industry. Price sensitivity among consumers, particularly in developing economies, can limit market penetration. Furthermore, maintaining consistency in product quality and managing supply chain complexities related to raw material sourcing remain ongoing concerns. However, technological advancements such as improved printing techniques and the development of functional coatings for paper bags are mitigating some of these challenges. The future success of the paper bag market hinges on the ability of manufacturers to balance cost-effectiveness, sustainability, and innovation to meet the evolving needs of a diverse customer base and respond to stricter environmental regulations. The projected CAGR indicates sustained growth over the forecast period, suggesting a promising future for this industry sector.
Paper Bags Company Market Share
Paper Bags Market Report: 2019-2033
This comprehensive report provides a detailed analysis of the global paper bags market, offering invaluable insights for industry professionals, investors, and strategic decision-makers. Spanning the period from 2019 to 2033, with a base year of 2025, this study meticulously examines market dynamics, growth trends, key players, and future opportunities within the packaging industry's paper bags segment. The report projects a market size of xx million units by 2033, showcasing significant growth potential.
Paper Bags Market Dynamics & Structure
The global paper bags market is characterized by a moderately concentrated landscape, with key players like Mondi and BillerudKorsnäs holding significant market shares. Technological innovations, such as improved printing techniques and biodegradable materials, are driving growth. Stringent environmental regulations are also shaping the market, favoring eco-friendly alternatives. Competition from plastic bags remains a significant challenge, although increasing consumer awareness of environmental issues is shifting preference toward sustainable packaging options. Mergers and acquisitions (M&A) activity within the sector has been moderate, with xx deals recorded between 2019 and 2024, mainly focused on expanding product portfolios and geographical reach. The end-user demographic is broad, encompassing food & beverage, retail, and industrial sectors.
- Market Concentration: Moderately concentrated, with top 5 players holding approximately xx% market share in 2024.
- Technological Innovation: Focus on biodegradable materials, improved printing, and automation.
- Regulatory Framework: Increasingly stringent environmental regulations favoring sustainable alternatives.
- Competitive Substitutes: Plastic bags pose a significant threat.
- M&A Activity: xx deals between 2019-2024, driven by expansion and diversification strategies.
Paper Bags Growth Trends & Insights
The global paper bags market experienced a Compound Annual Growth Rate (CAGR) of xx% during the historical period (2019-2024), driven by rising consumer demand for eco-friendly packaging solutions. The market size reached xx million units in 2024 and is projected to grow at a CAGR of xx% during the forecast period (2025-2033), reaching xx million units by 2033. Increased adoption of paper bags across various end-use segments, fueled by growing environmental concerns and supportive government policies, is a major driver. Technological advancements, such as the development of recyclable and compostable paper bags, are also contributing to market growth. Shifting consumer preferences towards sustainable and ethically sourced products further bolster market expansion. Market penetration is expected to reach xx% by 2033.
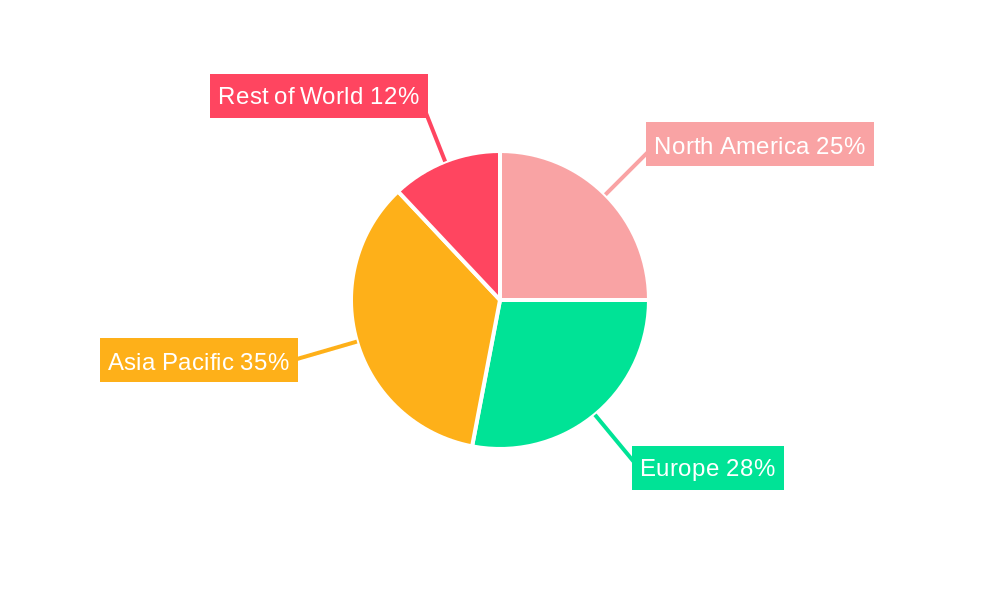
Dominant Regions, Countries, or Segments in Paper Bags
North America and Europe currently dominate the paper bags market, driven by strong environmental regulations and high consumer awareness of sustainability. These regions boast well-established recycling infrastructure and a strong preference for eco-friendly products. However, Asia-Pacific is projected to witness significant growth in the coming years due to rapid economic development and rising disposable incomes. The food and beverage industry is the largest segment, followed by the retail sector.
- Key Drivers in North America/Europe: Stringent environmental regulations, high consumer awareness, established recycling infrastructure.
- Key Drivers in Asia-Pacific: Rapid economic growth, rising disposable incomes, increasing demand for sustainable packaging.
- Market Share: North America (xx%), Europe (xx%), Asia-Pacific (xx%), Rest of World (xx%) in 2024.
Paper Bags Product Landscape
The paper bags market offers a diverse range of products, including those made from recycled paper, biodegradable materials, and customized designs. Innovations focus on improved strength, durability, and aesthetic appeal. Features like enhanced printing capabilities, water resistance, and customizable sizes cater to varied customer needs. Unique selling propositions include eco-friendly credentials, bespoke designs, and competitive pricing. Technological advancements encompass improved manufacturing processes leading to higher efficiency and reduced waste.
Key Drivers, Barriers & Challenges in Paper Bags
Key Drivers: Growing consumer demand for eco-friendly packaging, stringent environmental regulations, increasing awareness of sustainability issues, technological advancements enabling production of superior quality bags.
Key Challenges: Competition from plastic bags, fluctuations in raw material prices (pulp), stringent quality control requirements, maintaining consistent supply chains and logistical challenges. The impact of these challenges results in an estimated xx% reduction in projected market growth annually.
Emerging Opportunities in Paper Bags
The market presents opportunities in developing sustainable packaging solutions for e-commerce, expanding into emerging markets with growing consumer bases, developing customized paper bags for specific product needs, and creating innovative packaging designs with improved functionalities. The use of recycled and compostable materials presents a significant opportunity for growth.
Growth Accelerators in the Paper Bags Industry
Strategic partnerships between paper bag manufacturers and retailers to promote sustainable packaging, technological breakthroughs in production and material science enhancing bag quality and reducing environmental impact, and expansion into new geographical markets with untapped potential are key growth drivers for the paper bags industry.
Key Players Shaping the Paper Bags Market
- Mondi
- Napco National
- Shuaiba Industrial Company (K.P.S.C)
- NCC (National Company for Cement)
- OYKA
- Taurus Packaging
- Papyrus Paper Products LTD
- Sacks Packaging
- BillerudKorsnäs
- Manchester Paper Bags
- Go Green
- Hotpack Packaging
- Pack Tec Group
- Kiki Bags Principal
- Western Modern Pac
- Huhtamaki Group
Notable Milestones in Paper Bags Sector
- 2020: Increased adoption of biodegradable paper bags by major retailers across Europe.
- 2022: Launch of a new range of recyclable paper bags by Mondi.
- 2023: Several mergers and acquisitions involving small to medium-sized paper bag manufacturers.
- 2024: Introduction of innovative printing technology by a leading paper bag producer, enhancing product customization.
In-Depth Paper Bags Market Outlook
The future of the paper bags market looks promising, driven by continued consumer preference for sustainable packaging, supportive government policies, and technological innovations that are constantly improving the product offering. Strategic investments in research and development, coupled with expansion into new markets and collaborations, will shape the long-term growth trajectory of this dynamic sector. The market presents significant opportunities for businesses to capitalize on the growing demand for eco-friendly and customizable packaging solutions.
Paper Bags Segmentation
-
1. Application
- 1.1. Food and Beverages
- 1.2. Consumer Goods
- 1.3. Pharmaceuticals
- 1.4. Chemicals
- 1.5. Others
-
2. Types
- 2.1. Single Use Paper Bags
- 2.2. Re-Usable Paper Bags
Paper Bags Segmentation By Geography
-
1. North America
- 1.1. United States
- 1.2. Canada
- 1.3. Mexico
-
2. South America
- 2.1. Brazil
- 2.2. Argentina
- 2.3. Rest of South America
-
3. Europe
- 3.1. United Kingdom
- 3.2. Germany
- 3.3. France
- 3.4. Italy
- 3.5. Spain
- 3.6. Russia
- 3.7. Benelux
- 3.8. Nordics
- 3.9. Rest of Europe
-
4. Middle East & Africa
- 4.1. Turkey
- 4.2. Israel
- 4.3. GCC
- 4.4. North Africa
- 4.5. South Africa
- 4.6. Rest of Middle East & Africa
-
5. Asia Pacific
- 5.1. China
- 5.2. India
- 5.3. Japan
- 5.4. South Korea
- 5.5. ASEAN
- 5.6. Oceania
- 5.7. Rest of Asia Pacific
Paper Bags Regional Market Share
Geographic Coverage of Paper Bags
Paper Bags REPORT HIGHLIGHTS
| Aspects | Details |
|---|---|
| Study Period | 2020-2034 |
| Base Year | 2025 |
| Estimated Year | 2026 |
| Forecast Period | 2026-2034 |
| Historical Period | 2020-2025 |
| Growth Rate | CAGR of XX% from 2020-2034 |
| Segmentation |
|
Table of Contents
- 1. Introduction
- 1.1. Research Scope
- 1.2. Market Segmentation
- 1.3. Research Methodology
- 1.4. Definitions and Assumptions
- 2. Executive Summary
- 2.1. Introduction
- 3. Market Dynamics
- 3.1. Introduction
- 3.2. Market Drivers
- 3.3. Market Restrains
- 3.4. Market Trends
- 4. Market Factor Analysis
- 4.1. Porters Five Forces
- 4.2. Supply/Value Chain
- 4.3. PESTEL analysis
- 4.4. Market Entropy
- 4.5. Patent/Trademark Analysis
- 5. Global Paper Bags Analysis, Insights and Forecast, 2020-2032
- 5.1. Market Analysis, Insights and Forecast - by Application
- 5.1.1. Food and Beverages
- 5.1.2. Consumer Goods
- 5.1.3. Pharmaceuticals
- 5.1.4. Chemicals
- 5.1.5. Others
- 5.2. Market Analysis, Insights and Forecast - by Types
- 5.2.1. Single Use Paper Bags
- 5.2.2. Re-Usable Paper Bags
- 5.3. Market Analysis, Insights and Forecast - by Region
- 5.3.1. North America
- 5.3.2. South America
- 5.3.3. Europe
- 5.3.4. Middle East & Africa
- 5.3.5. Asia Pacific
- 5.1. Market Analysis, Insights and Forecast - by Application
- 6. North America Paper Bags Analysis, Insights and Forecast, 2020-2032
- 6.1. Market Analysis, Insights and Forecast - by Application
- 6.1.1. Food and Beverages
- 6.1.2. Consumer Goods
- 6.1.3. Pharmaceuticals
- 6.1.4. Chemicals
- 6.1.5. Others
- 6.2. Market Analysis, Insights and Forecast - by Types
- 6.2.1. Single Use Paper Bags
- 6.2.2. Re-Usable Paper Bags
- 6.1. Market Analysis, Insights and Forecast - by Application
- 7. South America Paper Bags Analysis, Insights and Forecast, 2020-2032
- 7.1. Market Analysis, Insights and Forecast - by Application
- 7.1.1. Food and Beverages
- 7.1.2. Consumer Goods
- 7.1.3. Pharmaceuticals
- 7.1.4. Chemicals
- 7.1.5. Others
- 7.2. Market Analysis, Insights and Forecast - by Types
- 7.2.1. Single Use Paper Bags
- 7.2.2. Re-Usable Paper Bags
- 7.1. Market Analysis, Insights and Forecast - by Application
- 8. Europe Paper Bags Analysis, Insights and Forecast, 2020-2032
- 8.1. Market Analysis, Insights and Forecast - by Application
- 8.1.1. Food and Beverages
- 8.1.2. Consumer Goods
- 8.1.3. Pharmaceuticals
- 8.1.4. Chemicals
- 8.1.5. Others
- 8.2. Market Analysis, Insights and Forecast - by Types
- 8.2.1. Single Use Paper Bags
- 8.2.2. Re-Usable Paper Bags
- 8.1. Market Analysis, Insights and Forecast - by Application
- 9. Middle East & Africa Paper Bags Analysis, Insights and Forecast, 2020-2032
- 9.1. Market Analysis, Insights and Forecast - by Application
- 9.1.1. Food and Beverages
- 9.1.2. Consumer Goods
- 9.1.3. Pharmaceuticals
- 9.1.4. Chemicals
- 9.1.5. Others
- 9.2. Market Analysis, Insights and Forecast - by Types
- 9.2.1. Single Use Paper Bags
- 9.2.2. Re-Usable Paper Bags
- 9.1. Market Analysis, Insights and Forecast - by Application
- 10. Asia Pacific Paper Bags Analysis, Insights and Forecast, 2020-2032
- 10.1. Market Analysis, Insights and Forecast - by Application
- 10.1.1. Food and Beverages
- 10.1.2. Consumer Goods
- 10.1.3. Pharmaceuticals
- 10.1.4. Chemicals
- 10.1.5. Others
- 10.2. Market Analysis, Insights and Forecast - by Types
- 10.2.1. Single Use Paper Bags
- 10.2.2. Re-Usable Paper Bags
- 10.1. Market Analysis, Insights and Forecast - by Application
- 11. Competitive Analysis
- 11.1. Global Market Share Analysis 2025
- 11.2. Company Profiles
- 11.2.1 Mondi
- 11.2.1.1. Overview
- 11.2.1.2. Products
- 11.2.1.3. SWOT Analysis
- 11.2.1.4. Recent Developments
- 11.2.1.5. Financials (Based on Availability)
- 11.2.2 Napco National
- 11.2.2.1. Overview
- 11.2.2.2. Products
- 11.2.2.3. SWOT Analysis
- 11.2.2.4. Recent Developments
- 11.2.2.5. Financials (Based on Availability)
- 11.2.3 Shuaiba Industrial Company (K.P.S.C)
- 11.2.3.1. Overview
- 11.2.3.2. Products
- 11.2.3.3. SWOT Analysis
- 11.2.3.4. Recent Developments
- 11.2.3.5. Financials (Based on Availability)
- 11.2.4 NCC (National Company for Cement)
- 11.2.4.1. Overview
- 11.2.4.2. Products
- 11.2.4.3. SWOT Analysis
- 11.2.4.4. Recent Developments
- 11.2.4.5. Financials (Based on Availability)
- 11.2.5 OYKA
- 11.2.5.1. Overview
- 11.2.5.2. Products
- 11.2.5.3. SWOT Analysis
- 11.2.5.4. Recent Developments
- 11.2.5.5. Financials (Based on Availability)
- 11.2.6 Taurus Packaging
- 11.2.6.1. Overview
- 11.2.6.2. Products
- 11.2.6.3. SWOT Analysis
- 11.2.6.4. Recent Developments
- 11.2.6.5. Financials (Based on Availability)
- 11.2.7 Papyrus Paper Products LTD
- 11.2.7.1. Overview
- 11.2.7.2. Products
- 11.2.7.3. SWOT Analysis
- 11.2.7.4. Recent Developments
- 11.2.7.5. Financials (Based on Availability)
- 11.2.8 Sacks Packaging
- 11.2.8.1. Overview
- 11.2.8.2. Products
- 11.2.8.3. SWOT Analysis
- 11.2.8.4. Recent Developments
- 11.2.8.5. Financials (Based on Availability)
- 11.2.9 BillerudKorsnäs
- 11.2.9.1. Overview
- 11.2.9.2. Products
- 11.2.9.3. SWOT Analysis
- 11.2.9.4. Recent Developments
- 11.2.9.5. Financials (Based on Availability)
- 11.2.10 Manchester Paper Bags
- 11.2.10.1. Overview
- 11.2.10.2. Products
- 11.2.10.3. SWOT Analysis
- 11.2.10.4. Recent Developments
- 11.2.10.5. Financials (Based on Availability)
- 11.2.11 Go Green
- 11.2.11.1. Overview
- 11.2.11.2. Products
- 11.2.11.3. SWOT Analysis
- 11.2.11.4. Recent Developments
- 11.2.11.5. Financials (Based on Availability)
- 11.2.12 Hotpack Packaging
- 11.2.12.1. Overview
- 11.2.12.2. Products
- 11.2.12.3. SWOT Analysis
- 11.2.12.4. Recent Developments
- 11.2.12.5. Financials (Based on Availability)
- 11.2.13 Pack Tec Group
- 11.2.13.1. Overview
- 11.2.13.2. Products
- 11.2.13.3. SWOT Analysis
- 11.2.13.4. Recent Developments
- 11.2.13.5. Financials (Based on Availability)
- 11.2.14 Kiki Bags Principal
- 11.2.14.1. Overview
- 11.2.14.2. Products
- 11.2.14.3. SWOT Analysis
- 11.2.14.4. Recent Developments
- 11.2.14.5. Financials (Based on Availability)
- 11.2.15 Western Modern Pac
- 11.2.15.1. Overview
- 11.2.15.2. Products
- 11.2.15.3. SWOT Analysis
- 11.2.15.4. Recent Developments
- 11.2.15.5. Financials (Based on Availability)
- 11.2.16 Huhtamaki Group
- 11.2.16.1. Overview
- 11.2.16.2. Products
- 11.2.16.3. SWOT Analysis
- 11.2.16.4. Recent Developments
- 11.2.16.5. Financials (Based on Availability)
- 11.2.1 Mondi
List of Figures
- Figure 1: Global Paper Bags Revenue Breakdown (million, %) by Region 2025 & 2033
- Figure 2: Global Paper Bags Volume Breakdown (K, %) by Region 2025 & 2033
- Figure 3: North America Paper Bags Revenue (million), by Application 2025 & 2033
- Figure 4: North America Paper Bags Volume (K), by Application 2025 & 2033
- Figure 5: North America Paper Bags Revenue Share (%), by Application 2025 & 2033
- Figure 6: North America Paper Bags Volume Share (%), by Application 2025 & 2033
- Figure 7: North America Paper Bags Revenue (million), by Types 2025 & 2033
- Figure 8: North America Paper Bags Volume (K), by Types 2025 & 2033
- Figure 9: North America Paper Bags Revenue Share (%), by Types 2025 & 2033
- Figure 10: North America Paper Bags Volume Share (%), by Types 2025 & 2033
- Figure 11: North America Paper Bags Revenue (million), by Country 2025 & 2033
- Figure 12: North America Paper Bags Volume (K), by Country 2025 & 2033
- Figure 13: North America Paper Bags Revenue Share (%), by Country 2025 & 2033
- Figure 14: North America Paper Bags Volume Share (%), by Country 2025 & 2033
- Figure 15: South America Paper Bags Revenue (million), by Application 2025 & 2033
- Figure 16: South America Paper Bags Volume (K), by Application 2025 & 2033
- Figure 17: South America Paper Bags Revenue Share (%), by Application 2025 & 2033
- Figure 18: South America Paper Bags Volume Share (%), by Application 2025 & 2033
- Figure 19: South America Paper Bags Revenue (million), by Types 2025 & 2033
- Figure 20: South America Paper Bags Volume (K), by Types 2025 & 2033
- Figure 21: South America Paper Bags Revenue Share (%), by Types 2025 & 2033
- Figure 22: South America Paper Bags Volume Share (%), by Types 2025 & 2033
- Figure 23: South America Paper Bags Revenue (million), by Country 2025 & 2033
- Figure 24: South America Paper Bags Volume (K), by Country 2025 & 2033
- Figure 25: South America Paper Bags Revenue Share (%), by Country 2025 & 2033
- Figure 26: South America Paper Bags Volume Share (%), by Country 2025 & 2033
- Figure 27: Europe Paper Bags Revenue (million), by Application 2025 & 2033
- Figure 28: Europe Paper Bags Volume (K), by Application 2025 & 2033
- Figure 29: Europe Paper Bags Revenue Share (%), by Application 2025 & 2033
- Figure 30: Europe Paper Bags Volume Share (%), by Application 2025 & 2033
- Figure 31: Europe Paper Bags Revenue (million), by Types 2025 & 2033
- Figure 32: Europe Paper Bags Volume (K), by Types 2025 & 2033
- Figure 33: Europe Paper Bags Revenue Share (%), by Types 2025 & 2033
- Figure 34: Europe Paper Bags Volume Share (%), by Types 2025 & 2033
- Figure 35: Europe Paper Bags Revenue (million), by Country 2025 & 2033
- Figure 36: Europe Paper Bags Volume (K), by Country 2025 & 2033
- Figure 37: Europe Paper Bags Revenue Share (%), by Country 2025 & 2033
- Figure 38: Europe Paper Bags Volume Share (%), by Country 2025 & 2033
- Figure 39: Middle East & Africa Paper Bags Revenue (million), by Application 2025 & 2033
- Figure 40: Middle East & Africa Paper Bags Volume (K), by Application 2025 & 2033
- Figure 41: Middle East & Africa Paper Bags Revenue Share (%), by Application 2025 & 2033
- Figure 42: Middle East & Africa Paper Bags Volume Share (%), by Application 2025 & 2033
- Figure 43: Middle East & Africa Paper Bags Revenue (million), by Types 2025 & 2033
- Figure 44: Middle East & Africa Paper Bags Volume (K), by Types 2025 & 2033
- Figure 45: Middle East & Africa Paper Bags Revenue Share (%), by Types 2025 & 2033
- Figure 46: Middle East & Africa Paper Bags Volume Share (%), by Types 2025 & 2033
- Figure 47: Middle East & Africa Paper Bags Revenue (million), by Country 2025 & 2033
- Figure 48: Middle East & Africa Paper Bags Volume (K), by Country 2025 & 2033
- Figure 49: Middle East & Africa Paper Bags Revenue Share (%), by Country 2025 & 2033
- Figure 50: Middle East & Africa Paper Bags Volume Share (%), by Country 2025 & 2033
- Figure 51: Asia Pacific Paper Bags Revenue (million), by Application 2025 & 2033
- Figure 52: Asia Pacific Paper Bags Volume (K), by Application 2025 & 2033
- Figure 53: Asia Pacific Paper Bags Revenue Share (%), by Application 2025 & 2033
- Figure 54: Asia Pacific Paper Bags Volume Share (%), by Application 2025 & 2033
- Figure 55: Asia Pacific Paper Bags Revenue (million), by Types 2025 & 2033
- Figure 56: Asia Pacific Paper Bags Volume (K), by Types 2025 & 2033
- Figure 57: Asia Pacific Paper Bags Revenue Share (%), by Types 2025 & 2033
- Figure 58: Asia Pacific Paper Bags Volume Share (%), by Types 2025 & 2033
- Figure 59: Asia Pacific Paper Bags Revenue (million), by Country 2025 & 2033
- Figure 60: Asia Pacific Paper Bags Volume (K), by Country 2025 & 2033
- Figure 61: Asia Pacific Paper Bags Revenue Share (%), by Country 2025 & 2033
- Figure 62: Asia Pacific Paper Bags Volume Share (%), by Country 2025 & 2033
List of Tables
- Table 1: Global Paper Bags Revenue million Forecast, by Application 2020 & 2033
- Table 2: Global Paper Bags Volume K Forecast, by Application 2020 & 2033
- Table 3: Global Paper Bags Revenue million Forecast, by Types 2020 & 2033
- Table 4: Global Paper Bags Volume K Forecast, by Types 2020 & 2033
- Table 5: Global Paper Bags Revenue million Forecast, by Region 2020 & 2033
- Table 6: Global Paper Bags Volume K Forecast, by Region 2020 & 2033
- Table 7: Global Paper Bags Revenue million Forecast, by Application 2020 & 2033
- Table 8: Global Paper Bags Volume K Forecast, by Application 2020 & 2033
- Table 9: Global Paper Bags Revenue million Forecast, by Types 2020 & 2033
- Table 10: Global Paper Bags Volume K Forecast, by Types 2020 & 2033
- Table 11: Global Paper Bags Revenue million Forecast, by Country 2020 & 2033
- Table 12: Global Paper Bags Volume K Forecast, by Country 2020 & 2033
- Table 13: United States Paper Bags Revenue (million) Forecast, by Application 2020 & 2033
- Table 14: United States Paper Bags Volume (K) Forecast, by Application 2020 & 2033
- Table 15: Canada Paper Bags Revenue (million) Forecast, by Application 2020 & 2033
- Table 16: Canada Paper Bags Volume (K) Forecast, by Application 2020 & 2033
- Table 17: Mexico Paper Bags Revenue (million) Forecast, by Application 2020 & 2033
- Table 18: Mexico Paper Bags Volume (K) Forecast, by Application 2020 & 2033
- Table 19: Global Paper Bags Revenue million Forecast, by Application 2020 & 2033
- Table 20: Global Paper Bags Volume K Forecast, by Application 2020 & 2033
- Table 21: Global Paper Bags Revenue million Forecast, by Types 2020 & 2033
- Table 22: Global Paper Bags Volume K Forecast, by Types 2020 & 2033
- Table 23: Global Paper Bags Revenue million Forecast, by Country 2020 & 2033
- Table 24: Global Paper Bags Volume K Forecast, by Country 2020 & 2033
- Table 25: Brazil Paper Bags Revenue (million) Forecast, by Application 2020 & 2033
- Table 26: Brazil Paper Bags Volume (K) Forecast, by Application 2020 & 2033
- Table 27: Argentina Paper Bags Revenue (million) Forecast, by Application 2020 & 2033
- Table 28: Argentina Paper Bags Volume (K) Forecast, by Application 2020 & 2033
- Table 29: Rest of South America Paper Bags Revenue (million) Forecast, by Application 2020 & 2033
- Table 30: Rest of South America Paper Bags Volume (K) Forecast, by Application 2020 & 2033
- Table 31: Global Paper Bags Revenue million Forecast, by Application 2020 & 2033
- Table 32: Global Paper Bags Volume K Forecast, by Application 2020 & 2033
- Table 33: Global Paper Bags Revenue million Forecast, by Types 2020 & 2033
- Table 34: Global Paper Bags Volume K Forecast, by Types 2020 & 2033
- Table 35: Global Paper Bags Revenue million Forecast, by Country 2020 & 2033
- Table 36: Global Paper Bags Volume K Forecast, by Country 2020 & 2033
- Table 37: United Kingdom Paper Bags Revenue (million) Forecast, by Application 2020 & 2033
- Table 38: United Kingdom Paper Bags Volume (K) Forecast, by Application 2020 & 2033
- Table 39: Germany Paper Bags Revenue (million) Forecast, by Application 2020 & 2033
- Table 40: Germany Paper Bags Volume (K) Forecast, by Application 2020 & 2033
- Table 41: France Paper Bags Revenue (million) Forecast, by Application 2020 & 2033
- Table 42: France Paper Bags Volume (K) Forecast, by Application 2020 & 2033
- Table 43: Italy Paper Bags Revenue (million) Forecast, by Application 2020 & 2033
- Table 44: Italy Paper Bags Volume (K) Forecast, by Application 2020 & 2033
- Table 45: Spain Paper Bags Revenue (million) Forecast, by Application 2020 & 2033
- Table 46: Spain Paper Bags Volume (K) Forecast, by Application 2020 & 2033
- Table 47: Russia Paper Bags Revenue (million) Forecast, by Application 2020 & 2033
- Table 48: Russia Paper Bags Volume (K) Forecast, by Application 2020 & 2033
- Table 49: Benelux Paper Bags Revenue (million) Forecast, by Application 2020 & 2033
- Table 50: Benelux Paper Bags Volume (K) Forecast, by Application 2020 & 2033
- Table 51: Nordics Paper Bags Revenue (million) Forecast, by Application 2020 & 2033
- Table 52: Nordics Paper Bags Volume (K) Forecast, by Application 2020 & 2033
- Table 53: Rest of Europe Paper Bags Revenue (million) Forecast, by Application 2020 & 2033
- Table 54: Rest of Europe Paper Bags Volume (K) Forecast, by Application 2020 & 2033
- Table 55: Global Paper Bags Revenue million Forecast, by Application 2020 & 2033
- Table 56: Global Paper Bags Volume K Forecast, by Application 2020 & 2033
- Table 57: Global Paper Bags Revenue million Forecast, by Types 2020 & 2033
- Table 58: Global Paper Bags Volume K Forecast, by Types 2020 & 2033
- Table 59: Global Paper Bags Revenue million Forecast, by Country 2020 & 2033
- Table 60: Global Paper Bags Volume K Forecast, by Country 2020 & 2033
- Table 61: Turkey Paper Bags Revenue (million) Forecast, by Application 2020 & 2033
- Table 62: Turkey Paper Bags Volume (K) Forecast, by Application 2020 & 2033
- Table 63: Israel Paper Bags Revenue (million) Forecast, by Application 2020 & 2033
- Table 64: Israel Paper Bags Volume (K) Forecast, by Application 2020 & 2033
- Table 65: GCC Paper Bags Revenue (million) Forecast, by Application 2020 & 2033
- Table 66: GCC Paper Bags Volume (K) Forecast, by Application 2020 & 2033
- Table 67: North Africa Paper Bags Revenue (million) Forecast, by Application 2020 & 2033
- Table 68: North Africa Paper Bags Volume (K) Forecast, by Application 2020 & 2033
- Table 69: South Africa Paper Bags Revenue (million) Forecast, by Application 2020 & 2033
- Table 70: South Africa Paper Bags Volume (K) Forecast, by Application 2020 & 2033
- Table 71: Rest of Middle East & Africa Paper Bags Revenue (million) Forecast, by Application 2020 & 2033
- Table 72: Rest of Middle East & Africa Paper Bags Volume (K) Forecast, by Application 2020 & 2033
- Table 73: Global Paper Bags Revenue million Forecast, by Application 2020 & 2033
- Table 74: Global Paper Bags Volume K Forecast, by Application 2020 & 2033
- Table 75: Global Paper Bags Revenue million Forecast, by Types 2020 & 2033
- Table 76: Global Paper Bags Volume K Forecast, by Types 2020 & 2033
- Table 77: Global Paper Bags Revenue million Forecast, by Country 2020 & 2033
- Table 78: Global Paper Bags Volume K Forecast, by Country 2020 & 2033
- Table 79: China Paper Bags Revenue (million) Forecast, by Application 2020 & 2033
- Table 80: China Paper Bags Volume (K) Forecast, by Application 2020 & 2033
- Table 81: India Paper Bags Revenue (million) Forecast, by Application 2020 & 2033
- Table 82: India Paper Bags Volume (K) Forecast, by Application 2020 & 2033
- Table 83: Japan Paper Bags Revenue (million) Forecast, by Application 2020 & 2033
- Table 84: Japan Paper Bags Volume (K) Forecast, by Application 2020 & 2033
- Table 85: South Korea Paper Bags Revenue (million) Forecast, by Application 2020 & 2033
- Table 86: South Korea Paper Bags Volume (K) Forecast, by Application 2020 & 2033
- Table 87: ASEAN Paper Bags Revenue (million) Forecast, by Application 2020 & 2033
- Table 88: ASEAN Paper Bags Volume (K) Forecast, by Application 2020 & 2033
- Table 89: Oceania Paper Bags Revenue (million) Forecast, by Application 2020 & 2033
- Table 90: Oceania Paper Bags Volume (K) Forecast, by Application 2020 & 2033
- Table 91: Rest of Asia Pacific Paper Bags Revenue (million) Forecast, by Application 2020 & 2033
- Table 92: Rest of Asia Pacific Paper Bags Volume (K) Forecast, by Application 2020 & 2033
Frequently Asked Questions
1. What is the projected Compound Annual Growth Rate (CAGR) of the Paper Bags?
The projected CAGR is approximately XX%.
2. Which companies are prominent players in the Paper Bags?
Key companies in the market include Mondi, Napco National, Shuaiba Industrial Company (K.P.S.C), NCC (National Company for Cement), OYKA, Taurus Packaging, Papyrus Paper Products LTD, Sacks Packaging, BillerudKorsnäs, Manchester Paper Bags, Go Green, Hotpack Packaging, Pack Tec Group, Kiki Bags Principal, Western Modern Pac, Huhtamaki Group.
3. What are the main segments of the Paper Bags?
The market segments include Application, Types.
4. Can you provide details about the market size?
The market size is estimated to be USD XXX million as of 2022.
5. What are some drivers contributing to market growth?
N/A
6. What are the notable trends driving market growth?
N/A
7. Are there any restraints impacting market growth?
N/A
8. Can you provide examples of recent developments in the market?
N/A
9. What pricing options are available for accessing the report?
Pricing options include single-user, multi-user, and enterprise licenses priced at USD 3350.00, USD 5025.00, and USD 6700.00 respectively.
10. Is the market size provided in terms of value or volume?
The market size is provided in terms of value, measured in million and volume, measured in K.
11. Are there any specific market keywords associated with the report?
Yes, the market keyword associated with the report is "Paper Bags," which aids in identifying and referencing the specific market segment covered.
12. How do I determine which pricing option suits my needs best?
The pricing options vary based on user requirements and access needs. Individual users may opt for single-user licenses, while businesses requiring broader access may choose multi-user or enterprise licenses for cost-effective access to the report.
13. Are there any additional resources or data provided in the Paper Bags report?
While the report offers comprehensive insights, it's advisable to review the specific contents or supplementary materials provided to ascertain if additional resources or data are available.
14. How can I stay updated on further developments or reports in the Paper Bags?
To stay informed about further developments, trends, and reports in the Paper Bags, consider subscribing to industry newsletters, following relevant companies and organizations, or regularly checking reputable industry news sources and publications.
Methodology
Step 1 - Identification of Relevant Samples Size from Population Database


Step 2 - Approaches for Defining Global Market Size (Value, Volume* & Price*)

Note*: In applicable scenarios
Step 3 - Data Sources
Primary Research
- Web Analytics
- Survey Reports
- Research Institute
- Latest Research Reports
- Opinion Leaders
Secondary Research
- Annual Reports
- White Paper
- Latest Press Release
- Industry Association
- Paid Database
- Investor Presentations

Step 4 - Data Triangulation
Involves using different sources of information in order to increase the validity of a study
These sources are likely to be stakeholders in a program - participants, other researchers, program staff, other community members, and so on.
Then we put all data in single framework & apply various statistical tools to find out the dynamic on the market.
During the analysis stage, feedback from the stakeholder groups would be compared to determine areas of agreement as well as areas of divergence