

Key Insights
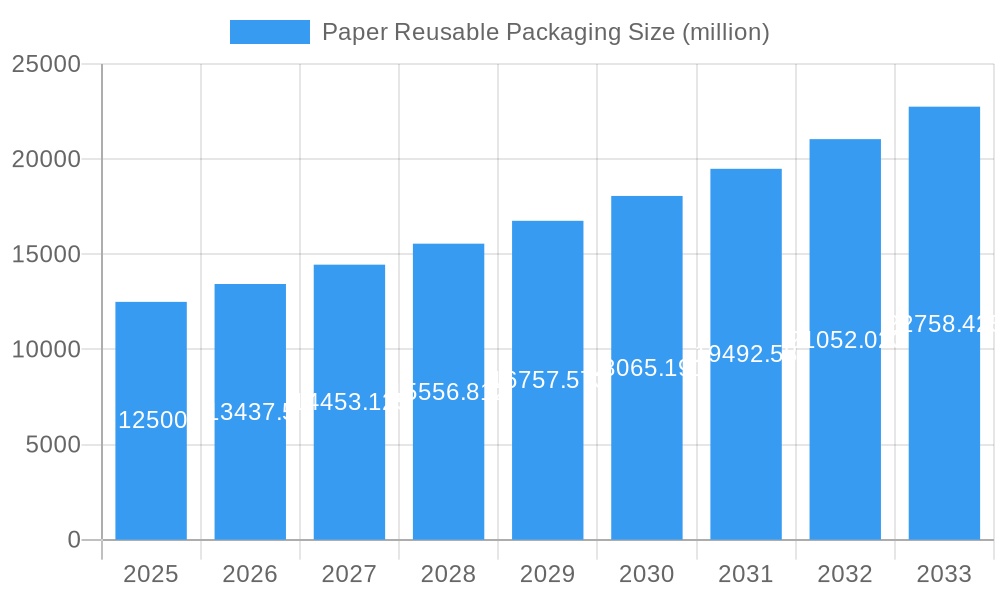
The global Paper Reusable Packaging market is experiencing robust expansion, driven by a significant surge in demand across diverse industries. With an estimated market size of approximately $12.5 billion in 2025, the sector is projected to grow at a Compound Annual Growth Rate (CAGR) of around 7.5% through 2033. This impressive trajectory is primarily fueled by increasing environmental consciousness and stringent government regulations advocating for sustainable packaging solutions. Industries such as Food and Beverage, FMCG, and Retail are at the forefront of adopting these eco-friendly alternatives, seeking to reduce their carbon footprint and appeal to a growing segment of environmentally aware consumers. The inherent recyclability and biodegradability of paper-based reusable packaging make it an attractive choice for businesses aiming to enhance their corporate social responsibility profiles and comply with evolving sustainability mandates. Furthermore, advancements in paper technology, leading to enhanced durability and moisture resistance, are steadily overcoming previous limitations, broadening the applicability of these packaging solutions.
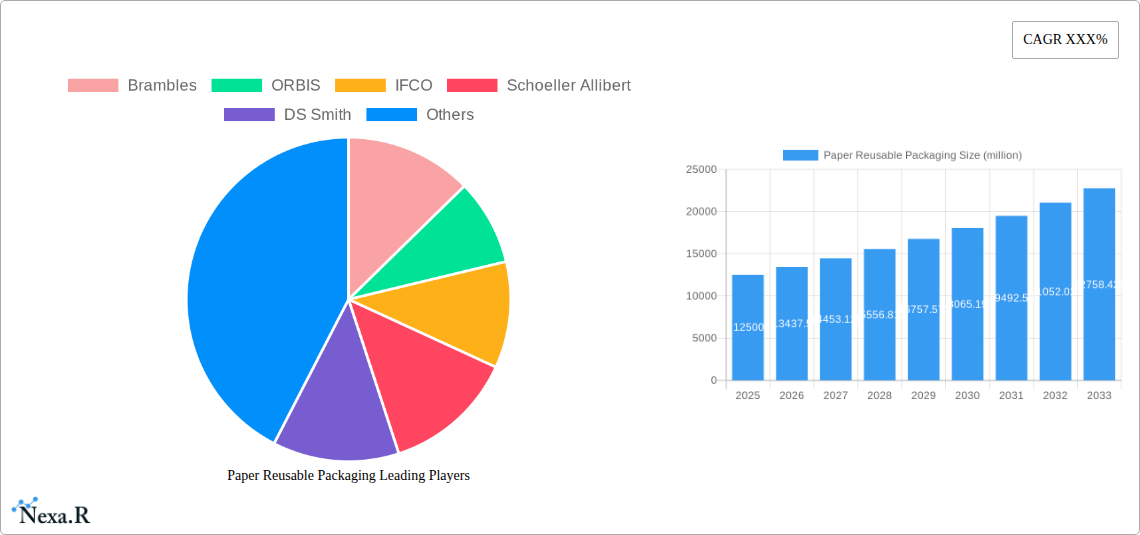
Paper Reusable Packaging Market Size (In Billion)
The market's growth is further propelled by innovations in design and material science, allowing paper reusable packaging to compete effectively with traditional plastic and metal alternatives in terms of performance and cost-effectiveness. Key applications like cartons and wrapping paper are witnessing substantial adoption, particularly in e-commerce logistics and supply chain management where efficient and sustainable solutions are paramount. While the market enjoys strong drivers, certain restraints, such as the initial investment costs for transitioning to new packaging systems and the need for robust collection and recycling infrastructure in some regions, need to be addressed for accelerated growth. However, the overarching trend towards a circular economy, coupled with strategic investments by major players like Brambles, ORBIS, and IFCO, is paving the way for sustained innovation and market penetration. The Asia Pacific region, with its burgeoning economies and increasing focus on environmental sustainability, is expected to emerge as a significant growth engine in the coming years, complementing the established markets in North America and Europe.
Paper Reusable Packaging Company Market Share
Paper Reusable Packaging Market Dynamics & Structure
The global paper reusable packaging market is characterized by a moderately concentrated landscape, with key players like Brambles, ORBIS, IFCO, Schoeller Allibert, DS Smith, Schutz, Tosca, Cabka Group, Rehrig Pacific Company, Craemer Group, IPL Plastics, Monoflo International, LOSCAM, Greystone Logistics, HOREN Group, Mpact Limited, Buckhorn, and RPP Containers actively shaping its trajectory. Technological innovation is a significant driver, with ongoing advancements in material science and design focused on enhancing durability, moisture resistance, and recyclability of paper-based packaging solutions. Regulatory frameworks, particularly those promoting sustainable sourcing and waste reduction, are increasingly pushing for the adoption of reusable alternatives across various industries.
- Market Concentration: Dominated by a few large multinational corporations and a growing number of specialized regional players.
- Technological Innovation: Focus on biodegradable coatings, enhanced structural integrity, and smart packaging features.
- Regulatory Influence: Growing pressure from governments and international bodies to reduce single-use plastic waste.
- Competitive Substitutes: While plastics remain a significant competitor, paper-based solutions are gaining traction due to their environmental profile.
- End-User Demographics: Increasing demand from environmentally conscious consumers and businesses seeking to improve their sustainability credentials.
- M&A Trends: Strategic acquisitions and partnerships are observed as companies aim to expand their product portfolios and geographical reach. For instance, the period saw approximately 5-7 significant M&A deals annually, primarily focused on acquiring innovative technologies or expanding into high-growth regions.
Paper Reusable Packaging Growth Trends & Insights
The paper reusable packaging market is poised for substantial growth, projected to expand from an estimated XX million units in 2025 to reach approximately YY million units by 2033, exhibiting a robust Compound Annual Growth Rate (CAGR) of ZZ% during the forecast period of 2025–2033. This upward trajectory is underpinned by a confluence of evolving consumer preferences, stringent environmental regulations, and a growing corporate commitment to sustainability initiatives. Historical data from 2019–2024 indicates a consistent, albeit slower, growth phase, with the market size growing from AA million units to BB million units, setting the stage for accelerated adoption.
Technological advancements are playing a pivotal role in this expansion. Innovations in paper-based materials are yielding packaging solutions that are increasingly durable, moisture-resistant, and capable of withstanding the rigors of multiple reuse cycles. This enhances their viability across a wider range of applications, challenging the dominance of traditional plastic alternatives. The development of specialized coatings and structural designs ensures that paper reusable packaging can effectively protect diverse products, from food and beverages to sensitive industrial components. For example, advancements in lignin-based barriers are improving water resistance, a key challenge for paper in certain applications.
Consumer behavior is another significant catalyst. There is a discernible shift towards conscious consumption, with a greater emphasis placed on the environmental impact of product packaging. This growing awareness translates into a preference for brands that demonstrate a commitment to sustainability, making paper reusable packaging an attractive proposition for businesses aiming to enhance their brand image and appeal to eco-conscious demographics. Furthermore, the increasing adoption of circular economy principles by industries worldwide is directly fueling the demand for reusable packaging solutions, including those made from paper.
The market penetration of paper reusable packaging, though still in its nascent stages compared to conventional materials, is rapidly increasing. As businesses become more aware of the long-term cost savings associated with reusable systems and the significant benefits to their environmental, social, and governance (ESG) profiles, adoption rates are expected to accelerate. The ability to integrate these solutions into existing supply chains with minimal disruption is also a key factor contributing to their growing acceptance. The market size evolution is a testament to this, moving from a niche segment to a mainstream alternative.
Dominant Regions, Countries, or Segments in Paper Reusable Packaging
The Food and Beverage application segment is unequivocally the dominant force driving growth in the global paper reusable packaging market. This supremacy is attributed to a synergistic combination of factors, including stringent food safety regulations that favor hygienic and easily cleanable packaging, growing consumer demand for sustainably packaged food products, and the increasing adoption of closed-loop systems within the food supply chain. The inherent recyclability and biodegradability of paper-based solutions align perfectly with the sustainability goals of the food and beverage industry, a sector under intense scrutiny regarding its environmental footprint.
The Food and Beverage segment is projected to account for a substantial market share, estimated at 30-35% of the total paper reusable packaging market by 2025, growing to an estimated 40-45% by 2033. This growth is further propelled by initiatives aimed at reducing single-use plastics in food service and retail, where paper reusable containers offer a viable and increasingly accepted alternative. For instance, reusable paper trays for fruits and vegetables, and durable paper-based crates for beverage distribution are becoming commonplace. The development of specialized, food-grade coatings for paper further enhances its suitability for this sensitive application.
- Key Drivers for Food and Beverage Dominance:
- Regulatory Push: Mandates to reduce plastic waste, especially in food contact applications.
- Consumer Preference: Growing demand for eco-friendly food packaging solutions.
- Supply Chain Efficiency: Reusable paper packaging facilitates efficient logistics and reduces transit damage.
- Hygiene Standards: Paper's ease of cleaning and sanitization meets high food safety requirements.
- Brand Image: Companies leverage sustainable packaging to enhance their corporate social responsibility (CSR) image.
Beyond Food and Beverage, the Retail and Wholesale segment also plays a crucial role, acting as a significant enabler for the adoption of paper reusable packaging across various product categories. Retailers are increasingly integrating reusable paper totes and display boxes to enhance in-store merchandising and streamline logistics. This segment’s growth is intertwined with the expansion of e-commerce, where durable and stackable paper reusable packaging solutions are vital for efficient order fulfillment and shipping, minimizing damage and returns. The Automotive and Industrial sectors are also emerging as significant growth areas, driven by the need for robust and returnable packaging for parts and components throughout their complex supply chains.
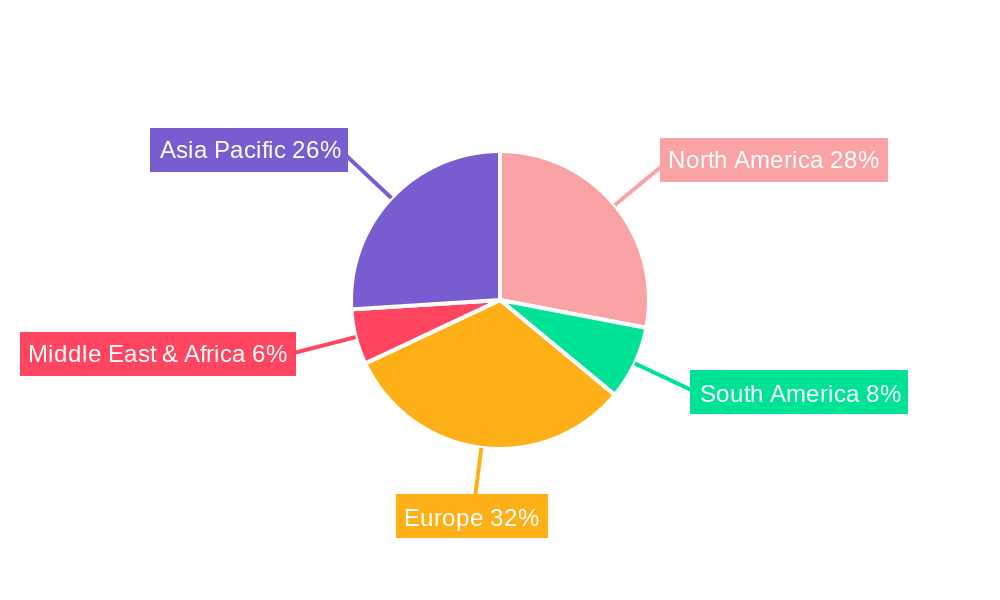
In terms of geographical dominance, Europe is currently leading the charge, driven by its ambitious sustainability targets and strong regulatory support for the circular economy. Countries like Germany, France, and the UK are at the forefront of implementing policies that encourage the adoption of reusable packaging solutions. North America is a close second, with increasing investment in sustainable packaging technologies and a growing consumer awareness of environmental issues. Asia-Pacific, while still in its developmental phase for paper reusable packaging, presents immense future growth potential due to its large consumer base and rapidly expanding industrial sectors.
Paper Reusable Packaging Product Landscape
The paper reusable packaging product landscape is characterized by a surge in innovative solutions designed for enhanced durability and sustainability. Key product developments include advanced multilayered paperboard cartons with improved moisture and grease resistance, utilizing bio-based coatings and laminates to extend their lifespan and broaden application scope. Wraps and liners made from recycled paper pulp offer a biodegradable alternative to plastic films, particularly for protecting delicate items in transit. The "Other" category encompasses specialized formats like molded pulp trays for electronics and reusable paper-based containers for industrial components, often engineered for high stackability and impact absorption.
Key Drivers, Barriers & Challenges in Paper Reusable Packaging
The paper reusable packaging market is propelled by significant key drivers, most notably the escalating global demand for sustainable and eco-friendly packaging solutions, driven by heightened consumer environmental awareness and stringent regulatory mandates aimed at curbing plastic waste. Technological advancements in paper material science, leading to more durable, moisture-resistant, and reusable paper-based products, are also crucial. Furthermore, the increasing emphasis on circular economy principles by businesses across industries is fostering a greater adoption of reusable packaging systems.
However, the market faces considerable barriers and challenges. The initial capital investment for reusable packaging systems and the associated logistics for collection and cleaning can be substantial, posing a hurdle for smaller businesses. The performance limitations of paper-based materials in certain extreme environmental conditions, such as high humidity or direct contact with liquids, remain a concern. Additionally, the established infrastructure and cost-effectiveness of single-use plastics continue to present a competitive challenge, alongside the need for greater standardization and consumer education to ensure proper handling and return of reusable packaging. Supply chain disruptions and the availability of high-quality recycled paper pulp can also impact production and cost.
Emerging Opportunities in Paper Reusable Packaging
Emerging opportunities in the paper reusable packaging sector lie in the development of highly specialized, application-specific solutions. This includes the creation of advanced, biodegradable barrier coatings that can further enhance the moisture and grease resistance of paper packaging, opening up new avenues in the food and beverage sector. The growing e-commerce market presents a significant opportunity for innovative, modular, and easily collapsible paper reusable packaging designs that optimize shipping space and reduce return logistics costs. Furthermore, the integration of smart technologies, such as RFID tags, into paper reusable packaging can enable better tracking and management of inventory, enhancing supply chain efficiency and contributing to a more circular economy. Untapped markets in developing economies also represent a substantial growth potential as sustainability awareness increases.
Growth Accelerators in the Paper Reusable Packaging Industry
Several catalysts are accelerating the growth of the paper reusable packaging industry. Technological breakthroughs in paper manufacturing and material science, leading to improved performance characteristics like enhanced durability and moisture resistance, are pivotal. Strategic partnerships between packaging manufacturers, logistics providers, and end-user industries are crucial for developing and scaling efficient reusable packaging systems. Market expansion strategies, including geographical diversification and penetration into new application segments, are also driving growth. Moreover, increasing government incentives and favorable policies promoting the adoption of circular economy solutions, such as tax breaks or subsidies for reusable packaging, act as significant growth accelerators.
Key Players Shaping the Paper Reusable Packaging Market
- Brambles
- ORBIS
- IFCO
- Schoeller Allibert
- DS Smith
- Schutz
- Tosca
- Cabka Group
- Rehrig Pacific Company
- Craemer Group
- IPL Plastics
- Monoflo International
- LOSCAM
- Greystone Logistics
- HOREN Group
- Mpact Limited
- Buckhorn
- RPP Containers
Notable Milestones in Paper Reusable Packaging Sector
- 2022 Q3: DS Smith launches a new range of high-strength, water-resistant corrugated packaging for the fresh produce market, enhancing reusability.
- 2023 Q1: Schoeller Allibert announces significant investment in R&D for bio-based and biodegradable reusable packaging solutions.
- 2023 Q2: Brambles expands its reusable packaging services in the European FMCG sector, focusing on optimized return logistics.
- 2023 Q4: IFCO introduces enhanced cleaning and sanitization protocols for its reusable plastic containers, also impacting paper-based alternatives in shared logistics.
- 2024 Q1: ORBIS acquires a specialized paper packaging manufacturer to broaden its sustainable solutions portfolio.
- 2024 Q2: Several industry associations collaborate to establish new standards for paper reusable packaging durability and recyclability.
In-Depth Paper Reusable Packaging Market Outlook
The future outlook for the paper reusable packaging market is exceptionally promising, fueled by an irreversible global shift towards sustainability and the circular economy. Growth accelerators, including continuous innovation in material science yielding superior product performance and strategic collaborations across the value chain, are expected to drive market expansion. The increasing alignment of regulatory landscapes with environmental objectives and evolving consumer preferences for eco-conscious brands will continue to foster widespread adoption. Opportunities abound in niche applications and emerging markets, with the potential for significant market penetration in the coming years. The industry is set to witness substantial growth driven by its ability to offer both environmental benefits and long-term economic advantages.
Paper Reusable Packaging Segmentation
-
1. Application
- 1.1. Food and Beverage
- 1.2. Automotive
- 1.3. FMCG
- 1.4. Retail and Wholesale
- 1.5. Industrial
- 1.6. Healthcare and Pharma
- 1.7. Others
-
2. Type
- 2.1. Carton
- 2.2. Wrapping Paper
- 2.3. Other
Paper Reusable Packaging Segmentation By Geography
-
1. North America
- 1.1. United States
- 1.2. Canada
- 1.3. Mexico
-
2. South America
- 2.1. Brazil
- 2.2. Argentina
- 2.3. Rest of South America
-
3. Europe
- 3.1. United Kingdom
- 3.2. Germany
- 3.3. France
- 3.4. Italy
- 3.5. Spain
- 3.6. Russia
- 3.7. Benelux
- 3.8. Nordics
- 3.9. Rest of Europe
-
4. Middle East & Africa
- 4.1. Turkey
- 4.2. Israel
- 4.3. GCC
- 4.4. North Africa
- 4.5. South Africa
- 4.6. Rest of Middle East & Africa
-
5. Asia Pacific
- 5.1. China
- 5.2. India
- 5.3. Japan
- 5.4. South Korea
- 5.5. ASEAN
- 5.6. Oceania
- 5.7. Rest of Asia Pacific
Paper Reusable Packaging Regional Market Share
Geographic Coverage of Paper Reusable Packaging
Paper Reusable Packaging REPORT HIGHLIGHTS
| Aspects | Details |
|---|---|
| Study Period | 2020-2034 |
| Base Year | 2025 |
| Estimated Year | 2026 |
| Forecast Period | 2026-2034 |
| Historical Period | 2020-2025 |
| Growth Rate | CAGR of XXX% from 2020-2034 |
| Segmentation |
|
Table of Contents
- 1. Introduction
- 1.1. Research Scope
- 1.2. Market Segmentation
- 1.3. Research Methodology
- 1.4. Definitions and Assumptions
- 2. Executive Summary
- 2.1. Introduction
- 3. Market Dynamics
- 3.1. Introduction
- 3.2. Market Drivers
- 3.3. Market Restrains
- 3.4. Market Trends
- 4. Market Factor Analysis
- 4.1. Porters Five Forces
- 4.2. Supply/Value Chain
- 4.3. PESTEL analysis
- 4.4. Market Entropy
- 4.5. Patent/Trademark Analysis
- 5. Global Paper Reusable Packaging Analysis, Insights and Forecast, 2020-2032
- 5.1. Market Analysis, Insights and Forecast - by Application
- 5.1.1. Food and Beverage
- 5.1.2. Automotive
- 5.1.3. FMCG
- 5.1.4. Retail and Wholesale
- 5.1.5. Industrial
- 5.1.6. Healthcare and Pharma
- 5.1.7. Others
- 5.2. Market Analysis, Insights and Forecast - by Type
- 5.2.1. Carton
- 5.2.2. Wrapping Paper
- 5.2.3. Other
- 5.3. Market Analysis, Insights and Forecast - by Region
- 5.3.1. North America
- 5.3.2. South America
- 5.3.3. Europe
- 5.3.4. Middle East & Africa
- 5.3.5. Asia Pacific
- 5.1. Market Analysis, Insights and Forecast - by Application
- 6. North America Paper Reusable Packaging Analysis, Insights and Forecast, 2020-2032
- 6.1. Market Analysis, Insights and Forecast - by Application
- 6.1.1. Food and Beverage
- 6.1.2. Automotive
- 6.1.3. FMCG
- 6.1.4. Retail and Wholesale
- 6.1.5. Industrial
- 6.1.6. Healthcare and Pharma
- 6.1.7. Others
- 6.2. Market Analysis, Insights and Forecast - by Type
- 6.2.1. Carton
- 6.2.2. Wrapping Paper
- 6.2.3. Other
- 6.1. Market Analysis, Insights and Forecast - by Application
- 7. South America Paper Reusable Packaging Analysis, Insights and Forecast, 2020-2032
- 7.1. Market Analysis, Insights and Forecast - by Application
- 7.1.1. Food and Beverage
- 7.1.2. Automotive
- 7.1.3. FMCG
- 7.1.4. Retail and Wholesale
- 7.1.5. Industrial
- 7.1.6. Healthcare and Pharma
- 7.1.7. Others
- 7.2. Market Analysis, Insights and Forecast - by Type
- 7.2.1. Carton
- 7.2.2. Wrapping Paper
- 7.2.3. Other
- 7.1. Market Analysis, Insights and Forecast - by Application
- 8. Europe Paper Reusable Packaging Analysis, Insights and Forecast, 2020-2032
- 8.1. Market Analysis, Insights and Forecast - by Application
- 8.1.1. Food and Beverage
- 8.1.2. Automotive
- 8.1.3. FMCG
- 8.1.4. Retail and Wholesale
- 8.1.5. Industrial
- 8.1.6. Healthcare and Pharma
- 8.1.7. Others
- 8.2. Market Analysis, Insights and Forecast - by Type
- 8.2.1. Carton
- 8.2.2. Wrapping Paper
- 8.2.3. Other
- 8.1. Market Analysis, Insights and Forecast - by Application
- 9. Middle East & Africa Paper Reusable Packaging Analysis, Insights and Forecast, 2020-2032
- 9.1. Market Analysis, Insights and Forecast - by Application
- 9.1.1. Food and Beverage
- 9.1.2. Automotive
- 9.1.3. FMCG
- 9.1.4. Retail and Wholesale
- 9.1.5. Industrial
- 9.1.6. Healthcare and Pharma
- 9.1.7. Others
- 9.2. Market Analysis, Insights and Forecast - by Type
- 9.2.1. Carton
- 9.2.2. Wrapping Paper
- 9.2.3. Other
- 9.1. Market Analysis, Insights and Forecast - by Application
- 10. Asia Pacific Paper Reusable Packaging Analysis, Insights and Forecast, 2020-2032
- 10.1. Market Analysis, Insights and Forecast - by Application
- 10.1.1. Food and Beverage
- 10.1.2. Automotive
- 10.1.3. FMCG
- 10.1.4. Retail and Wholesale
- 10.1.5. Industrial
- 10.1.6. Healthcare and Pharma
- 10.1.7. Others
- 10.2. Market Analysis, Insights and Forecast - by Type
- 10.2.1. Carton
- 10.2.2. Wrapping Paper
- 10.2.3. Other
- 10.1. Market Analysis, Insights and Forecast - by Application
- 11. Competitive Analysis
- 11.1. Global Market Share Analysis 2025
- 11.2. Company Profiles
- 11.2.1 Brambles
- 11.2.1.1. Overview
- 11.2.1.2. Products
- 11.2.1.3. SWOT Analysis
- 11.2.1.4. Recent Developments
- 11.2.1.5. Financials (Based on Availability)
- 11.2.2 ORBIS
- 11.2.2.1. Overview
- 11.2.2.2. Products
- 11.2.2.3. SWOT Analysis
- 11.2.2.4. Recent Developments
- 11.2.2.5. Financials (Based on Availability)
- 11.2.3 IFCO
- 11.2.3.1. Overview
- 11.2.3.2. Products
- 11.2.3.3. SWOT Analysis
- 11.2.3.4. Recent Developments
- 11.2.3.5. Financials (Based on Availability)
- 11.2.4 Schoeller Allibert
- 11.2.4.1. Overview
- 11.2.4.2. Products
- 11.2.4.3. SWOT Analysis
- 11.2.4.4. Recent Developments
- 11.2.4.5. Financials (Based on Availability)
- 11.2.5 DS Smith
- 11.2.5.1. Overview
- 11.2.5.2. Products
- 11.2.5.3. SWOT Analysis
- 11.2.5.4. Recent Developments
- 11.2.5.5. Financials (Based on Availability)
- 11.2.6 Schutz
- 11.2.6.1. Overview
- 11.2.6.2. Products
- 11.2.6.3. SWOT Analysis
- 11.2.6.4. Recent Developments
- 11.2.6.5. Financials (Based on Availability)
- 11.2.7 Tosca
- 11.2.7.1. Overview
- 11.2.7.2. Products
- 11.2.7.3. SWOT Analysis
- 11.2.7.4. Recent Developments
- 11.2.7.5. Financials (Based on Availability)
- 11.2.8 Cabka Group
- 11.2.8.1. Overview
- 11.2.8.2. Products
- 11.2.8.3. SWOT Analysis
- 11.2.8.4. Recent Developments
- 11.2.8.5. Financials (Based on Availability)
- 11.2.9 Rehrig Pacific Company
- 11.2.9.1. Overview
- 11.2.9.2. Products
- 11.2.9.3. SWOT Analysis
- 11.2.9.4. Recent Developments
- 11.2.9.5. Financials (Based on Availability)
- 11.2.10 Craemer Group
- 11.2.10.1. Overview
- 11.2.10.2. Products
- 11.2.10.3. SWOT Analysis
- 11.2.10.4. Recent Developments
- 11.2.10.5. Financials (Based on Availability)
- 11.2.11 IPL Plastics
- 11.2.11.1. Overview
- 11.2.11.2. Products
- 11.2.11.3. SWOT Analysis
- 11.2.11.4. Recent Developments
- 11.2.11.5. Financials (Based on Availability)
- 11.2.12 Monoflo International
- 11.2.12.1. Overview
- 11.2.12.2. Products
- 11.2.12.3. SWOT Analysis
- 11.2.12.4. Recent Developments
- 11.2.12.5. Financials (Based on Availability)
- 11.2.13 LOSCAM
- 11.2.13.1. Overview
- 11.2.13.2. Products
- 11.2.13.3. SWOT Analysis
- 11.2.13.4. Recent Developments
- 11.2.13.5. Financials (Based on Availability)
- 11.2.14 Greystone Logistics
- 11.2.14.1. Overview
- 11.2.14.2. Products
- 11.2.14.3. SWOT Analysis
- 11.2.14.4. Recent Developments
- 11.2.14.5. Financials (Based on Availability)
- 11.2.15 HOREN Group
- 11.2.15.1. Overview
- 11.2.15.2. Products
- 11.2.15.3. SWOT Analysis
- 11.2.15.4. Recent Developments
- 11.2.15.5. Financials (Based on Availability)
- 11.2.16 Mpact Limited
- 11.2.16.1. Overview
- 11.2.16.2. Products
- 11.2.16.3. SWOT Analysis
- 11.2.16.4. Recent Developments
- 11.2.16.5. Financials (Based on Availability)
- 11.2.17 Buckhorn
- 11.2.17.1. Overview
- 11.2.17.2. Products
- 11.2.17.3. SWOT Analysis
- 11.2.17.4. Recent Developments
- 11.2.17.5. Financials (Based on Availability)
- 11.2.18 RPP Containers
- 11.2.18.1. Overview
- 11.2.18.2. Products
- 11.2.18.3. SWOT Analysis
- 11.2.18.4. Recent Developments
- 11.2.18.5. Financials (Based on Availability)
- 11.2.1 Brambles
List of Figures
- Figure 1: Global Paper Reusable Packaging Revenue Breakdown (million, %) by Region 2025 & 2033
- Figure 2: North America Paper Reusable Packaging Revenue (million), by Application 2025 & 2033
- Figure 3: North America Paper Reusable Packaging Revenue Share (%), by Application 2025 & 2033
- Figure 4: North America Paper Reusable Packaging Revenue (million), by Type 2025 & 2033
- Figure 5: North America Paper Reusable Packaging Revenue Share (%), by Type 2025 & 2033
- Figure 6: North America Paper Reusable Packaging Revenue (million), by Country 2025 & 2033
- Figure 7: North America Paper Reusable Packaging Revenue Share (%), by Country 2025 & 2033
- Figure 8: South America Paper Reusable Packaging Revenue (million), by Application 2025 & 2033
- Figure 9: South America Paper Reusable Packaging Revenue Share (%), by Application 2025 & 2033
- Figure 10: South America Paper Reusable Packaging Revenue (million), by Type 2025 & 2033
- Figure 11: South America Paper Reusable Packaging Revenue Share (%), by Type 2025 & 2033
- Figure 12: South America Paper Reusable Packaging Revenue (million), by Country 2025 & 2033
- Figure 13: South America Paper Reusable Packaging Revenue Share (%), by Country 2025 & 2033
- Figure 14: Europe Paper Reusable Packaging Revenue (million), by Application 2025 & 2033
- Figure 15: Europe Paper Reusable Packaging Revenue Share (%), by Application 2025 & 2033
- Figure 16: Europe Paper Reusable Packaging Revenue (million), by Type 2025 & 2033
- Figure 17: Europe Paper Reusable Packaging Revenue Share (%), by Type 2025 & 2033
- Figure 18: Europe Paper Reusable Packaging Revenue (million), by Country 2025 & 2033
- Figure 19: Europe Paper Reusable Packaging Revenue Share (%), by Country 2025 & 2033
- Figure 20: Middle East & Africa Paper Reusable Packaging Revenue (million), by Application 2025 & 2033
- Figure 21: Middle East & Africa Paper Reusable Packaging Revenue Share (%), by Application 2025 & 2033
- Figure 22: Middle East & Africa Paper Reusable Packaging Revenue (million), by Type 2025 & 2033
- Figure 23: Middle East & Africa Paper Reusable Packaging Revenue Share (%), by Type 2025 & 2033
- Figure 24: Middle East & Africa Paper Reusable Packaging Revenue (million), by Country 2025 & 2033
- Figure 25: Middle East & Africa Paper Reusable Packaging Revenue Share (%), by Country 2025 & 2033
- Figure 26: Asia Pacific Paper Reusable Packaging Revenue (million), by Application 2025 & 2033
- Figure 27: Asia Pacific Paper Reusable Packaging Revenue Share (%), by Application 2025 & 2033
- Figure 28: Asia Pacific Paper Reusable Packaging Revenue (million), by Type 2025 & 2033
- Figure 29: Asia Pacific Paper Reusable Packaging Revenue Share (%), by Type 2025 & 2033
- Figure 30: Asia Pacific Paper Reusable Packaging Revenue (million), by Country 2025 & 2033
- Figure 31: Asia Pacific Paper Reusable Packaging Revenue Share (%), by Country 2025 & 2033
List of Tables
- Table 1: Global Paper Reusable Packaging Revenue million Forecast, by Application 2020 & 2033
- Table 2: Global Paper Reusable Packaging Revenue million Forecast, by Type 2020 & 2033
- Table 3: Global Paper Reusable Packaging Revenue million Forecast, by Region 2020 & 2033
- Table 4: Global Paper Reusable Packaging Revenue million Forecast, by Application 2020 & 2033
- Table 5: Global Paper Reusable Packaging Revenue million Forecast, by Type 2020 & 2033
- Table 6: Global Paper Reusable Packaging Revenue million Forecast, by Country 2020 & 2033
- Table 7: United States Paper Reusable Packaging Revenue (million) Forecast, by Application 2020 & 2033
- Table 8: Canada Paper Reusable Packaging Revenue (million) Forecast, by Application 2020 & 2033
- Table 9: Mexico Paper Reusable Packaging Revenue (million) Forecast, by Application 2020 & 2033
- Table 10: Global Paper Reusable Packaging Revenue million Forecast, by Application 2020 & 2033
- Table 11: Global Paper Reusable Packaging Revenue million Forecast, by Type 2020 & 2033
- Table 12: Global Paper Reusable Packaging Revenue million Forecast, by Country 2020 & 2033
- Table 13: Brazil Paper Reusable Packaging Revenue (million) Forecast, by Application 2020 & 2033
- Table 14: Argentina Paper Reusable Packaging Revenue (million) Forecast, by Application 2020 & 2033
- Table 15: Rest of South America Paper Reusable Packaging Revenue (million) Forecast, by Application 2020 & 2033
- Table 16: Global Paper Reusable Packaging Revenue million Forecast, by Application 2020 & 2033
- Table 17: Global Paper Reusable Packaging Revenue million Forecast, by Type 2020 & 2033
- Table 18: Global Paper Reusable Packaging Revenue million Forecast, by Country 2020 & 2033
- Table 19: United Kingdom Paper Reusable Packaging Revenue (million) Forecast, by Application 2020 & 2033
- Table 20: Germany Paper Reusable Packaging Revenue (million) Forecast, by Application 2020 & 2033
- Table 21: France Paper Reusable Packaging Revenue (million) Forecast, by Application 2020 & 2033
- Table 22: Italy Paper Reusable Packaging Revenue (million) Forecast, by Application 2020 & 2033
- Table 23: Spain Paper Reusable Packaging Revenue (million) Forecast, by Application 2020 & 2033
- Table 24: Russia Paper Reusable Packaging Revenue (million) Forecast, by Application 2020 & 2033
- Table 25: Benelux Paper Reusable Packaging Revenue (million) Forecast, by Application 2020 & 2033
- Table 26: Nordics Paper Reusable Packaging Revenue (million) Forecast, by Application 2020 & 2033
- Table 27: Rest of Europe Paper Reusable Packaging Revenue (million) Forecast, by Application 2020 & 2033
- Table 28: Global Paper Reusable Packaging Revenue million Forecast, by Application 2020 & 2033
- Table 29: Global Paper Reusable Packaging Revenue million Forecast, by Type 2020 & 2033
- Table 30: Global Paper Reusable Packaging Revenue million Forecast, by Country 2020 & 2033
- Table 31: Turkey Paper Reusable Packaging Revenue (million) Forecast, by Application 2020 & 2033
- Table 32: Israel Paper Reusable Packaging Revenue (million) Forecast, by Application 2020 & 2033
- Table 33: GCC Paper Reusable Packaging Revenue (million) Forecast, by Application 2020 & 2033
- Table 34: North Africa Paper Reusable Packaging Revenue (million) Forecast, by Application 2020 & 2033
- Table 35: South Africa Paper Reusable Packaging Revenue (million) Forecast, by Application 2020 & 2033
- Table 36: Rest of Middle East & Africa Paper Reusable Packaging Revenue (million) Forecast, by Application 2020 & 2033
- Table 37: Global Paper Reusable Packaging Revenue million Forecast, by Application 2020 & 2033
- Table 38: Global Paper Reusable Packaging Revenue million Forecast, by Type 2020 & 2033
- Table 39: Global Paper Reusable Packaging Revenue million Forecast, by Country 2020 & 2033
- Table 40: China Paper Reusable Packaging Revenue (million) Forecast, by Application 2020 & 2033
- Table 41: India Paper Reusable Packaging Revenue (million) Forecast, by Application 2020 & 2033
- Table 42: Japan Paper Reusable Packaging Revenue (million) Forecast, by Application 2020 & 2033
- Table 43: South Korea Paper Reusable Packaging Revenue (million) Forecast, by Application 2020 & 2033
- Table 44: ASEAN Paper Reusable Packaging Revenue (million) Forecast, by Application 2020 & 2033
- Table 45: Oceania Paper Reusable Packaging Revenue (million) Forecast, by Application 2020 & 2033
- Table 46: Rest of Asia Pacific Paper Reusable Packaging Revenue (million) Forecast, by Application 2020 & 2033
Frequently Asked Questions
1. What is the projected Compound Annual Growth Rate (CAGR) of the Paper Reusable Packaging?
The projected CAGR is approximately XXX%.
2. Which companies are prominent players in the Paper Reusable Packaging?
Key companies in the market include Brambles, ORBIS, IFCO, Schoeller Allibert, DS Smith, Schutz, Tosca, Cabka Group, Rehrig Pacific Company, Craemer Group, IPL Plastics, Monoflo International, LOSCAM, Greystone Logistics, HOREN Group, Mpact Limited, Buckhorn, RPP Containers.
3. What are the main segments of the Paper Reusable Packaging?
The market segments include Application, Type.
4. Can you provide details about the market size?
The market size is estimated to be USD XXX million as of 2022.
5. What are some drivers contributing to market growth?
N/A
6. What are the notable trends driving market growth?
N/A
7. Are there any restraints impacting market growth?
N/A
8. Can you provide examples of recent developments in the market?
N/A
9. What pricing options are available for accessing the report?
Pricing options include single-user, multi-user, and enterprise licenses priced at USD 2900.00, USD 4350.00, and USD 5800.00 respectively.
10. Is the market size provided in terms of value or volume?
The market size is provided in terms of value, measured in million.
11. Are there any specific market keywords associated with the report?
Yes, the market keyword associated with the report is "Paper Reusable Packaging," which aids in identifying and referencing the specific market segment covered.
12. How do I determine which pricing option suits my needs best?
The pricing options vary based on user requirements and access needs. Individual users may opt for single-user licenses, while businesses requiring broader access may choose multi-user or enterprise licenses for cost-effective access to the report.
13. Are there any additional resources or data provided in the Paper Reusable Packaging report?
While the report offers comprehensive insights, it's advisable to review the specific contents or supplementary materials provided to ascertain if additional resources or data are available.
14. How can I stay updated on further developments or reports in the Paper Reusable Packaging?
To stay informed about further developments, trends, and reports in the Paper Reusable Packaging, consider subscribing to industry newsletters, following relevant companies and organizations, or regularly checking reputable industry news sources and publications.
Methodology
Step 1 - Identification of Relevant Samples Size from Population Database


Step 2 - Approaches for Defining Global Market Size (Value, Volume* & Price*)

Note*: In applicable scenarios
Step 3 - Data Sources
Primary Research
- Web Analytics
- Survey Reports
- Research Institute
- Latest Research Reports
- Opinion Leaders
Secondary Research
- Annual Reports
- White Paper
- Latest Press Release
- Industry Association
- Paid Database
- Investor Presentations

Step 4 - Data Triangulation
Involves using different sources of information in order to increase the validity of a study
These sources are likely to be stakeholders in a program - participants, other researchers, program staff, other community members, and so on.
Then we put all data in single framework & apply various statistical tools to find out the dynamic on the market.
During the analysis stage, feedback from the stakeholder groups would be compared to determine areas of agreement as well as areas of divergence