

Key Insights
The global petrochemical packaging market is poised for significant expansion, fueled by the robust growth of the petrochemical industry and the escalating need for secure and effective packaging. The market, valued at $700.05 billion in the base year 2025, is projected to achieve a Compound Annual Growth Rate (CAGR) of 5.7%. Key growth drivers include a rising global population, which translates to increased demand for plastics and chemicals, stringent regulations mandating safe handling and transport of hazardous materials, and innovations in packaging technology that improve product preservation and sustainability. Major market segments like drums, intermediate bulk containers (IBCs), and flexible packaging are each exhibiting distinct growth trajectories influenced by their end-use applications and evolving consumer preferences. The competitive landscape features prominent companies such as Greif Inc., Mauser Packaging Solutions, and Berry Global Inc., actively pursuing innovation and expansion. However, the market faces challenges from volatile raw material costs and growing concerns over plastic waste, driving a shift towards eco-friendly alternatives like biodegradable and recyclable materials.
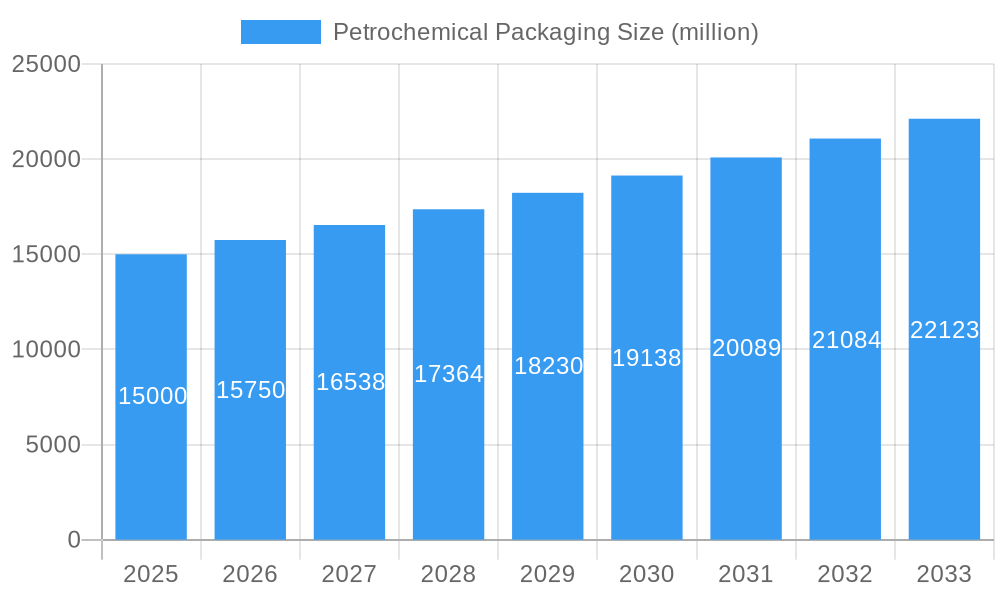
Petrochemical Packaging Market Size (In Billion)
Geographically, the petrochemical packaging sector anticipates varied growth patterns. North America and Europe will retain substantial market shares, while Asia-Pacific and the Middle East are expected to experience accelerated growth due to rapid industrialization and infrastructure development. A significant trend emerging is the demand for tailored packaging solutions that address specific client requirements, with an increased emphasis on enhanced safety features and optimized logistics. The integration of advanced manufacturing and supply chain technologies is crucial for improving production efficiency and lowering operational expenses. Companies are prioritizing research and development to engineer innovative packaging materials that boost performance, elevate safety standards, and reduce environmental impact, thereby cultivating a sustainable market trajectory.
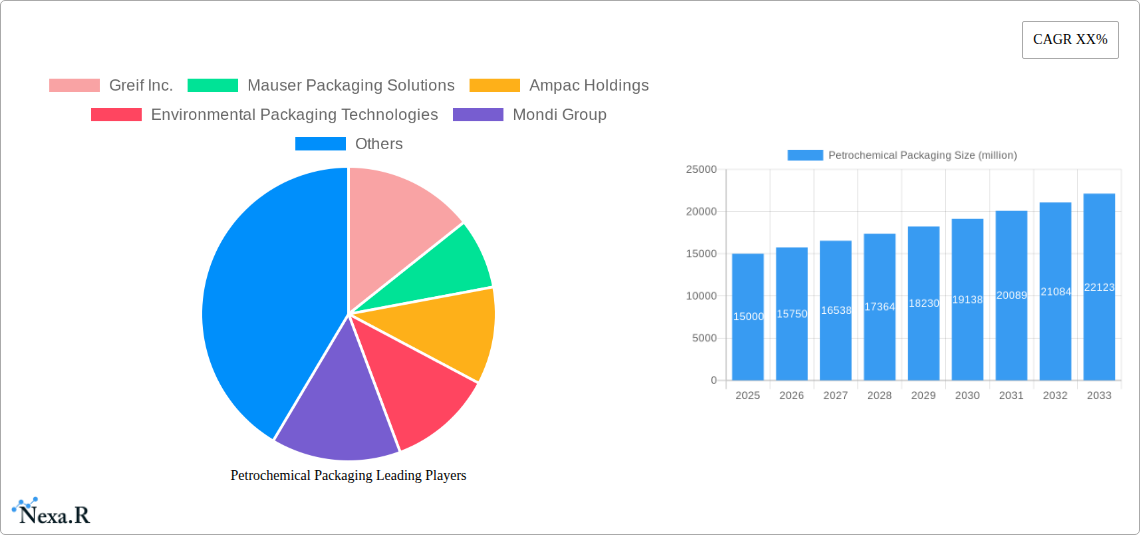
Petrochemical Packaging Company Market Share
Petrochemical Packaging Market Report: 2019-2033
This comprehensive report provides an in-depth analysis of the global petrochemical packaging market, covering the period 2019-2033. With a focus on market dynamics, growth trends, key players, and future opportunities, this report is an invaluable resource for industry professionals, investors, and strategic decision-makers. The report leverages extensive primary and secondary research to deliver actionable insights and forecasts, supporting informed business strategies within this dynamic sector. The base year for this report is 2025, with the estimated year also being 2025, and a forecast period spanning 2025-2033. The historical period analyzed is 2019-2024. The market is segmented by packaging type (drums, IBCs, pails, etc.), material (plastic, metal, etc.), and end-use industry (petrochemicals, chemicals, etc.).
Petrochemical Packaging Market Dynamics & Structure
The global petrochemical packaging market is characterized by a moderately concentrated landscape, with several large multinational corporations holding significant market share. The market size in 2025 is estimated at xx million units. Technological innovation, particularly in materials science and packaging design, is a key driver, alongside evolving regulatory frameworks focused on sustainability and safety. Competitive product substitutes, such as bulk transportation, also influence market dynamics. M&A activity is prevalent, with larger players consolidating their position through acquisitions.
- Market Concentration: The top 5 players hold approximately xx% of the market share in 2025.
- Technological Innovation: Focus on lightweighting, improved barrier properties, and sustainable materials is driving innovation.
- Regulatory Framework: Stringent regulations concerning hazardous material transportation and environmental impact influence packaging choices.
- Competitive Substitutes: Bulk transportation poses a challenge, particularly for large-volume applications.
- End-User Demographics: Growth is driven by the expansion of the petrochemical and related industries, particularly in developing economies.
- M&A Trends: Consolidation is expected to continue, with xx major M&A deals anticipated between 2025 and 2033.
Petrochemical Packaging Growth Trends & Insights
The petrochemical packaging market exhibits robust growth, driven by factors such as the increasing demand for petrochemicals globally, the need for safe and efficient transportation and storage, and advancements in packaging technologies. The market experienced a CAGR of xx% during the historical period (2019-2024), with a projected CAGR of xx% from 2025 to 2033. Market penetration is expected to reach xx% by 2033. Technological disruptions, such as the adoption of smart packaging and improved automation in the packaging supply chain, significantly influence market growth. Consumer behavior shifts towards sustainability are also prompting the adoption of eco-friendly packaging solutions. The total addressable market (TAM) is expected to reach xx million units by 2033.
Dominant Regions, Countries, or Segments in Petrochemical Packaging
The Asia-Pacific region dominates the petrochemical packaging market, driven by rapid industrialization and rising petrochemical production in countries like China and India. North America and Europe also hold significant market shares, reflecting established petrochemical industries and advanced packaging technologies. The drums segment holds the largest market share due to its widespread use for transporting a variety of petrochemicals.
- Key Drivers in Asia-Pacific: Rapid industrialization, increasing petrochemical production, and growing demand for packaging solutions.
- Key Drivers in North America: Strong domestic petrochemical production, advanced packaging technologies, and stringent environmental regulations.
- Key Drivers in Europe: Established petrochemical industry, focus on sustainable packaging, and increasing regulations.
- Market Share: Asia-Pacific holds approximately xx% of the global market share in 2025.
Petrochemical Packaging Product Landscape
Petrochemical packaging encompasses a diverse range of products, including drums, intermediate bulk containers (IBCs), pails, and flexible packaging. Recent innovations focus on lightweighting, enhanced barrier properties to prevent leakage and contamination, and the use of sustainable materials like recycled plastics and bioplastics. These advancements offer improved performance metrics, including increased durability, reduced environmental impact, and enhanced safety features. Unique selling propositions include tamper-evident seals and advanced tracking technologies.
Key Drivers, Barriers & Challenges in Petrochemical Packaging
Key Drivers:
- Increasing demand for petrochemicals
- Growth of the chemical industry
- Advancements in packaging technology
- Stringent regulations driving safer packaging solutions
Key Challenges:
- Fluctuations in raw material prices
- Environmental concerns and the need for sustainable packaging
- Intense competition among packaging providers
- Supply chain disruptions impacting timely delivery
Emerging Opportunities in Petrochemical Packaging
Emerging opportunities include the growing adoption of smart packaging technologies (sensors, RFID tags), the increasing demand for sustainable and eco-friendly packaging options, and the expansion into emerging markets with growing petrochemical industries. Opportunities also exist in developing specialized packaging solutions for niche applications and advanced material innovations.
Growth Accelerators in the Petrochemical Packaging Industry
Long-term growth is fueled by technological advancements such as the development of high-barrier films and lightweight containers. Strategic partnerships between packaging companies and petrochemical producers will accelerate market expansion. Expansion into new geographical markets and the adoption of circular economy principles (recycling, reuse) are also crucial for future growth.
Key Players Shaping the Petrochemical Packaging Market
- Greif Inc.
- Mauser Packaging Solutions
- Ampac Holdings
- Environmental Packaging Technologies
- Mondi Group
- CL Smith
- SCHUTZ GmbH & Co. KGaA
- BWAY Corporation
- Industrial Container Services
- Berry Global Inc.
- Rak Petropack
- New Pig
Notable Milestones in Petrochemical Packaging Sector
- 2020: Introduction of a new biodegradable IBC by Mauser Packaging Solutions.
- 2021: Greif Inc. announces a major investment in recycled plastic resin production.
- 2022: Berry Global Inc. launches a range of sustainable packaging solutions.
- 2023: Ampac Holdings acquires a smaller packaging company, expanding its market reach.
In-Depth Petrochemical Packaging Market Outlook
The petrochemical packaging market is poised for sustained growth, driven by several key factors, including the increasing demand for petrochemicals, technological innovations leading to more efficient and sustainable packaging solutions, and the expansion into new and developing markets. Strategic partnerships and investments in sustainable materials and manufacturing processes will further shape the market's trajectory. The market presents substantial opportunities for companies that can effectively navigate the regulatory landscape, innovate in packaging materials, and adapt to evolving customer needs.
Petrochemical Packaging Segmentation
-
1. Application
- 1.1. Olefins
- 1.2. Aromatics
- 1.3. Others
-
2. Types
- 2.1. Flexible Packaging
- 2.2. Rigid Packaging
Petrochemical Packaging Segmentation By Geography
-
1. North America
- 1.1. United States
- 1.2. Canada
- 1.3. Mexico
-
2. South America
- 2.1. Brazil
- 2.2. Argentina
- 2.3. Rest of South America
-
3. Europe
- 3.1. United Kingdom
- 3.2. Germany
- 3.3. France
- 3.4. Italy
- 3.5. Spain
- 3.6. Russia
- 3.7. Benelux
- 3.8. Nordics
- 3.9. Rest of Europe
-
4. Middle East & Africa
- 4.1. Turkey
- 4.2. Israel
- 4.3. GCC
- 4.4. North Africa
- 4.5. South Africa
- 4.6. Rest of Middle East & Africa
-
5. Asia Pacific
- 5.1. China
- 5.2. India
- 5.3. Japan
- 5.4. South Korea
- 5.5. ASEAN
- 5.6. Oceania
- 5.7. Rest of Asia Pacific

Petrochemical Packaging Regional Market Share
Geographic Coverage of Petrochemical Packaging
Petrochemical Packaging REPORT HIGHLIGHTS
| Aspects | Details |
|---|---|
| Study Period | 2020-2034 |
| Base Year | 2025 |
| Estimated Year | 2026 |
| Forecast Period | 2026-2034 |
| Historical Period | 2020-2025 |
| Growth Rate | CAGR of 5.7% from 2020-2034 |
| Segmentation |
|
Table of Contents
- 1. Introduction
- 1.1. Research Scope
- 1.2. Market Segmentation
- 1.3. Research Methodology
- 1.4. Definitions and Assumptions
- 2. Executive Summary
- 2.1. Introduction
- 3. Market Dynamics
- 3.1. Introduction
- 3.2. Market Drivers
- 3.3. Market Restrains
- 3.4. Market Trends
- 4. Market Factor Analysis
- 4.1. Porters Five Forces
- 4.2. Supply/Value Chain
- 4.3. PESTEL analysis
- 4.4. Market Entropy
- 4.5. Patent/Trademark Analysis
- 5. Global Petrochemical Packaging Analysis, Insights and Forecast, 2020-2032
- 5.1. Market Analysis, Insights and Forecast - by Application
- 5.1.1. Olefins
- 5.1.2. Aromatics
- 5.1.3. Others
- 5.2. Market Analysis, Insights and Forecast - by Types
- 5.2.1. Flexible Packaging
- 5.2.2. Rigid Packaging
- 5.3. Market Analysis, Insights and Forecast - by Region
- 5.3.1. North America
- 5.3.2. South America
- 5.3.3. Europe
- 5.3.4. Middle East & Africa
- 5.3.5. Asia Pacific
- 5.1. Market Analysis, Insights and Forecast - by Application
- 6. North America Petrochemical Packaging Analysis, Insights and Forecast, 2020-2032
- 6.1. Market Analysis, Insights and Forecast - by Application
- 6.1.1. Olefins
- 6.1.2. Aromatics
- 6.1.3. Others
- 6.2. Market Analysis, Insights and Forecast - by Types
- 6.2.1. Flexible Packaging
- 6.2.2. Rigid Packaging
- 6.1. Market Analysis, Insights and Forecast - by Application
- 7. South America Petrochemical Packaging Analysis, Insights and Forecast, 2020-2032
- 7.1. Market Analysis, Insights and Forecast - by Application
- 7.1.1. Olefins
- 7.1.2. Aromatics
- 7.1.3. Others
- 7.2. Market Analysis, Insights and Forecast - by Types
- 7.2.1. Flexible Packaging
- 7.2.2. Rigid Packaging
- 7.1. Market Analysis, Insights and Forecast - by Application
- 8. Europe Petrochemical Packaging Analysis, Insights and Forecast, 2020-2032
- 8.1. Market Analysis, Insights and Forecast - by Application
- 8.1.1. Olefins
- 8.1.2. Aromatics
- 8.1.3. Others
- 8.2. Market Analysis, Insights and Forecast - by Types
- 8.2.1. Flexible Packaging
- 8.2.2. Rigid Packaging
- 8.1. Market Analysis, Insights and Forecast - by Application
- 9. Middle East & Africa Petrochemical Packaging Analysis, Insights and Forecast, 2020-2032
- 9.1. Market Analysis, Insights and Forecast - by Application
- 9.1.1. Olefins
- 9.1.2. Aromatics
- 9.1.3. Others
- 9.2. Market Analysis, Insights and Forecast - by Types
- 9.2.1. Flexible Packaging
- 9.2.2. Rigid Packaging
- 9.1. Market Analysis, Insights and Forecast - by Application
- 10. Asia Pacific Petrochemical Packaging Analysis, Insights and Forecast, 2020-2032
- 10.1. Market Analysis, Insights and Forecast - by Application
- 10.1.1. Olefins
- 10.1.2. Aromatics
- 10.1.3. Others
- 10.2. Market Analysis, Insights and Forecast - by Types
- 10.2.1. Flexible Packaging
- 10.2.2. Rigid Packaging
- 10.1. Market Analysis, Insights and Forecast - by Application
- 11. Competitive Analysis
- 11.1. Global Market Share Analysis 2025
- 11.2. Company Profiles
- 11.2.1 Greif Inc.
- 11.2.1.1. Overview
- 11.2.1.2. Products
- 11.2.1.3. SWOT Analysis
- 11.2.1.4. Recent Developments
- 11.2.1.5. Financials (Based on Availability)
- 11.2.2 Mauser Packaging Solutions
- 11.2.2.1. Overview
- 11.2.2.2. Products
- 11.2.2.3. SWOT Analysis
- 11.2.2.4. Recent Developments
- 11.2.2.5. Financials (Based on Availability)
- 11.2.3 Ampac Holdings
- 11.2.3.1. Overview
- 11.2.3.2. Products
- 11.2.3.3. SWOT Analysis
- 11.2.3.4. Recent Developments
- 11.2.3.5. Financials (Based on Availability)
- 11.2.4 Environmental Packaging Technologies
- 11.2.4.1. Overview
- 11.2.4.2. Products
- 11.2.4.3. SWOT Analysis
- 11.2.4.4. Recent Developments
- 11.2.4.5. Financials (Based on Availability)
- 11.2.5 Mondi Group
- 11.2.5.1. Overview
- 11.2.5.2. Products
- 11.2.5.3. SWOT Analysis
- 11.2.5.4. Recent Developments
- 11.2.5.5. Financials (Based on Availability)
- 11.2.6 CL Smith
- 11.2.6.1. Overview
- 11.2.6.2. Products
- 11.2.6.3. SWOT Analysis
- 11.2.6.4. Recent Developments
- 11.2.6.5. Financials (Based on Availability)
- 11.2.7 SCHUTZ GmbH & Co. KGaA
- 11.2.7.1. Overview
- 11.2.7.2. Products
- 11.2.7.3. SWOT Analysis
- 11.2.7.4. Recent Developments
- 11.2.7.5. Financials (Based on Availability)
- 11.2.8 BWAY Corporation
- 11.2.8.1. Overview
- 11.2.8.2. Products
- 11.2.8.3. SWOT Analysis
- 11.2.8.4. Recent Developments
- 11.2.8.5. Financials (Based on Availability)
- 11.2.9 Industrial Container Services
- 11.2.9.1. Overview
- 11.2.9.2. Products
- 11.2.9.3. SWOT Analysis
- 11.2.9.4. Recent Developments
- 11.2.9.5. Financials (Based on Availability)
- 11.2.10 Berry Global Inc.
- 11.2.10.1. Overview
- 11.2.10.2. Products
- 11.2.10.3. SWOT Analysis
- 11.2.10.4. Recent Developments
- 11.2.10.5. Financials (Based on Availability)
- 11.2.11 Rak Petropack
- 11.2.11.1. Overview
- 11.2.11.2. Products
- 11.2.11.3. SWOT Analysis
- 11.2.11.4. Recent Developments
- 11.2.11.5. Financials (Based on Availability)
- 11.2.12 New Pig
- 11.2.12.1. Overview
- 11.2.12.2. Products
- 11.2.12.3. SWOT Analysis
- 11.2.12.4. Recent Developments
- 11.2.12.5. Financials (Based on Availability)
- 11.2.1 Greif Inc.
List of Figures
- Figure 1: Global Petrochemical Packaging Revenue Breakdown (billion, %) by Region 2025 & 2033
- Figure 2: North America Petrochemical Packaging Revenue (billion), by Application 2025 & 2033
- Figure 3: North America Petrochemical Packaging Revenue Share (%), by Application 2025 & 2033
- Figure 4: North America Petrochemical Packaging Revenue (billion), by Types 2025 & 2033
- Figure 5: North America Petrochemical Packaging Revenue Share (%), by Types 2025 & 2033
- Figure 6: North America Petrochemical Packaging Revenue (billion), by Country 2025 & 2033
- Figure 7: North America Petrochemical Packaging Revenue Share (%), by Country 2025 & 2033
- Figure 8: South America Petrochemical Packaging Revenue (billion), by Application 2025 & 2033
- Figure 9: South America Petrochemical Packaging Revenue Share (%), by Application 2025 & 2033
- Figure 10: South America Petrochemical Packaging Revenue (billion), by Types 2025 & 2033
- Figure 11: South America Petrochemical Packaging Revenue Share (%), by Types 2025 & 2033
- Figure 12: South America Petrochemical Packaging Revenue (billion), by Country 2025 & 2033
- Figure 13: South America Petrochemical Packaging Revenue Share (%), by Country 2025 & 2033
- Figure 14: Europe Petrochemical Packaging Revenue (billion), by Application 2025 & 2033
- Figure 15: Europe Petrochemical Packaging Revenue Share (%), by Application 2025 & 2033
- Figure 16: Europe Petrochemical Packaging Revenue (billion), by Types 2025 & 2033
- Figure 17: Europe Petrochemical Packaging Revenue Share (%), by Types 2025 & 2033
- Figure 18: Europe Petrochemical Packaging Revenue (billion), by Country 2025 & 2033
- Figure 19: Europe Petrochemical Packaging Revenue Share (%), by Country 2025 & 2033
- Figure 20: Middle East & Africa Petrochemical Packaging Revenue (billion), by Application 2025 & 2033
- Figure 21: Middle East & Africa Petrochemical Packaging Revenue Share (%), by Application 2025 & 2033
- Figure 22: Middle East & Africa Petrochemical Packaging Revenue (billion), by Types 2025 & 2033
- Figure 23: Middle East & Africa Petrochemical Packaging Revenue Share (%), by Types 2025 & 2033
- Figure 24: Middle East & Africa Petrochemical Packaging Revenue (billion), by Country 2025 & 2033
- Figure 25: Middle East & Africa Petrochemical Packaging Revenue Share (%), by Country 2025 & 2033
- Figure 26: Asia Pacific Petrochemical Packaging Revenue (billion), by Application 2025 & 2033
- Figure 27: Asia Pacific Petrochemical Packaging Revenue Share (%), by Application 2025 & 2033
- Figure 28: Asia Pacific Petrochemical Packaging Revenue (billion), by Types 2025 & 2033
- Figure 29: Asia Pacific Petrochemical Packaging Revenue Share (%), by Types 2025 & 2033
- Figure 30: Asia Pacific Petrochemical Packaging Revenue (billion), by Country 2025 & 2033
- Figure 31: Asia Pacific Petrochemical Packaging Revenue Share (%), by Country 2025 & 2033
List of Tables
- Table 1: Global Petrochemical Packaging Revenue billion Forecast, by Application 2020 & 2033
- Table 2: Global Petrochemical Packaging Revenue billion Forecast, by Types 2020 & 2033
- Table 3: Global Petrochemical Packaging Revenue billion Forecast, by Region 2020 & 2033
- Table 4: Global Petrochemical Packaging Revenue billion Forecast, by Application 2020 & 2033
- Table 5: Global Petrochemical Packaging Revenue billion Forecast, by Types 2020 & 2033
- Table 6: Global Petrochemical Packaging Revenue billion Forecast, by Country 2020 & 2033
- Table 7: United States Petrochemical Packaging Revenue (billion) Forecast, by Application 2020 & 2033
- Table 8: Canada Petrochemical Packaging Revenue (billion) Forecast, by Application 2020 & 2033
- Table 9: Mexico Petrochemical Packaging Revenue (billion) Forecast, by Application 2020 & 2033
- Table 10: Global Petrochemical Packaging Revenue billion Forecast, by Application 2020 & 2033
- Table 11: Global Petrochemical Packaging Revenue billion Forecast, by Types 2020 & 2033
- Table 12: Global Petrochemical Packaging Revenue billion Forecast, by Country 2020 & 2033
- Table 13: Brazil Petrochemical Packaging Revenue (billion) Forecast, by Application 2020 & 2033
- Table 14: Argentina Petrochemical Packaging Revenue (billion) Forecast, by Application 2020 & 2033
- Table 15: Rest of South America Petrochemical Packaging Revenue (billion) Forecast, by Application 2020 & 2033
- Table 16: Global Petrochemical Packaging Revenue billion Forecast, by Application 2020 & 2033
- Table 17: Global Petrochemical Packaging Revenue billion Forecast, by Types 2020 & 2033
- Table 18: Global Petrochemical Packaging Revenue billion Forecast, by Country 2020 & 2033
- Table 19: United Kingdom Petrochemical Packaging Revenue (billion) Forecast, by Application 2020 & 2033
- Table 20: Germany Petrochemical Packaging Revenue (billion) Forecast, by Application 2020 & 2033
- Table 21: France Petrochemical Packaging Revenue (billion) Forecast, by Application 2020 & 2033
- Table 22: Italy Petrochemical Packaging Revenue (billion) Forecast, by Application 2020 & 2033
- Table 23: Spain Petrochemical Packaging Revenue (billion) Forecast, by Application 2020 & 2033
- Table 24: Russia Petrochemical Packaging Revenue (billion) Forecast, by Application 2020 & 2033
- Table 25: Benelux Petrochemical Packaging Revenue (billion) Forecast, by Application 2020 & 2033
- Table 26: Nordics Petrochemical Packaging Revenue (billion) Forecast, by Application 2020 & 2033
- Table 27: Rest of Europe Petrochemical Packaging Revenue (billion) Forecast, by Application 2020 & 2033
- Table 28: Global Petrochemical Packaging Revenue billion Forecast, by Application 2020 & 2033
- Table 29: Global Petrochemical Packaging Revenue billion Forecast, by Types 2020 & 2033
- Table 30: Global Petrochemical Packaging Revenue billion Forecast, by Country 2020 & 2033
- Table 31: Turkey Petrochemical Packaging Revenue (billion) Forecast, by Application 2020 & 2033
- Table 32: Israel Petrochemical Packaging Revenue (billion) Forecast, by Application 2020 & 2033
- Table 33: GCC Petrochemical Packaging Revenue (billion) Forecast, by Application 2020 & 2033
- Table 34: North Africa Petrochemical Packaging Revenue (billion) Forecast, by Application 2020 & 2033
- Table 35: South Africa Petrochemical Packaging Revenue (billion) Forecast, by Application 2020 & 2033
- Table 36: Rest of Middle East & Africa Petrochemical Packaging Revenue (billion) Forecast, by Application 2020 & 2033
- Table 37: Global Petrochemical Packaging Revenue billion Forecast, by Application 2020 & 2033
- Table 38: Global Petrochemical Packaging Revenue billion Forecast, by Types 2020 & 2033
- Table 39: Global Petrochemical Packaging Revenue billion Forecast, by Country 2020 & 2033
- Table 40: China Petrochemical Packaging Revenue (billion) Forecast, by Application 2020 & 2033
- Table 41: India Petrochemical Packaging Revenue (billion) Forecast, by Application 2020 & 2033
- Table 42: Japan Petrochemical Packaging Revenue (billion) Forecast, by Application 2020 & 2033
- Table 43: South Korea Petrochemical Packaging Revenue (billion) Forecast, by Application 2020 & 2033
- Table 44: ASEAN Petrochemical Packaging Revenue (billion) Forecast, by Application 2020 & 2033
- Table 45: Oceania Petrochemical Packaging Revenue (billion) Forecast, by Application 2020 & 2033
- Table 46: Rest of Asia Pacific Petrochemical Packaging Revenue (billion) Forecast, by Application 2020 & 2033
Frequently Asked Questions
1. What is the projected Compound Annual Growth Rate (CAGR) of the Petrochemical Packaging?
The projected CAGR is approximately 5.7%.
2. Which companies are prominent players in the Petrochemical Packaging?
Key companies in the market include Greif Inc., Mauser Packaging Solutions, Ampac Holdings, Environmental Packaging Technologies, Mondi Group, CL Smith, SCHUTZ GmbH & Co. KGaA, BWAY Corporation, Industrial Container Services, Berry Global Inc., Rak Petropack, New Pig.
3. What are the main segments of the Petrochemical Packaging?
The market segments include Application, Types.
4. Can you provide details about the market size?
The market size is estimated to be USD 700.05 billion as of 2022.
5. What are some drivers contributing to market growth?
N/A
6. What are the notable trends driving market growth?
N/A
7. Are there any restraints impacting market growth?
N/A
8. Can you provide examples of recent developments in the market?
N/A
9. What pricing options are available for accessing the report?
Pricing options include single-user, multi-user, and enterprise licenses priced at USD 2900.00, USD 4350.00, and USD 5800.00 respectively.
10. Is the market size provided in terms of value or volume?
The market size is provided in terms of value, measured in billion.
11. Are there any specific market keywords associated with the report?
Yes, the market keyword associated with the report is "Petrochemical Packaging," which aids in identifying and referencing the specific market segment covered.
12. How do I determine which pricing option suits my needs best?
The pricing options vary based on user requirements and access needs. Individual users may opt for single-user licenses, while businesses requiring broader access may choose multi-user or enterprise licenses for cost-effective access to the report.
13. Are there any additional resources or data provided in the Petrochemical Packaging report?
While the report offers comprehensive insights, it's advisable to review the specific contents or supplementary materials provided to ascertain if additional resources or data are available.
14. How can I stay updated on further developments or reports in the Petrochemical Packaging?
To stay informed about further developments, trends, and reports in the Petrochemical Packaging, consider subscribing to industry newsletters, following relevant companies and organizations, or regularly checking reputable industry news sources and publications.
Methodology
Step 1 - Identification of Relevant Samples Size from Population Database


Step 2 - Approaches for Defining Global Market Size (Value, Volume* & Price*)

Note*: In applicable scenarios
Step 3 - Data Sources
Primary Research
- Web Analytics
- Survey Reports
- Research Institute
- Latest Research Reports
- Opinion Leaders
Secondary Research
- Annual Reports
- White Paper
- Latest Press Release
- Industry Association
- Paid Database
- Investor Presentations

Step 4 - Data Triangulation
Involves using different sources of information in order to increase the validity of a study
These sources are likely to be stakeholders in a program - participants, other researchers, program staff, other community members, and so on.
Then we put all data in single framework & apply various statistical tools to find out the dynamic on the market.
During the analysis stage, feedback from the stakeholder groups would be compared to determine areas of agreement as well as areas of divergence