

Key Insights
The pharmaceutical glass packaging bottles market is experiencing robust growth, driven by the increasing demand for injectable drugs and the inherent advantages of glass as a packaging material. Glass offers superior barrier properties, protecting sensitive pharmaceutical formulations from external contaminants and maintaining product integrity and sterility. This is particularly crucial for parenteral drugs, where contamination can have severe consequences. The market's expansion is further fueled by technological advancements in glass manufacturing, leading to lighter, more durable, and cost-effective packaging solutions. Stringent regulatory requirements regarding drug safety and efficacy also contribute to the preference for glass packaging, particularly in developed markets. While the market faces challenges such as rising raw material costs and increasing competition from alternative packaging materials like plastics, the inherent benefits of glass continue to solidify its position as a dominant player in pharmaceutical packaging.
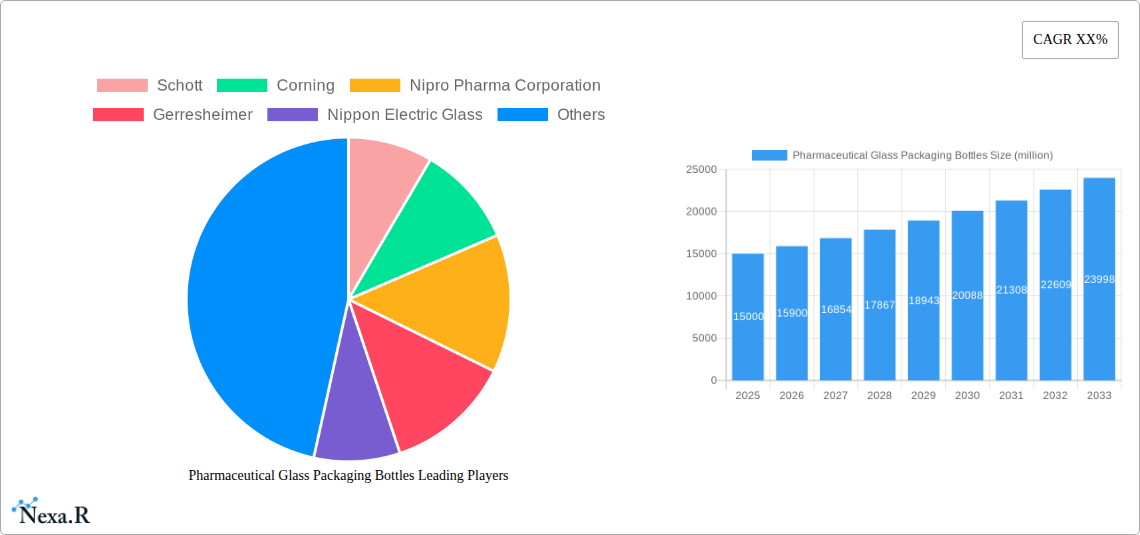
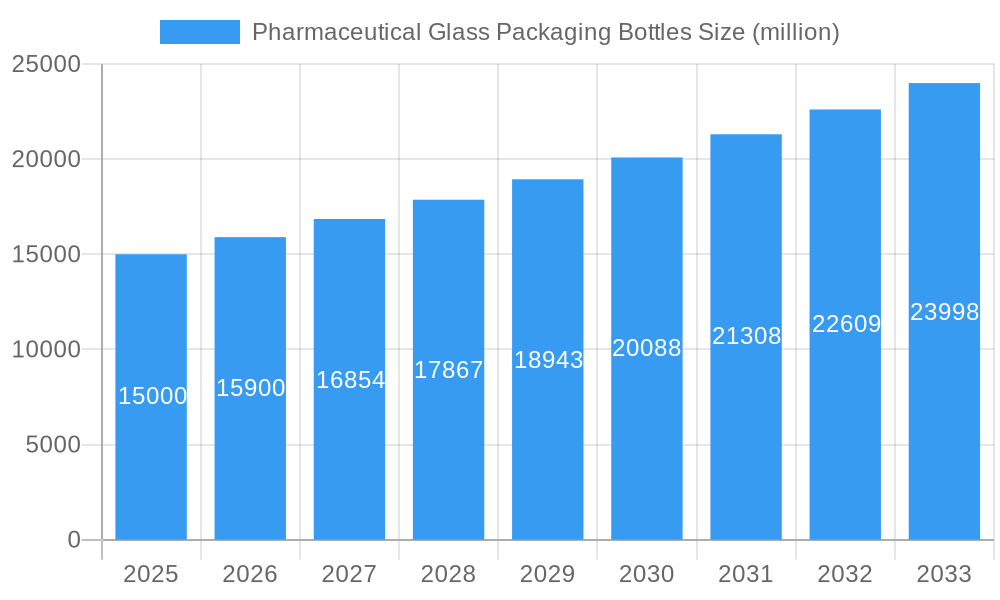
Pharmaceutical Glass Packaging Bottles Market Size (In Billion)
Growth is projected to be particularly strong in emerging economies, where increasing healthcare spending and expanding pharmaceutical industries are driving demand. The market is segmented by various bottle types (e.g., ampoules, vials, bottles), capacity, and end-use application (e.g., injectables, lyophilized drugs). Key players are continuously investing in research and development to innovate new designs and technologies, including specialized coatings that enhance drug stability and reduce breakage. The market's competitive landscape is characterized by both large multinational corporations and smaller regional players. Strategic partnerships, mergers, and acquisitions are frequent occurrences as companies seek to expand their market share and product portfolios. Future growth will likely be shaped by further technological innovation, evolving regulatory landscapes, and sustained demand for safe and effective drug delivery systems. A focus on sustainability and environmentally friendly manufacturing practices will also play a significant role in the market's development in the coming years.
Pharmaceutical Glass Packaging Bottles Company Market Share
Pharmaceutical Glass Packaging Bottles Market Report: 2019-2033
This comprehensive report provides a detailed analysis of the global pharmaceutical glass packaging bottles market, encompassing market dynamics, growth trends, regional insights, and key player analysis. The study period covers 2019-2033, with 2025 as the base and estimated year. The forecast period spans 2025-2033, and the historical period encompasses 2019-2024. This report is invaluable for industry professionals, investors, and strategic decision-makers seeking a deep understanding of this crucial segment within the broader pharmaceutical packaging market. The market size is projected to reach xx million units by 2033.
Pharmaceutical Glass Packaging Bottles Market Dynamics & Structure
The pharmaceutical glass packaging bottles market is characterized by a moderately concentrated structure, with several multinational corporations holding significant market share. The market is driven by technological innovations in glass formulations, enhancing barrier properties and reducing breakage rates. Stringent regulatory frameworks governing pharmaceutical packaging, particularly in developed markets, shape manufacturing practices and material selection. Competitive pressure from alternative packaging materials, like plastic and polymers, necessitates continuous innovation and cost optimization. End-user demographics—primarily pharmaceutical companies and contract manufacturers—influence demand patterns. Mergers and acquisitions (M&A) activity reflects the ongoing consolidation within the industry.
- Market Concentration: The top 5 players account for approximately xx% of the global market share in 2025.
- Technological Innovation: Focus on lightweighting, improved barrier properties (against moisture and oxygen), and enhanced breakage resistance.
- Regulatory Framework: Compliance with GMP (Good Manufacturing Practices) and other international standards drives market dynamics.
- Competitive Substitutes: Plastic and polymer-based packaging pose a competitive threat, requiring glass manufacturers to offer superior value propositions.
- M&A Activity: xx M&A deals were recorded in the historical period (2019-2024), indicating industry consolidation.
- Innovation Barriers: High R&D costs and stringent regulatory approvals are significant hurdles to innovation.
Pharmaceutical Glass Packaging Bottles Growth Trends & Insights
The global pharmaceutical glass packaging bottles market experienced a CAGR of xx% during the historical period (2019-2024), primarily driven by rising pharmaceutical production and increasing demand for injectable drugs. Adoption rates of advanced glass formulations, such as borosilicate glass, are growing steadily. Technological disruptions, such as the introduction of lighter and more durable glass types, are further boosting market growth. Consumer behavior shifts towards greater preference for convenience and safety, leading to increased demand for tamper-evident closures and innovative packaging solutions. The market is expected to maintain a CAGR of xx% during the forecast period (2025-2033), reaching xx million units by 2033. Market penetration of advanced glass types is projected to reach xx% by 2033.
Dominant Regions, Countries, or Segments in Pharmaceutical Glass Packaging Bottles
North America and Europe currently dominate the pharmaceutical glass packaging bottles market, driven by robust pharmaceutical industries and stringent regulatory environments. However, Asia-Pacific is experiencing rapid growth due to expanding pharmaceutical production capabilities and increasing demand for affordable healthcare.
- Key Drivers in North America: Strong regulatory frameworks, high per capita healthcare spending, and advanced manufacturing capabilities.
- Key Drivers in Europe: Stringent quality standards, high pharmaceutical R&D investment, and a large aging population requiring more medication.
- Key Drivers in Asia-Pacific: Rapid economic growth, expanding pharmaceutical sector, and increasing government investments in healthcare infrastructure.
- Market Share: North America holds approximately xx% of the market share in 2025, followed by Europe with xx% and Asia-Pacific with xx%.
- Growth Potential: Asia-Pacific demonstrates the highest growth potential, driven by its expanding pharmaceutical manufacturing base.
Pharmaceutical Glass Packaging Bottles Product Landscape
The market offers a wide range of products, including ampoules, vials, bottles, and cartridges, catering to various pharmaceutical applications. Innovations focus on improving barrier properties, reducing weight, enhancing durability, and integrating features like tamper evidence. Advanced glass types, such as borosilicate glass and neutral glass, offer superior chemical resistance and compatibility with a broader range of pharmaceuticals. Unique selling propositions include superior chemical inertness, ensuring drug integrity, and enhanced patient safety features.
Key Drivers, Barriers & Challenges in Pharmaceutical Glass Packaging Bottles
Key Drivers:
- Increasing demand for injectable drugs.
- Growing preference for glass packaging due to its inertness and barrier properties.
- Technological advancements in glass formulation and manufacturing.
- Stringent regulatory requirements driving adoption of high-quality packaging.
Challenges & Restraints:
- High raw material costs and fluctuating energy prices impacting production costs.
- Competitive pressure from alternative packaging materials (plastic).
- Supply chain disruptions impacting timely delivery of packaging materials.
- Strict regulatory compliance requirements adding to manufacturing costs.
Emerging Opportunities in Pharmaceutical Glass Packaging Bottles
- Growing demand for specialized glass packaging for biologics and other advanced therapeutics.
- Expansion into emerging markets with rising healthcare spending.
- Development of sustainable and environmentally friendly glass packaging solutions.
- Innovation in packaging design to improve user experience and reduce medication errors.
Growth Accelerators in the Pharmaceutical Glass Packaging Bottles Industry
Technological advancements in glass formulations, coupled with strategic partnerships and collaborations between glass manufacturers and pharmaceutical companies, are driving market growth. Expansion into emerging markets and the development of innovative packaging solutions, such as those incorporating smart packaging technologies, are also significant catalysts.
Key Players Shaping the Pharmaceutical Glass Packaging Bottles Market
- Schott
- Corning
- Nipro Pharma Corporation
- Gerresheimer
- Nippon Electric Glass
- Stevanato Group
- SGD Pharma
- Ardagh
- Bormioli Pharma
- West Pharmaceutical
- Sisecam Group
- PGP Glass
- Stoelzle Pharma
- Shiotani Glass
- Shandong Pharmaceutical Glass
- ChongQing Zhengchuan Pharmaceutical Packaging
- Anhui Deli Household Glass
- Zhuzhou Kibing Group
- Shandong Linuo Technical Glass
- Triumph Junheng
- Cangzhou Four STARS Glass
Notable Milestones in Pharmaceutical Glass Packaging Bottles Sector
- 2020: Introduction of a new lightweight borosilicate glass vial by Schott.
- 2021: Gerresheimer acquired a company specializing in pharmaceutical packaging.
- 2022: Stevanato Group invested in a new manufacturing facility for advanced glass packaging.
- 2023: Several companies launched sustainable glass packaging solutions.
In-Depth Pharmaceutical Glass Packaging Bottles Market Outlook
The pharmaceutical glass packaging bottles market is poised for sustained growth, driven by technological innovations, expansion into emerging markets, and the increasing demand for high-quality pharmaceutical packaging. Strategic partnerships and collaborations will play a pivotal role in shaping the market landscape. Focus on sustainable and eco-friendly solutions will further drive market expansion. The market offers significant opportunities for companies with a strong focus on innovation and technological advancement.
Pharmaceutical Glass Packaging Bottles Segmentation
-
1. Application
- 1.1. Injectable
- 1.2. Transfusion
- 1.3. Other
-
2. Types
- 2.1. Cartridges
- 2.2. Glass Vials
- 2.3. Ampoules
- 2.4. Others
Pharmaceutical Glass Packaging Bottles Segmentation By Geography
-
1. North America
- 1.1. United States
- 1.2. Canada
- 1.3. Mexico
-
2. South America
- 2.1. Brazil
- 2.2. Argentina
- 2.3. Rest of South America
-
3. Europe
- 3.1. United Kingdom
- 3.2. Germany
- 3.3. France
- 3.4. Italy
- 3.5. Spain
- 3.6. Russia
- 3.7. Benelux
- 3.8. Nordics
- 3.9. Rest of Europe
-
4. Middle East & Africa
- 4.1. Turkey
- 4.2. Israel
- 4.3. GCC
- 4.4. North Africa
- 4.5. South Africa
- 4.6. Rest of Middle East & Africa
-
5. Asia Pacific
- 5.1. China
- 5.2. India
- 5.3. Japan
- 5.4. South Korea
- 5.5. ASEAN
- 5.6. Oceania
- 5.7. Rest of Asia Pacific

Pharmaceutical Glass Packaging Bottles Regional Market Share
Geographic Coverage of Pharmaceutical Glass Packaging Bottles
Pharmaceutical Glass Packaging Bottles REPORT HIGHLIGHTS
| Aspects | Details |
|---|---|
| Study Period | 2020-2034 |
| Base Year | 2025 |
| Estimated Year | 2026 |
| Forecast Period | 2026-2034 |
| Historical Period | 2020-2025 |
| Growth Rate | CAGR of XX% from 2020-2034 |
| Segmentation |
|
Table of Contents
- 1. Introduction
- 1.1. Research Scope
- 1.2. Market Segmentation
- 1.3. Research Methodology
- 1.4. Definitions and Assumptions
- 2. Executive Summary
- 2.1. Introduction
- 3. Market Dynamics
- 3.1. Introduction
- 3.2. Market Drivers
- 3.3. Market Restrains
- 3.4. Market Trends
- 4. Market Factor Analysis
- 4.1. Porters Five Forces
- 4.2. Supply/Value Chain
- 4.3. PESTEL analysis
- 4.4. Market Entropy
- 4.5. Patent/Trademark Analysis
- 5. Global Pharmaceutical Glass Packaging Bottles Analysis, Insights and Forecast, 2020-2032
- 5.1. Market Analysis, Insights and Forecast - by Application
- 5.1.1. Injectable
- 5.1.2. Transfusion
- 5.1.3. Other
- 5.2. Market Analysis, Insights and Forecast - by Types
- 5.2.1. Cartridges
- 5.2.2. Glass Vials
- 5.2.3. Ampoules
- 5.2.4. Others
- 5.3. Market Analysis, Insights and Forecast - by Region
- 5.3.1. North America
- 5.3.2. South America
- 5.3.3. Europe
- 5.3.4. Middle East & Africa
- 5.3.5. Asia Pacific
- 5.1. Market Analysis, Insights and Forecast - by Application
- 6. North America Pharmaceutical Glass Packaging Bottles Analysis, Insights and Forecast, 2020-2032
- 6.1. Market Analysis, Insights and Forecast - by Application
- 6.1.1. Injectable
- 6.1.2. Transfusion
- 6.1.3. Other
- 6.2. Market Analysis, Insights and Forecast - by Types
- 6.2.1. Cartridges
- 6.2.2. Glass Vials
- 6.2.3. Ampoules
- 6.2.4. Others
- 6.1. Market Analysis, Insights and Forecast - by Application
- 7. South America Pharmaceutical Glass Packaging Bottles Analysis, Insights and Forecast, 2020-2032
- 7.1. Market Analysis, Insights and Forecast - by Application
- 7.1.1. Injectable
- 7.1.2. Transfusion
- 7.1.3. Other
- 7.2. Market Analysis, Insights and Forecast - by Types
- 7.2.1. Cartridges
- 7.2.2. Glass Vials
- 7.2.3. Ampoules
- 7.2.4. Others
- 7.1. Market Analysis, Insights and Forecast - by Application
- 8. Europe Pharmaceutical Glass Packaging Bottles Analysis, Insights and Forecast, 2020-2032
- 8.1. Market Analysis, Insights and Forecast - by Application
- 8.1.1. Injectable
- 8.1.2. Transfusion
- 8.1.3. Other
- 8.2. Market Analysis, Insights and Forecast - by Types
- 8.2.1. Cartridges
- 8.2.2. Glass Vials
- 8.2.3. Ampoules
- 8.2.4. Others
- 8.1. Market Analysis, Insights and Forecast - by Application
- 9. Middle East & Africa Pharmaceutical Glass Packaging Bottles Analysis, Insights and Forecast, 2020-2032
- 9.1. Market Analysis, Insights and Forecast - by Application
- 9.1.1. Injectable
- 9.1.2. Transfusion
- 9.1.3. Other
- 9.2. Market Analysis, Insights and Forecast - by Types
- 9.2.1. Cartridges
- 9.2.2. Glass Vials
- 9.2.3. Ampoules
- 9.2.4. Others
- 9.1. Market Analysis, Insights and Forecast - by Application
- 10. Asia Pacific Pharmaceutical Glass Packaging Bottles Analysis, Insights and Forecast, 2020-2032
- 10.1. Market Analysis, Insights and Forecast - by Application
- 10.1.1. Injectable
- 10.1.2. Transfusion
- 10.1.3. Other
- 10.2. Market Analysis, Insights and Forecast - by Types
- 10.2.1. Cartridges
- 10.2.2. Glass Vials
- 10.2.3. Ampoules
- 10.2.4. Others
- 10.1. Market Analysis, Insights and Forecast - by Application
- 11. Competitive Analysis
- 11.1. Global Market Share Analysis 2025
- 11.2. Company Profiles
- 11.2.1 Schott
- 11.2.1.1. Overview
- 11.2.1.2. Products
- 11.2.1.3. SWOT Analysis
- 11.2.1.4. Recent Developments
- 11.2.1.5. Financials (Based on Availability)
- 11.2.2 Corning
- 11.2.2.1. Overview
- 11.2.2.2. Products
- 11.2.2.3. SWOT Analysis
- 11.2.2.4. Recent Developments
- 11.2.2.5. Financials (Based on Availability)
- 11.2.3 Nipro Pharma Corporation
- 11.2.3.1. Overview
- 11.2.3.2. Products
- 11.2.3.3. SWOT Analysis
- 11.2.3.4. Recent Developments
- 11.2.3.5. Financials (Based on Availability)
- 11.2.4 Gerresheimer
- 11.2.4.1. Overview
- 11.2.4.2. Products
- 11.2.4.3. SWOT Analysis
- 11.2.4.4. Recent Developments
- 11.2.4.5. Financials (Based on Availability)
- 11.2.5 Nippon Electric Glass
- 11.2.5.1. Overview
- 11.2.5.2. Products
- 11.2.5.3. SWOT Analysis
- 11.2.5.4. Recent Developments
- 11.2.5.5. Financials (Based on Availability)
- 11.2.6 Stevanato Group
- 11.2.6.1. Overview
- 11.2.6.2. Products
- 11.2.6.3. SWOT Analysis
- 11.2.6.4. Recent Developments
- 11.2.6.5. Financials (Based on Availability)
- 11.2.7 SGD Pharma
- 11.2.7.1. Overview
- 11.2.7.2. Products
- 11.2.7.3. SWOT Analysis
- 11.2.7.4. Recent Developments
- 11.2.7.5. Financials (Based on Availability)
- 11.2.8 Ardagh
- 11.2.8.1. Overview
- 11.2.8.2. Products
- 11.2.8.3. SWOT Analysis
- 11.2.8.4. Recent Developments
- 11.2.8.5. Financials (Based on Availability)
- 11.2.9 Bormioli Pharma
- 11.2.9.1. Overview
- 11.2.9.2. Products
- 11.2.9.3. SWOT Analysis
- 11.2.9.4. Recent Developments
- 11.2.9.5. Financials (Based on Availability)
- 11.2.10 West Pharmaceutical
- 11.2.10.1. Overview
- 11.2.10.2. Products
- 11.2.10.3. SWOT Analysis
- 11.2.10.4. Recent Developments
- 11.2.10.5. Financials (Based on Availability)
- 11.2.11 Sisecam Group
- 11.2.11.1. Overview
- 11.2.11.2. Products
- 11.2.11.3. SWOT Analysis
- 11.2.11.4. Recent Developments
- 11.2.11.5. Financials (Based on Availability)
- 11.2.12 PGP Glass
- 11.2.12.1. Overview
- 11.2.12.2. Products
- 11.2.12.3. SWOT Analysis
- 11.2.12.4. Recent Developments
- 11.2.12.5. Financials (Based on Availability)
- 11.2.13 Stoelzle Pharma
- 11.2.13.1. Overview
- 11.2.13.2. Products
- 11.2.13.3. SWOT Analysis
- 11.2.13.4. Recent Developments
- 11.2.13.5. Financials (Based on Availability)
- 11.2.14 Shiotani Glass
- 11.2.14.1. Overview
- 11.2.14.2. Products
- 11.2.14.3. SWOT Analysis
- 11.2.14.4. Recent Developments
- 11.2.14.5. Financials (Based on Availability)
- 11.2.15 Shandong Pharmaceutical Glass
- 11.2.15.1. Overview
- 11.2.15.2. Products
- 11.2.15.3. SWOT Analysis
- 11.2.15.4. Recent Developments
- 11.2.15.5. Financials (Based on Availability)
- 11.2.16 ChongQing Zhengchuan Pharmaceutical Packaging
- 11.2.16.1. Overview
- 11.2.16.2. Products
- 11.2.16.3. SWOT Analysis
- 11.2.16.4. Recent Developments
- 11.2.16.5. Financials (Based on Availability)
- 11.2.17 Anhui Deli Household Glass
- 11.2.17.1. Overview
- 11.2.17.2. Products
- 11.2.17.3. SWOT Analysis
- 11.2.17.4. Recent Developments
- 11.2.17.5. Financials (Based on Availability)
- 11.2.18 Zhuzhou Kibing Group
- 11.2.18.1. Overview
- 11.2.18.2. Products
- 11.2.18.3. SWOT Analysis
- 11.2.18.4. Recent Developments
- 11.2.18.5. Financials (Based on Availability)
- 11.2.19 Shandong Linuo Technical Glass
- 11.2.19.1. Overview
- 11.2.19.2. Products
- 11.2.19.3. SWOT Analysis
- 11.2.19.4. Recent Developments
- 11.2.19.5. Financials (Based on Availability)
- 11.2.20 Triumph Junheng
- 11.2.20.1. Overview
- 11.2.20.2. Products
- 11.2.20.3. SWOT Analysis
- 11.2.20.4. Recent Developments
- 11.2.20.5. Financials (Based on Availability)
- 11.2.21 Cangzhou Four STARS Glass
- 11.2.21.1. Overview
- 11.2.21.2. Products
- 11.2.21.3. SWOT Analysis
- 11.2.21.4. Recent Developments
- 11.2.21.5. Financials (Based on Availability)
- 11.2.1 Schott
List of Figures
- Figure 1: Global Pharmaceutical Glass Packaging Bottles Revenue Breakdown (million, %) by Region 2025 & 2033
- Figure 2: Global Pharmaceutical Glass Packaging Bottles Volume Breakdown (K, %) by Region 2025 & 2033
- Figure 3: North America Pharmaceutical Glass Packaging Bottles Revenue (million), by Application 2025 & 2033
- Figure 4: North America Pharmaceutical Glass Packaging Bottles Volume (K), by Application 2025 & 2033
- Figure 5: North America Pharmaceutical Glass Packaging Bottles Revenue Share (%), by Application 2025 & 2033
- Figure 6: North America Pharmaceutical Glass Packaging Bottles Volume Share (%), by Application 2025 & 2033
- Figure 7: North America Pharmaceutical Glass Packaging Bottles Revenue (million), by Types 2025 & 2033
- Figure 8: North America Pharmaceutical Glass Packaging Bottles Volume (K), by Types 2025 & 2033
- Figure 9: North America Pharmaceutical Glass Packaging Bottles Revenue Share (%), by Types 2025 & 2033
- Figure 10: North America Pharmaceutical Glass Packaging Bottles Volume Share (%), by Types 2025 & 2033
- Figure 11: North America Pharmaceutical Glass Packaging Bottles Revenue (million), by Country 2025 & 2033
- Figure 12: North America Pharmaceutical Glass Packaging Bottles Volume (K), by Country 2025 & 2033
- Figure 13: North America Pharmaceutical Glass Packaging Bottles Revenue Share (%), by Country 2025 & 2033
- Figure 14: North America Pharmaceutical Glass Packaging Bottles Volume Share (%), by Country 2025 & 2033
- Figure 15: South America Pharmaceutical Glass Packaging Bottles Revenue (million), by Application 2025 & 2033
- Figure 16: South America Pharmaceutical Glass Packaging Bottles Volume (K), by Application 2025 & 2033
- Figure 17: South America Pharmaceutical Glass Packaging Bottles Revenue Share (%), by Application 2025 & 2033
- Figure 18: South America Pharmaceutical Glass Packaging Bottles Volume Share (%), by Application 2025 & 2033
- Figure 19: South America Pharmaceutical Glass Packaging Bottles Revenue (million), by Types 2025 & 2033
- Figure 20: South America Pharmaceutical Glass Packaging Bottles Volume (K), by Types 2025 & 2033
- Figure 21: South America Pharmaceutical Glass Packaging Bottles Revenue Share (%), by Types 2025 & 2033
- Figure 22: South America Pharmaceutical Glass Packaging Bottles Volume Share (%), by Types 2025 & 2033
- Figure 23: South America Pharmaceutical Glass Packaging Bottles Revenue (million), by Country 2025 & 2033
- Figure 24: South America Pharmaceutical Glass Packaging Bottles Volume (K), by Country 2025 & 2033
- Figure 25: South America Pharmaceutical Glass Packaging Bottles Revenue Share (%), by Country 2025 & 2033
- Figure 26: South America Pharmaceutical Glass Packaging Bottles Volume Share (%), by Country 2025 & 2033
- Figure 27: Europe Pharmaceutical Glass Packaging Bottles Revenue (million), by Application 2025 & 2033
- Figure 28: Europe Pharmaceutical Glass Packaging Bottles Volume (K), by Application 2025 & 2033
- Figure 29: Europe Pharmaceutical Glass Packaging Bottles Revenue Share (%), by Application 2025 & 2033
- Figure 30: Europe Pharmaceutical Glass Packaging Bottles Volume Share (%), by Application 2025 & 2033
- Figure 31: Europe Pharmaceutical Glass Packaging Bottles Revenue (million), by Types 2025 & 2033
- Figure 32: Europe Pharmaceutical Glass Packaging Bottles Volume (K), by Types 2025 & 2033
- Figure 33: Europe Pharmaceutical Glass Packaging Bottles Revenue Share (%), by Types 2025 & 2033
- Figure 34: Europe Pharmaceutical Glass Packaging Bottles Volume Share (%), by Types 2025 & 2033
- Figure 35: Europe Pharmaceutical Glass Packaging Bottles Revenue (million), by Country 2025 & 2033
- Figure 36: Europe Pharmaceutical Glass Packaging Bottles Volume (K), by Country 2025 & 2033
- Figure 37: Europe Pharmaceutical Glass Packaging Bottles Revenue Share (%), by Country 2025 & 2033
- Figure 38: Europe Pharmaceutical Glass Packaging Bottles Volume Share (%), by Country 2025 & 2033
- Figure 39: Middle East & Africa Pharmaceutical Glass Packaging Bottles Revenue (million), by Application 2025 & 2033
- Figure 40: Middle East & Africa Pharmaceutical Glass Packaging Bottles Volume (K), by Application 2025 & 2033
- Figure 41: Middle East & Africa Pharmaceutical Glass Packaging Bottles Revenue Share (%), by Application 2025 & 2033
- Figure 42: Middle East & Africa Pharmaceutical Glass Packaging Bottles Volume Share (%), by Application 2025 & 2033
- Figure 43: Middle East & Africa Pharmaceutical Glass Packaging Bottles Revenue (million), by Types 2025 & 2033
- Figure 44: Middle East & Africa Pharmaceutical Glass Packaging Bottles Volume (K), by Types 2025 & 2033
- Figure 45: Middle East & Africa Pharmaceutical Glass Packaging Bottles Revenue Share (%), by Types 2025 & 2033
- Figure 46: Middle East & Africa Pharmaceutical Glass Packaging Bottles Volume Share (%), by Types 2025 & 2033
- Figure 47: Middle East & Africa Pharmaceutical Glass Packaging Bottles Revenue (million), by Country 2025 & 2033
- Figure 48: Middle East & Africa Pharmaceutical Glass Packaging Bottles Volume (K), by Country 2025 & 2033
- Figure 49: Middle East & Africa Pharmaceutical Glass Packaging Bottles Revenue Share (%), by Country 2025 & 2033
- Figure 50: Middle East & Africa Pharmaceutical Glass Packaging Bottles Volume Share (%), by Country 2025 & 2033
- Figure 51: Asia Pacific Pharmaceutical Glass Packaging Bottles Revenue (million), by Application 2025 & 2033
- Figure 52: Asia Pacific Pharmaceutical Glass Packaging Bottles Volume (K), by Application 2025 & 2033
- Figure 53: Asia Pacific Pharmaceutical Glass Packaging Bottles Revenue Share (%), by Application 2025 & 2033
- Figure 54: Asia Pacific Pharmaceutical Glass Packaging Bottles Volume Share (%), by Application 2025 & 2033
- Figure 55: Asia Pacific Pharmaceutical Glass Packaging Bottles Revenue (million), by Types 2025 & 2033
- Figure 56: Asia Pacific Pharmaceutical Glass Packaging Bottles Volume (K), by Types 2025 & 2033
- Figure 57: Asia Pacific Pharmaceutical Glass Packaging Bottles Revenue Share (%), by Types 2025 & 2033
- Figure 58: Asia Pacific Pharmaceutical Glass Packaging Bottles Volume Share (%), by Types 2025 & 2033
- Figure 59: Asia Pacific Pharmaceutical Glass Packaging Bottles Revenue (million), by Country 2025 & 2033
- Figure 60: Asia Pacific Pharmaceutical Glass Packaging Bottles Volume (K), by Country 2025 & 2033
- Figure 61: Asia Pacific Pharmaceutical Glass Packaging Bottles Revenue Share (%), by Country 2025 & 2033
- Figure 62: Asia Pacific Pharmaceutical Glass Packaging Bottles Volume Share (%), by Country 2025 & 2033
List of Tables
- Table 1: Global Pharmaceutical Glass Packaging Bottles Revenue million Forecast, by Application 2020 & 2033
- Table 2: Global Pharmaceutical Glass Packaging Bottles Volume K Forecast, by Application 2020 & 2033
- Table 3: Global Pharmaceutical Glass Packaging Bottles Revenue million Forecast, by Types 2020 & 2033
- Table 4: Global Pharmaceutical Glass Packaging Bottles Volume K Forecast, by Types 2020 & 2033
- Table 5: Global Pharmaceutical Glass Packaging Bottles Revenue million Forecast, by Region 2020 & 2033
- Table 6: Global Pharmaceutical Glass Packaging Bottles Volume K Forecast, by Region 2020 & 2033
- Table 7: Global Pharmaceutical Glass Packaging Bottles Revenue million Forecast, by Application 2020 & 2033
- Table 8: Global Pharmaceutical Glass Packaging Bottles Volume K Forecast, by Application 2020 & 2033
- Table 9: Global Pharmaceutical Glass Packaging Bottles Revenue million Forecast, by Types 2020 & 2033
- Table 10: Global Pharmaceutical Glass Packaging Bottles Volume K Forecast, by Types 2020 & 2033
- Table 11: Global Pharmaceutical Glass Packaging Bottles Revenue million Forecast, by Country 2020 & 2033
- Table 12: Global Pharmaceutical Glass Packaging Bottles Volume K Forecast, by Country 2020 & 2033
- Table 13: United States Pharmaceutical Glass Packaging Bottles Revenue (million) Forecast, by Application 2020 & 2033
- Table 14: United States Pharmaceutical Glass Packaging Bottles Volume (K) Forecast, by Application 2020 & 2033
- Table 15: Canada Pharmaceutical Glass Packaging Bottles Revenue (million) Forecast, by Application 2020 & 2033
- Table 16: Canada Pharmaceutical Glass Packaging Bottles Volume (K) Forecast, by Application 2020 & 2033
- Table 17: Mexico Pharmaceutical Glass Packaging Bottles Revenue (million) Forecast, by Application 2020 & 2033
- Table 18: Mexico Pharmaceutical Glass Packaging Bottles Volume (K) Forecast, by Application 2020 & 2033
- Table 19: Global Pharmaceutical Glass Packaging Bottles Revenue million Forecast, by Application 2020 & 2033
- Table 20: Global Pharmaceutical Glass Packaging Bottles Volume K Forecast, by Application 2020 & 2033
- Table 21: Global Pharmaceutical Glass Packaging Bottles Revenue million Forecast, by Types 2020 & 2033
- Table 22: Global Pharmaceutical Glass Packaging Bottles Volume K Forecast, by Types 2020 & 2033
- Table 23: Global Pharmaceutical Glass Packaging Bottles Revenue million Forecast, by Country 2020 & 2033
- Table 24: Global Pharmaceutical Glass Packaging Bottles Volume K Forecast, by Country 2020 & 2033
- Table 25: Brazil Pharmaceutical Glass Packaging Bottles Revenue (million) Forecast, by Application 2020 & 2033
- Table 26: Brazil Pharmaceutical Glass Packaging Bottles Volume (K) Forecast, by Application 2020 & 2033
- Table 27: Argentina Pharmaceutical Glass Packaging Bottles Revenue (million) Forecast, by Application 2020 & 2033
- Table 28: Argentina Pharmaceutical Glass Packaging Bottles Volume (K) Forecast, by Application 2020 & 2033
- Table 29: Rest of South America Pharmaceutical Glass Packaging Bottles Revenue (million) Forecast, by Application 2020 & 2033
- Table 30: Rest of South America Pharmaceutical Glass Packaging Bottles Volume (K) Forecast, by Application 2020 & 2033
- Table 31: Global Pharmaceutical Glass Packaging Bottles Revenue million Forecast, by Application 2020 & 2033
- Table 32: Global Pharmaceutical Glass Packaging Bottles Volume K Forecast, by Application 2020 & 2033
- Table 33: Global Pharmaceutical Glass Packaging Bottles Revenue million Forecast, by Types 2020 & 2033
- Table 34: Global Pharmaceutical Glass Packaging Bottles Volume K Forecast, by Types 2020 & 2033
- Table 35: Global Pharmaceutical Glass Packaging Bottles Revenue million Forecast, by Country 2020 & 2033
- Table 36: Global Pharmaceutical Glass Packaging Bottles Volume K Forecast, by Country 2020 & 2033
- Table 37: United Kingdom Pharmaceutical Glass Packaging Bottles Revenue (million) Forecast, by Application 2020 & 2033
- Table 38: United Kingdom Pharmaceutical Glass Packaging Bottles Volume (K) Forecast, by Application 2020 & 2033
- Table 39: Germany Pharmaceutical Glass Packaging Bottles Revenue (million) Forecast, by Application 2020 & 2033
- Table 40: Germany Pharmaceutical Glass Packaging Bottles Volume (K) Forecast, by Application 2020 & 2033
- Table 41: France Pharmaceutical Glass Packaging Bottles Revenue (million) Forecast, by Application 2020 & 2033
- Table 42: France Pharmaceutical Glass Packaging Bottles Volume (K) Forecast, by Application 2020 & 2033
- Table 43: Italy Pharmaceutical Glass Packaging Bottles Revenue (million) Forecast, by Application 2020 & 2033
- Table 44: Italy Pharmaceutical Glass Packaging Bottles Volume (K) Forecast, by Application 2020 & 2033
- Table 45: Spain Pharmaceutical Glass Packaging Bottles Revenue (million) Forecast, by Application 2020 & 2033
- Table 46: Spain Pharmaceutical Glass Packaging Bottles Volume (K) Forecast, by Application 2020 & 2033
- Table 47: Russia Pharmaceutical Glass Packaging Bottles Revenue (million) Forecast, by Application 2020 & 2033
- Table 48: Russia Pharmaceutical Glass Packaging Bottles Volume (K) Forecast, by Application 2020 & 2033
- Table 49: Benelux Pharmaceutical Glass Packaging Bottles Revenue (million) Forecast, by Application 2020 & 2033
- Table 50: Benelux Pharmaceutical Glass Packaging Bottles Volume (K) Forecast, by Application 2020 & 2033
- Table 51: Nordics Pharmaceutical Glass Packaging Bottles Revenue (million) Forecast, by Application 2020 & 2033
- Table 52: Nordics Pharmaceutical Glass Packaging Bottles Volume (K) Forecast, by Application 2020 & 2033
- Table 53: Rest of Europe Pharmaceutical Glass Packaging Bottles Revenue (million) Forecast, by Application 2020 & 2033
- Table 54: Rest of Europe Pharmaceutical Glass Packaging Bottles Volume (K) Forecast, by Application 2020 & 2033
- Table 55: Global Pharmaceutical Glass Packaging Bottles Revenue million Forecast, by Application 2020 & 2033
- Table 56: Global Pharmaceutical Glass Packaging Bottles Volume K Forecast, by Application 2020 & 2033
- Table 57: Global Pharmaceutical Glass Packaging Bottles Revenue million Forecast, by Types 2020 & 2033
- Table 58: Global Pharmaceutical Glass Packaging Bottles Volume K Forecast, by Types 2020 & 2033
- Table 59: Global Pharmaceutical Glass Packaging Bottles Revenue million Forecast, by Country 2020 & 2033
- Table 60: Global Pharmaceutical Glass Packaging Bottles Volume K Forecast, by Country 2020 & 2033
- Table 61: Turkey Pharmaceutical Glass Packaging Bottles Revenue (million) Forecast, by Application 2020 & 2033
- Table 62: Turkey Pharmaceutical Glass Packaging Bottles Volume (K) Forecast, by Application 2020 & 2033
- Table 63: Israel Pharmaceutical Glass Packaging Bottles Revenue (million) Forecast, by Application 2020 & 2033
- Table 64: Israel Pharmaceutical Glass Packaging Bottles Volume (K) Forecast, by Application 2020 & 2033
- Table 65: GCC Pharmaceutical Glass Packaging Bottles Revenue (million) Forecast, by Application 2020 & 2033
- Table 66: GCC Pharmaceutical Glass Packaging Bottles Volume (K) Forecast, by Application 2020 & 2033
- Table 67: North Africa Pharmaceutical Glass Packaging Bottles Revenue (million) Forecast, by Application 2020 & 2033
- Table 68: North Africa Pharmaceutical Glass Packaging Bottles Volume (K) Forecast, by Application 2020 & 2033
- Table 69: South Africa Pharmaceutical Glass Packaging Bottles Revenue (million) Forecast, by Application 2020 & 2033
- Table 70: South Africa Pharmaceutical Glass Packaging Bottles Volume (K) Forecast, by Application 2020 & 2033
- Table 71: Rest of Middle East & Africa Pharmaceutical Glass Packaging Bottles Revenue (million) Forecast, by Application 2020 & 2033
- Table 72: Rest of Middle East & Africa Pharmaceutical Glass Packaging Bottles Volume (K) Forecast, by Application 2020 & 2033
- Table 73: Global Pharmaceutical Glass Packaging Bottles Revenue million Forecast, by Application 2020 & 2033
- Table 74: Global Pharmaceutical Glass Packaging Bottles Volume K Forecast, by Application 2020 & 2033
- Table 75: Global Pharmaceutical Glass Packaging Bottles Revenue million Forecast, by Types 2020 & 2033
- Table 76: Global Pharmaceutical Glass Packaging Bottles Volume K Forecast, by Types 2020 & 2033
- Table 77: Global Pharmaceutical Glass Packaging Bottles Revenue million Forecast, by Country 2020 & 2033
- Table 78: Global Pharmaceutical Glass Packaging Bottles Volume K Forecast, by Country 2020 & 2033
- Table 79: China Pharmaceutical Glass Packaging Bottles Revenue (million) Forecast, by Application 2020 & 2033
- Table 80: China Pharmaceutical Glass Packaging Bottles Volume (K) Forecast, by Application 2020 & 2033
- Table 81: India Pharmaceutical Glass Packaging Bottles Revenue (million) Forecast, by Application 2020 & 2033
- Table 82: India Pharmaceutical Glass Packaging Bottles Volume (K) Forecast, by Application 2020 & 2033
- Table 83: Japan Pharmaceutical Glass Packaging Bottles Revenue (million) Forecast, by Application 2020 & 2033
- Table 84: Japan Pharmaceutical Glass Packaging Bottles Volume (K) Forecast, by Application 2020 & 2033
- Table 85: South Korea Pharmaceutical Glass Packaging Bottles Revenue (million) Forecast, by Application 2020 & 2033
- Table 86: South Korea Pharmaceutical Glass Packaging Bottles Volume (K) Forecast, by Application 2020 & 2033
- Table 87: ASEAN Pharmaceutical Glass Packaging Bottles Revenue (million) Forecast, by Application 2020 & 2033
- Table 88: ASEAN Pharmaceutical Glass Packaging Bottles Volume (K) Forecast, by Application 2020 & 2033
- Table 89: Oceania Pharmaceutical Glass Packaging Bottles Revenue (million) Forecast, by Application 2020 & 2033
- Table 90: Oceania Pharmaceutical Glass Packaging Bottles Volume (K) Forecast, by Application 2020 & 2033
- Table 91: Rest of Asia Pacific Pharmaceutical Glass Packaging Bottles Revenue (million) Forecast, by Application 2020 & 2033
- Table 92: Rest of Asia Pacific Pharmaceutical Glass Packaging Bottles Volume (K) Forecast, by Application 2020 & 2033
Frequently Asked Questions
1. What is the projected Compound Annual Growth Rate (CAGR) of the Pharmaceutical Glass Packaging Bottles?
The projected CAGR is approximately XX%.
2. Which companies are prominent players in the Pharmaceutical Glass Packaging Bottles?
Key companies in the market include Schott, Corning, Nipro Pharma Corporation, Gerresheimer, Nippon Electric Glass, Stevanato Group, SGD Pharma, Ardagh, Bormioli Pharma, West Pharmaceutical, Sisecam Group, PGP Glass, Stoelzle Pharma, Shiotani Glass, Shandong Pharmaceutical Glass, ChongQing Zhengchuan Pharmaceutical Packaging, Anhui Deli Household Glass, Zhuzhou Kibing Group, Shandong Linuo Technical Glass, Triumph Junheng, Cangzhou Four STARS Glass.
3. What are the main segments of the Pharmaceutical Glass Packaging Bottles?
The market segments include Application, Types.
4. Can you provide details about the market size?
The market size is estimated to be USD XXX million as of 2022.
5. What are some drivers contributing to market growth?
N/A
6. What are the notable trends driving market growth?
N/A
7. Are there any restraints impacting market growth?
N/A
8. Can you provide examples of recent developments in the market?
N/A
9. What pricing options are available for accessing the report?
Pricing options include single-user, multi-user, and enterprise licenses priced at USD 3350.00, USD 5025.00, and USD 6700.00 respectively.
10. Is the market size provided in terms of value or volume?
The market size is provided in terms of value, measured in million and volume, measured in K.
11. Are there any specific market keywords associated with the report?
Yes, the market keyword associated with the report is "Pharmaceutical Glass Packaging Bottles," which aids in identifying and referencing the specific market segment covered.
12. How do I determine which pricing option suits my needs best?
The pricing options vary based on user requirements and access needs. Individual users may opt for single-user licenses, while businesses requiring broader access may choose multi-user or enterprise licenses for cost-effective access to the report.
13. Are there any additional resources or data provided in the Pharmaceutical Glass Packaging Bottles report?
While the report offers comprehensive insights, it's advisable to review the specific contents or supplementary materials provided to ascertain if additional resources or data are available.
14. How can I stay updated on further developments or reports in the Pharmaceutical Glass Packaging Bottles?
To stay informed about further developments, trends, and reports in the Pharmaceutical Glass Packaging Bottles, consider subscribing to industry newsletters, following relevant companies and organizations, or regularly checking reputable industry news sources and publications.
Methodology
Step 1 - Identification of Relevant Samples Size from Population Database


Step 2 - Approaches for Defining Global Market Size (Value, Volume* & Price*)

Note*: In applicable scenarios
Step 3 - Data Sources
Primary Research
- Web Analytics
- Survey Reports
- Research Institute
- Latest Research Reports
- Opinion Leaders
Secondary Research
- Annual Reports
- White Paper
- Latest Press Release
- Industry Association
- Paid Database
- Investor Presentations

Step 4 - Data Triangulation
Involves using different sources of information in order to increase the validity of a study
These sources are likely to be stakeholders in a program - participants, other researchers, program staff, other community members, and so on.
Then we put all data in single framework & apply various statistical tools to find out the dynamic on the market.
During the analysis stage, feedback from the stakeholder groups would be compared to determine areas of agreement as well as areas of divergence