

Key Insights
The pharmaceutical glass packaging market is experiencing significant expansion, propelled by escalating global demand for pharmaceutical products and the intrinsic advantages of glass as a superior packaging medium. Its pivotal role in safeguarding drug efficacy and ensuring patient safety underpins market stability. Glass offers an inert barrier, effectively protecting sensitive medications from external contaminants and degradation, making it the preferred choice for critical pharmaceutical applications, including injectables, lyophilized powders, and liquid oral medications. The market is segmented by product type (e.g., amber, clear, flint), capacity, application (e.g., injectables, oral solids), and end-user (e.g., hospitals, pharmacies). Leading industry players are actively investing in research and development to drive innovation and enhance product portfolios, with a strong focus on developing sustainable and eco-friendly packaging solutions in response to growing environmental consciousness. This includes exploring lighter-weight glass alternatives and optimizing recycling processes to minimize the industry's environmental impact. The competitive landscape features a mix of large multinational corporations and specialized regional entities, fostering ongoing consolidation and strategic partnerships aimed at increasing market share and broadening product offerings. Despite challenges such as rising raw material costs and evolving regulatory landscapes, the pharmaceutical glass packaging market outlook remains highly positive, indicating sustained growth throughout the forecast period.
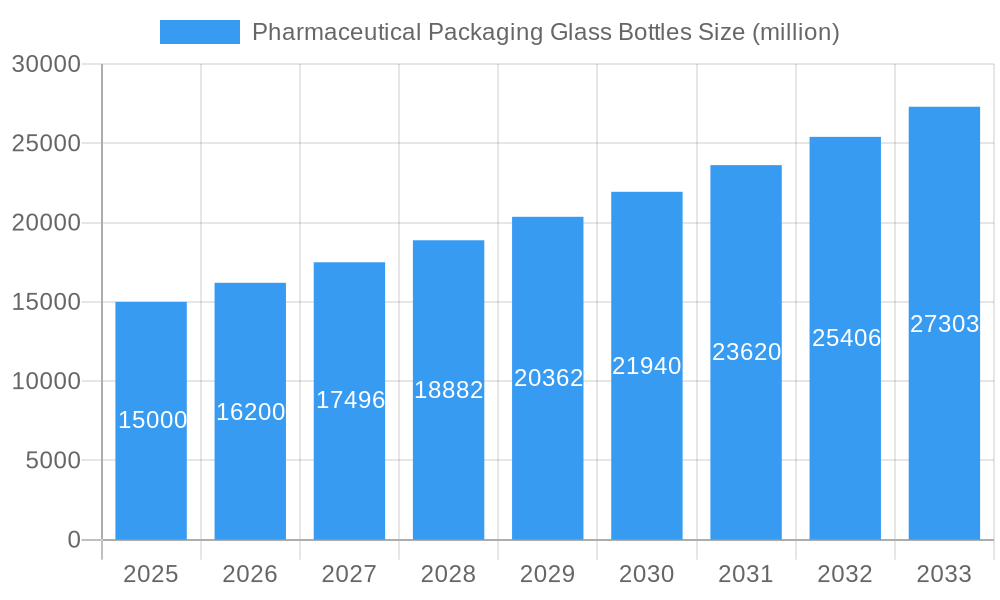
Pharmaceutical Packaging Glass Bottles Market Size (In Billion)
The pharmaceutical packaging glass bottles market is projected for robust expansion, with an estimated market size of $7.2 billion by 2025, exhibiting a Compound Annual Growth Rate (CAGR) of 5.9%. This growth trajectory presents substantial opportunities for manufacturers and suppliers. Key growth drivers include the increasing prevalence of chronic diseases, heightened demand for injectable pharmaceuticals, and the broader adoption of advanced drug delivery systems. Moreover, stringent regulatory mandates for product safety and traceability are expected to stimulate advancements in packaging design and manufacturing technologies. Potential market restraints encompass rising raw material and energy costs, alongside increasing competition from alternative packaging materials such as plastics. Regional market dynamics are anticipated to mirror variations in pharmaceutical production and consumption. While North America and Europe are expected to maintain significant market shares, demand from emerging economies in Asia and Latin America is projected to rise gradually over the forecast period.
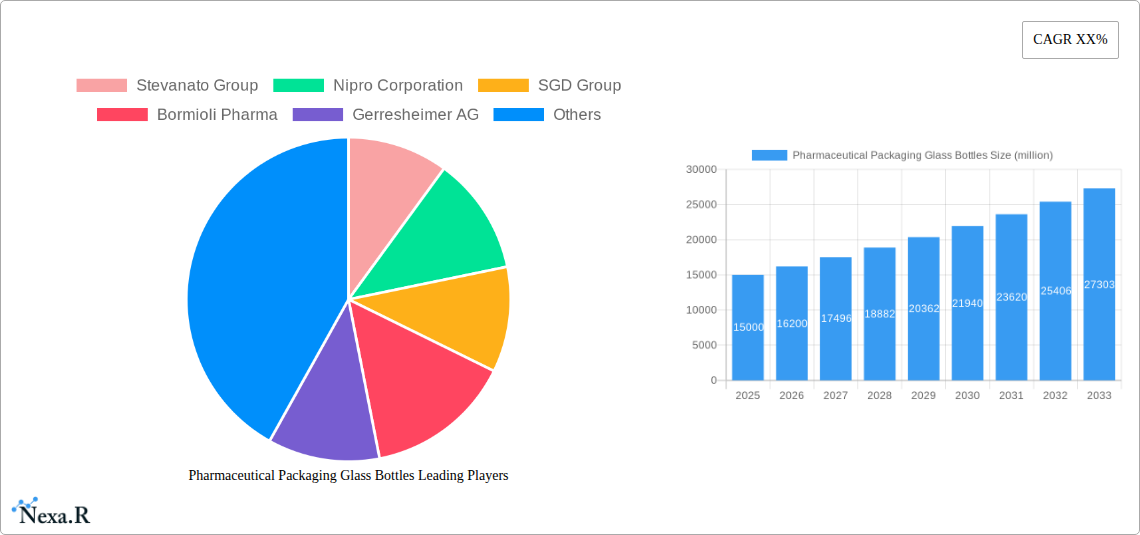
Pharmaceutical Packaging Glass Bottles Company Market Share
Pharmaceutical Packaging Glass Bottles Market Report: 2019-2033
This comprehensive report provides a detailed analysis of the global Pharmaceutical Packaging Glass Bottles market, offering invaluable insights for industry professionals, investors, and strategic decision-makers. The study covers the period 2019-2033, with a focus on the forecast period 2025-2033, using 2025 as the base year. The report segments the market by type (e.g., vials, ampoules, bottles) and application (e.g., injectables, oral solids, liquids). Market size is expressed in million units.
Pharmaceutical Packaging Glass Bottles Market Dynamics & Structure
The global pharmaceutical packaging glass bottles market is characterized by moderate concentration, with several key players holding significant market share. The market's dynamics are shaped by stringent regulatory frameworks, continuous technological innovation in materials and manufacturing processes, and the growing demand for specialized packaging solutions. While glass remains the preferred material due to its inertness and barrier properties, competitive pressures arise from alternative packaging materials like plastic. Mergers and acquisitions (M&A) activity has been moderate, primarily driven by companies seeking to expand their product portfolios and geographical reach.
- Market Concentration: Moderately concentrated, with the top 5 players holding approximately xx% market share in 2025.
- Technological Innovation: Focus on lightweighting, improved barrier properties, and sustainable manufacturing processes.
- Regulatory Landscape: Stringent regulations regarding material compatibility, sterility, and labeling.
- Competitive Substitutes: Plastic and other alternative packaging materials present competitive pressure.
- End-User Demographics: Primarily driven by pharmaceutical and biotechnology companies.
- M&A Activity: xx M&A deals recorded between 2019 and 2024, with an average deal value of xx million USD.
Pharmaceutical Packaging Glass Bottles Growth Trends & Insights
The pharmaceutical packaging glass bottles market witnessed a steady growth from 2019 to 2024, driven by factors such as the increasing global pharmaceutical production and the continued preference for glass packaging in sensitive drug delivery applications. Technological advancements, such as the development of lighter and more durable glass materials, further boosted the market growth. The market is expected to maintain a positive Compound Annual Growth Rate (CAGR) of xx% during the forecast period (2025-2033), fueled by increasing demand from emerging economies and the rising adoption of advanced drug delivery systems. Market penetration in developing regions remains a significant opportunity, while technological disruptions in materials science and manufacturing continue to shape the industry landscape. Consumer behavior shifts towards eco-friendly packaging solutions are also starting to influence product development and market trends. The market size reached xx million units in 2024 and is projected to reach xx million units by 2033.
Dominant Regions, Countries, or Segments in Pharmaceutical Packaging Glass Bottles
North America and Europe currently dominate the pharmaceutical packaging glass bottles market, driven by advanced healthcare infrastructure, stringent regulatory frameworks, and a robust pharmaceutical industry. However, Asia-Pacific is emerging as a key growth region, driven by expanding pharmaceutical manufacturing capabilities and increasing healthcare expenditure.
- Key Drivers in North America: High pharmaceutical R&D spending, stringent quality standards, and established supply chains.
- Key Drivers in Europe: Well-established pharmaceutical industry, strong regulatory environment, and high adoption of advanced drug delivery systems.
- Key Drivers in Asia-Pacific: Rapid growth of pharmaceutical manufacturing, rising healthcare expenditure, and increasing demand for injectable drugs.
- Market Share: North America holds xx% of the global market share in 2025, followed by Europe with xx% and Asia-Pacific with xx%.
Pharmaceutical Packaging Glass Bottles Product Landscape
The pharmaceutical packaging glass bottles market offers a diverse range of products, including vials, ampoules, and bottles of varying sizes and designs. Innovations focus on improving barrier properties to enhance product stability, reducing weight for improved transportation efficiency, and incorporating features that enhance ease of handling and reduce breakage. Technological advancements in glass manufacturing techniques allow for higher precision and consistency in product dimensions, contributing to improved filling and packaging processes. Unique selling propositions often center around enhanced sterility, superior barrier protection, and sustainable manufacturing practices.
Key Drivers, Barriers & Challenges in Pharmaceutical Packaging Glass Bottles
Key Drivers:
- Rising demand for injectable drugs and biologics.
- Increasing focus on pharmaceutical product stability and safety.
- Growing adoption of advanced drug delivery systems.
Key Challenges:
- Fluctuations in raw material prices (e.g., silica sand).
- Stringent regulatory compliance requirements.
- Intense competition from alternative packaging materials.
- Supply chain disruptions leading to potential shortages (xx% estimated impact on production in 2024 due to supply chain issues).
Emerging Opportunities in Pharmaceutical Packaging Glass Bottles
- Growth in emerging markets, especially in Asia-Pacific and Latin America.
- Increasing demand for customized and specialized packaging solutions.
- Opportunities presented by the growing biopharmaceuticals sector.
- Development of innovative glass materials with improved performance characteristics.
Growth Accelerators in the Pharmaceutical Packaging Glass Bottles Industry
Technological breakthroughs in glass manufacturing, strategic partnerships between packaging companies and pharmaceutical manufacturers, and market expansion into emerging economies are key catalysts for long-term growth. The development of sustainable and environmentally friendly glass packaging solutions further boosts market potential and aligns with increasing industry focus on sustainability.
Key Players Shaping the Pharmaceutical Packaging Glass Bottles Market
- Stevanato Group
- Nipro Corporation
- SGD Group
- Bormioli Pharma
- Gerresheimer AG
- Piramal Glass Private Limited
- West Pharmaceutical Services, Inc
- Origin Pharma Packaging
- Schott AG
- SMYPC (Cospak)
- Bonpak
Notable Milestones in Pharmaceutical Packaging Glass Bottles Sector
- 2021: Gerresheimer AG launched a new line of sustainable glass vials.
- 2022: Stevanato Group acquired a company specializing in glass container manufacturing.
- 2023: Increased investment in R&D for lightweight and sustainable glass packaging solutions across the industry. (Specific examples need further research)
- 2024: Significant supply chain disruptions impacted production across the sector. (Specific examples need further research)
In-Depth Pharmaceutical Packaging Glass Bottles Market Outlook
The future of the pharmaceutical packaging glass bottles market is bright, driven by the factors already discussed. Continued technological innovation, strategic partnerships, and expansion into emerging markets will fuel market growth. Opportunities lie in the development of customized and specialized packaging solutions for increasingly complex drug delivery systems, as well as in the adoption of sustainable manufacturing practices. The market is poised for continued expansion, with significant growth potential in both developed and developing economies.
Pharmaceutical Packaging Glass Bottles Segmentation
-
1. Application
- 1.1. Injectable
- 1.2. Topical
- 1.3. Oral
- 1.4. Nasal
- 1.5. Others
-
2. Types
- 2.1. Regular Soda Lime Glass
- 2.2. Treated Soda-Lime Glass
- 2.3. Borosilicate Glass
Pharmaceutical Packaging Glass Bottles Segmentation By Geography
-
1. North America
- 1.1. United States
- 1.2. Canada
- 1.3. Mexico
-
2. South America
- 2.1. Brazil
- 2.2. Argentina
- 2.3. Rest of South America
-
3. Europe
- 3.1. United Kingdom
- 3.2. Germany
- 3.3. France
- 3.4. Italy
- 3.5. Spain
- 3.6. Russia
- 3.7. Benelux
- 3.8. Nordics
- 3.9. Rest of Europe
-
4. Middle East & Africa
- 4.1. Turkey
- 4.2. Israel
- 4.3. GCC
- 4.4. North Africa
- 4.5. South Africa
- 4.6. Rest of Middle East & Africa
-
5. Asia Pacific
- 5.1. China
- 5.2. India
- 5.3. Japan
- 5.4. South Korea
- 5.5. ASEAN
- 5.6. Oceania
- 5.7. Rest of Asia Pacific
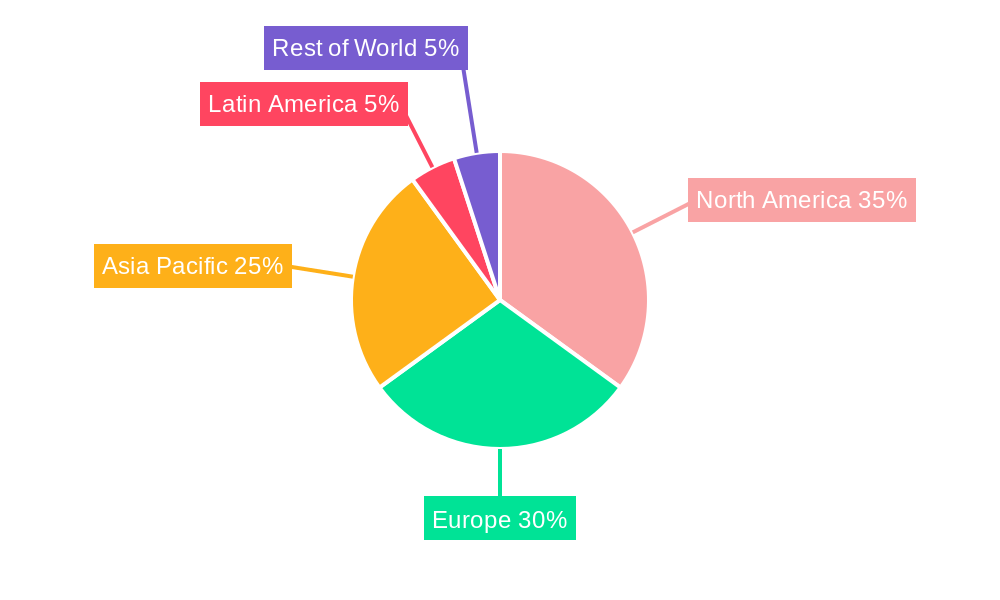
Pharmaceutical Packaging Glass Bottles Regional Market Share
Geographic Coverage of Pharmaceutical Packaging Glass Bottles
Pharmaceutical Packaging Glass Bottles REPORT HIGHLIGHTS
| Aspects | Details |
|---|---|
| Study Period | 2020-2034 |
| Base Year | 2025 |
| Estimated Year | 2026 |
| Forecast Period | 2026-2034 |
| Historical Period | 2020-2025 |
| Growth Rate | CAGR of 5.9% from 2020-2034 |
| Segmentation |
|
Table of Contents
- 1. Introduction
- 1.1. Research Scope
- 1.2. Market Segmentation
- 1.3. Research Methodology
- 1.4. Definitions and Assumptions
- 2. Executive Summary
- 2.1. Introduction
- 3. Market Dynamics
- 3.1. Introduction
- 3.2. Market Drivers
- 3.3. Market Restrains
- 3.4. Market Trends
- 4. Market Factor Analysis
- 4.1. Porters Five Forces
- 4.2. Supply/Value Chain
- 4.3. PESTEL analysis
- 4.4. Market Entropy
- 4.5. Patent/Trademark Analysis
- 5. Global Pharmaceutical Packaging Glass Bottles Analysis, Insights and Forecast, 2020-2032
- 5.1. Market Analysis, Insights and Forecast - by Application
- 5.1.1. Injectable
- 5.1.2. Topical
- 5.1.3. Oral
- 5.1.4. Nasal
- 5.1.5. Others
- 5.2. Market Analysis, Insights and Forecast - by Types
- 5.2.1. Regular Soda Lime Glass
- 5.2.2. Treated Soda-Lime Glass
- 5.2.3. Borosilicate Glass
- 5.3. Market Analysis, Insights and Forecast - by Region
- 5.3.1. North America
- 5.3.2. South America
- 5.3.3. Europe
- 5.3.4. Middle East & Africa
- 5.3.5. Asia Pacific
- 5.1. Market Analysis, Insights and Forecast - by Application
- 6. North America Pharmaceutical Packaging Glass Bottles Analysis, Insights and Forecast, 2020-2032
- 6.1. Market Analysis, Insights and Forecast - by Application
- 6.1.1. Injectable
- 6.1.2. Topical
- 6.1.3. Oral
- 6.1.4. Nasal
- 6.1.5. Others
- 6.2. Market Analysis, Insights and Forecast - by Types
- 6.2.1. Regular Soda Lime Glass
- 6.2.2. Treated Soda-Lime Glass
- 6.2.3. Borosilicate Glass
- 6.1. Market Analysis, Insights and Forecast - by Application
- 7. South America Pharmaceutical Packaging Glass Bottles Analysis, Insights and Forecast, 2020-2032
- 7.1. Market Analysis, Insights and Forecast - by Application
- 7.1.1. Injectable
- 7.1.2. Topical
- 7.1.3. Oral
- 7.1.4. Nasal
- 7.1.5. Others
- 7.2. Market Analysis, Insights and Forecast - by Types
- 7.2.1. Regular Soda Lime Glass
- 7.2.2. Treated Soda-Lime Glass
- 7.2.3. Borosilicate Glass
- 7.1. Market Analysis, Insights and Forecast - by Application
- 8. Europe Pharmaceutical Packaging Glass Bottles Analysis, Insights and Forecast, 2020-2032
- 8.1. Market Analysis, Insights and Forecast - by Application
- 8.1.1. Injectable
- 8.1.2. Topical
- 8.1.3. Oral
- 8.1.4. Nasal
- 8.1.5. Others
- 8.2. Market Analysis, Insights and Forecast - by Types
- 8.2.1. Regular Soda Lime Glass
- 8.2.2. Treated Soda-Lime Glass
- 8.2.3. Borosilicate Glass
- 8.1. Market Analysis, Insights and Forecast - by Application
- 9. Middle East & Africa Pharmaceutical Packaging Glass Bottles Analysis, Insights and Forecast, 2020-2032
- 9.1. Market Analysis, Insights and Forecast - by Application
- 9.1.1. Injectable
- 9.1.2. Topical
- 9.1.3. Oral
- 9.1.4. Nasal
- 9.1.5. Others
- 9.2. Market Analysis, Insights and Forecast - by Types
- 9.2.1. Regular Soda Lime Glass
- 9.2.2. Treated Soda-Lime Glass
- 9.2.3. Borosilicate Glass
- 9.1. Market Analysis, Insights and Forecast - by Application
- 10. Asia Pacific Pharmaceutical Packaging Glass Bottles Analysis, Insights and Forecast, 2020-2032
- 10.1. Market Analysis, Insights and Forecast - by Application
- 10.1.1. Injectable
- 10.1.2. Topical
- 10.1.3. Oral
- 10.1.4. Nasal
- 10.1.5. Others
- 10.2. Market Analysis, Insights and Forecast - by Types
- 10.2.1. Regular Soda Lime Glass
- 10.2.2. Treated Soda-Lime Glass
- 10.2.3. Borosilicate Glass
- 10.1. Market Analysis, Insights and Forecast - by Application
- 11. Competitive Analysis
- 11.1. Global Market Share Analysis 2025
- 11.2. Company Profiles
- 11.2.1 Stevanato Group
- 11.2.1.1. Overview
- 11.2.1.2. Products
- 11.2.1.3. SWOT Analysis
- 11.2.1.4. Recent Developments
- 11.2.1.5. Financials (Based on Availability)
- 11.2.2 Nipro Corporation
- 11.2.2.1. Overview
- 11.2.2.2. Products
- 11.2.2.3. SWOT Analysis
- 11.2.2.4. Recent Developments
- 11.2.2.5. Financials (Based on Availability)
- 11.2.3 SGD Group
- 11.2.3.1. Overview
- 11.2.3.2. Products
- 11.2.3.3. SWOT Analysis
- 11.2.3.4. Recent Developments
- 11.2.3.5. Financials (Based on Availability)
- 11.2.4 Bormioli Pharma
- 11.2.4.1. Overview
- 11.2.4.2. Products
- 11.2.4.3. SWOT Analysis
- 11.2.4.4. Recent Developments
- 11.2.4.5. Financials (Based on Availability)
- 11.2.5 Gerresheimer AG
- 11.2.5.1. Overview
- 11.2.5.2. Products
- 11.2.5.3. SWOT Analysis
- 11.2.5.4. Recent Developments
- 11.2.5.5. Financials (Based on Availability)
- 11.2.6 Piramal Glass Private Limited
- 11.2.6.1. Overview
- 11.2.6.2. Products
- 11.2.6.3. SWOT Analysis
- 11.2.6.4. Recent Developments
- 11.2.6.5. Financials (Based on Availability)
- 11.2.7 West Pharmaceutical Services
- 11.2.7.1. Overview
- 11.2.7.2. Products
- 11.2.7.3. SWOT Analysis
- 11.2.7.4. Recent Developments
- 11.2.7.5. Financials (Based on Availability)
- 11.2.8 Inc
- 11.2.8.1. Overview
- 11.2.8.2. Products
- 11.2.8.3. SWOT Analysis
- 11.2.8.4. Recent Developments
- 11.2.8.5. Financials (Based on Availability)
- 11.2.9 Origin Pharma Packaging
- 11.2.9.1. Overview
- 11.2.9.2. Products
- 11.2.9.3. SWOT Analysis
- 11.2.9.4. Recent Developments
- 11.2.9.5. Financials (Based on Availability)
- 11.2.10 Schott AG
- 11.2.10.1. Overview
- 11.2.10.2. Products
- 11.2.10.3. SWOT Analysis
- 11.2.10.4. Recent Developments
- 11.2.10.5. Financials (Based on Availability)
- 11.2.11 SMYPC (Cospak)
- 11.2.11.1. Overview
- 11.2.11.2. Products
- 11.2.11.3. SWOT Analysis
- 11.2.11.4. Recent Developments
- 11.2.11.5. Financials (Based on Availability)
- 11.2.12 Bonpak
- 11.2.12.1. Overview
- 11.2.12.2. Products
- 11.2.12.3. SWOT Analysis
- 11.2.12.4. Recent Developments
- 11.2.12.5. Financials (Based on Availability)
- 11.2.1 Stevanato Group
List of Figures
- Figure 1: Global Pharmaceutical Packaging Glass Bottles Revenue Breakdown (billion, %) by Region 2025 & 2033
- Figure 2: North America Pharmaceutical Packaging Glass Bottles Revenue (billion), by Application 2025 & 2033
- Figure 3: North America Pharmaceutical Packaging Glass Bottles Revenue Share (%), by Application 2025 & 2033
- Figure 4: North America Pharmaceutical Packaging Glass Bottles Revenue (billion), by Types 2025 & 2033
- Figure 5: North America Pharmaceutical Packaging Glass Bottles Revenue Share (%), by Types 2025 & 2033
- Figure 6: North America Pharmaceutical Packaging Glass Bottles Revenue (billion), by Country 2025 & 2033
- Figure 7: North America Pharmaceutical Packaging Glass Bottles Revenue Share (%), by Country 2025 & 2033
- Figure 8: South America Pharmaceutical Packaging Glass Bottles Revenue (billion), by Application 2025 & 2033
- Figure 9: South America Pharmaceutical Packaging Glass Bottles Revenue Share (%), by Application 2025 & 2033
- Figure 10: South America Pharmaceutical Packaging Glass Bottles Revenue (billion), by Types 2025 & 2033
- Figure 11: South America Pharmaceutical Packaging Glass Bottles Revenue Share (%), by Types 2025 & 2033
- Figure 12: South America Pharmaceutical Packaging Glass Bottles Revenue (billion), by Country 2025 & 2033
- Figure 13: South America Pharmaceutical Packaging Glass Bottles Revenue Share (%), by Country 2025 & 2033
- Figure 14: Europe Pharmaceutical Packaging Glass Bottles Revenue (billion), by Application 2025 & 2033
- Figure 15: Europe Pharmaceutical Packaging Glass Bottles Revenue Share (%), by Application 2025 & 2033
- Figure 16: Europe Pharmaceutical Packaging Glass Bottles Revenue (billion), by Types 2025 & 2033
- Figure 17: Europe Pharmaceutical Packaging Glass Bottles Revenue Share (%), by Types 2025 & 2033
- Figure 18: Europe Pharmaceutical Packaging Glass Bottles Revenue (billion), by Country 2025 & 2033
- Figure 19: Europe Pharmaceutical Packaging Glass Bottles Revenue Share (%), by Country 2025 & 2033
- Figure 20: Middle East & Africa Pharmaceutical Packaging Glass Bottles Revenue (billion), by Application 2025 & 2033
- Figure 21: Middle East & Africa Pharmaceutical Packaging Glass Bottles Revenue Share (%), by Application 2025 & 2033
- Figure 22: Middle East & Africa Pharmaceutical Packaging Glass Bottles Revenue (billion), by Types 2025 & 2033
- Figure 23: Middle East & Africa Pharmaceutical Packaging Glass Bottles Revenue Share (%), by Types 2025 & 2033
- Figure 24: Middle East & Africa Pharmaceutical Packaging Glass Bottles Revenue (billion), by Country 2025 & 2033
- Figure 25: Middle East & Africa Pharmaceutical Packaging Glass Bottles Revenue Share (%), by Country 2025 & 2033
- Figure 26: Asia Pacific Pharmaceutical Packaging Glass Bottles Revenue (billion), by Application 2025 & 2033
- Figure 27: Asia Pacific Pharmaceutical Packaging Glass Bottles Revenue Share (%), by Application 2025 & 2033
- Figure 28: Asia Pacific Pharmaceutical Packaging Glass Bottles Revenue (billion), by Types 2025 & 2033
- Figure 29: Asia Pacific Pharmaceutical Packaging Glass Bottles Revenue Share (%), by Types 2025 & 2033
- Figure 30: Asia Pacific Pharmaceutical Packaging Glass Bottles Revenue (billion), by Country 2025 & 2033
- Figure 31: Asia Pacific Pharmaceutical Packaging Glass Bottles Revenue Share (%), by Country 2025 & 2033
List of Tables
- Table 1: Global Pharmaceutical Packaging Glass Bottles Revenue billion Forecast, by Application 2020 & 2033
- Table 2: Global Pharmaceutical Packaging Glass Bottles Revenue billion Forecast, by Types 2020 & 2033
- Table 3: Global Pharmaceutical Packaging Glass Bottles Revenue billion Forecast, by Region 2020 & 2033
- Table 4: Global Pharmaceutical Packaging Glass Bottles Revenue billion Forecast, by Application 2020 & 2033
- Table 5: Global Pharmaceutical Packaging Glass Bottles Revenue billion Forecast, by Types 2020 & 2033
- Table 6: Global Pharmaceutical Packaging Glass Bottles Revenue billion Forecast, by Country 2020 & 2033
- Table 7: United States Pharmaceutical Packaging Glass Bottles Revenue (billion) Forecast, by Application 2020 & 2033
- Table 8: Canada Pharmaceutical Packaging Glass Bottles Revenue (billion) Forecast, by Application 2020 & 2033
- Table 9: Mexico Pharmaceutical Packaging Glass Bottles Revenue (billion) Forecast, by Application 2020 & 2033
- Table 10: Global Pharmaceutical Packaging Glass Bottles Revenue billion Forecast, by Application 2020 & 2033
- Table 11: Global Pharmaceutical Packaging Glass Bottles Revenue billion Forecast, by Types 2020 & 2033
- Table 12: Global Pharmaceutical Packaging Glass Bottles Revenue billion Forecast, by Country 2020 & 2033
- Table 13: Brazil Pharmaceutical Packaging Glass Bottles Revenue (billion) Forecast, by Application 2020 & 2033
- Table 14: Argentina Pharmaceutical Packaging Glass Bottles Revenue (billion) Forecast, by Application 2020 & 2033
- Table 15: Rest of South America Pharmaceutical Packaging Glass Bottles Revenue (billion) Forecast, by Application 2020 & 2033
- Table 16: Global Pharmaceutical Packaging Glass Bottles Revenue billion Forecast, by Application 2020 & 2033
- Table 17: Global Pharmaceutical Packaging Glass Bottles Revenue billion Forecast, by Types 2020 & 2033
- Table 18: Global Pharmaceutical Packaging Glass Bottles Revenue billion Forecast, by Country 2020 & 2033
- Table 19: United Kingdom Pharmaceutical Packaging Glass Bottles Revenue (billion) Forecast, by Application 2020 & 2033
- Table 20: Germany Pharmaceutical Packaging Glass Bottles Revenue (billion) Forecast, by Application 2020 & 2033
- Table 21: France Pharmaceutical Packaging Glass Bottles Revenue (billion) Forecast, by Application 2020 & 2033
- Table 22: Italy Pharmaceutical Packaging Glass Bottles Revenue (billion) Forecast, by Application 2020 & 2033
- Table 23: Spain Pharmaceutical Packaging Glass Bottles Revenue (billion) Forecast, by Application 2020 & 2033
- Table 24: Russia Pharmaceutical Packaging Glass Bottles Revenue (billion) Forecast, by Application 2020 & 2033
- Table 25: Benelux Pharmaceutical Packaging Glass Bottles Revenue (billion) Forecast, by Application 2020 & 2033
- Table 26: Nordics Pharmaceutical Packaging Glass Bottles Revenue (billion) Forecast, by Application 2020 & 2033
- Table 27: Rest of Europe Pharmaceutical Packaging Glass Bottles Revenue (billion) Forecast, by Application 2020 & 2033
- Table 28: Global Pharmaceutical Packaging Glass Bottles Revenue billion Forecast, by Application 2020 & 2033
- Table 29: Global Pharmaceutical Packaging Glass Bottles Revenue billion Forecast, by Types 2020 & 2033
- Table 30: Global Pharmaceutical Packaging Glass Bottles Revenue billion Forecast, by Country 2020 & 2033
- Table 31: Turkey Pharmaceutical Packaging Glass Bottles Revenue (billion) Forecast, by Application 2020 & 2033
- Table 32: Israel Pharmaceutical Packaging Glass Bottles Revenue (billion) Forecast, by Application 2020 & 2033
- Table 33: GCC Pharmaceutical Packaging Glass Bottles Revenue (billion) Forecast, by Application 2020 & 2033
- Table 34: North Africa Pharmaceutical Packaging Glass Bottles Revenue (billion) Forecast, by Application 2020 & 2033
- Table 35: South Africa Pharmaceutical Packaging Glass Bottles Revenue (billion) Forecast, by Application 2020 & 2033
- Table 36: Rest of Middle East & Africa Pharmaceutical Packaging Glass Bottles Revenue (billion) Forecast, by Application 2020 & 2033
- Table 37: Global Pharmaceutical Packaging Glass Bottles Revenue billion Forecast, by Application 2020 & 2033
- Table 38: Global Pharmaceutical Packaging Glass Bottles Revenue billion Forecast, by Types 2020 & 2033
- Table 39: Global Pharmaceutical Packaging Glass Bottles Revenue billion Forecast, by Country 2020 & 2033
- Table 40: China Pharmaceutical Packaging Glass Bottles Revenue (billion) Forecast, by Application 2020 & 2033
- Table 41: India Pharmaceutical Packaging Glass Bottles Revenue (billion) Forecast, by Application 2020 & 2033
- Table 42: Japan Pharmaceutical Packaging Glass Bottles Revenue (billion) Forecast, by Application 2020 & 2033
- Table 43: South Korea Pharmaceutical Packaging Glass Bottles Revenue (billion) Forecast, by Application 2020 & 2033
- Table 44: ASEAN Pharmaceutical Packaging Glass Bottles Revenue (billion) Forecast, by Application 2020 & 2033
- Table 45: Oceania Pharmaceutical Packaging Glass Bottles Revenue (billion) Forecast, by Application 2020 & 2033
- Table 46: Rest of Asia Pacific Pharmaceutical Packaging Glass Bottles Revenue (billion) Forecast, by Application 2020 & 2033
Frequently Asked Questions
1. What is the projected Compound Annual Growth Rate (CAGR) of the Pharmaceutical Packaging Glass Bottles?
The projected CAGR is approximately 5.9%.
2. Which companies are prominent players in the Pharmaceutical Packaging Glass Bottles?
Key companies in the market include Stevanato Group, Nipro Corporation, SGD Group, Bormioli Pharma, Gerresheimer AG, Piramal Glass Private Limited, West Pharmaceutical Services, Inc, Origin Pharma Packaging, Schott AG, SMYPC (Cospak), Bonpak.
3. What are the main segments of the Pharmaceutical Packaging Glass Bottles?
The market segments include Application, Types.
4. Can you provide details about the market size?
The market size is estimated to be USD 7.2 billion as of 2022.
5. What are some drivers contributing to market growth?
N/A
6. What are the notable trends driving market growth?
N/A
7. Are there any restraints impacting market growth?
N/A
8. Can you provide examples of recent developments in the market?
N/A
9. What pricing options are available for accessing the report?
Pricing options include single-user, multi-user, and enterprise licenses priced at USD 4900.00, USD 7350.00, and USD 9800.00 respectively.
10. Is the market size provided in terms of value or volume?
The market size is provided in terms of value, measured in billion.
11. Are there any specific market keywords associated with the report?
Yes, the market keyword associated with the report is "Pharmaceutical Packaging Glass Bottles," which aids in identifying and referencing the specific market segment covered.
12. How do I determine which pricing option suits my needs best?
The pricing options vary based on user requirements and access needs. Individual users may opt for single-user licenses, while businesses requiring broader access may choose multi-user or enterprise licenses for cost-effective access to the report.
13. Are there any additional resources or data provided in the Pharmaceutical Packaging Glass Bottles report?
While the report offers comprehensive insights, it's advisable to review the specific contents or supplementary materials provided to ascertain if additional resources or data are available.
14. How can I stay updated on further developments or reports in the Pharmaceutical Packaging Glass Bottles?
To stay informed about further developments, trends, and reports in the Pharmaceutical Packaging Glass Bottles, consider subscribing to industry newsletters, following relevant companies and organizations, or regularly checking reputable industry news sources and publications.
Methodology
Step 1 - Identification of Relevant Samples Size from Population Database


Step 2 - Approaches for Defining Global Market Size (Value, Volume* & Price*)

Note*: In applicable scenarios
Step 3 - Data Sources
Primary Research
- Web Analytics
- Survey Reports
- Research Institute
- Latest Research Reports
- Opinion Leaders
Secondary Research
- Annual Reports
- White Paper
- Latest Press Release
- Industry Association
- Paid Database
- Investor Presentations

Step 4 - Data Triangulation
Involves using different sources of information in order to increase the validity of a study
These sources are likely to be stakeholders in a program - participants, other researchers, program staff, other community members, and so on.
Then we put all data in single framework & apply various statistical tools to find out the dynamic on the market.
During the analysis stage, feedback from the stakeholder groups would be compared to determine areas of agreement as well as areas of divergence