

Key Insights
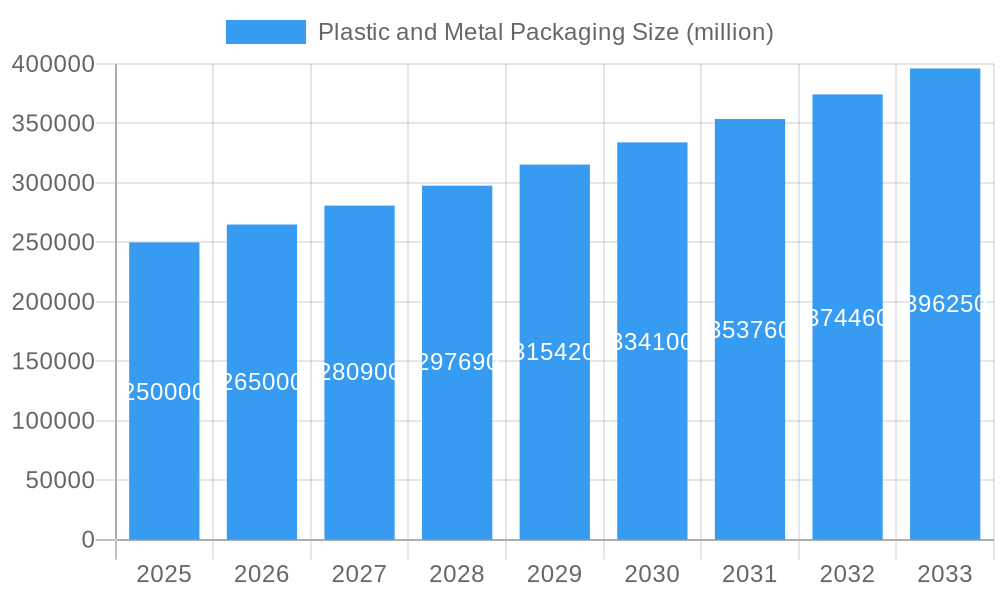
The global plastic and metal packaging market is projected for substantial expansion, driven by escalating demand for secure and convenient food packaging, the rapid growth of e-commerce necessitating robust protective solutions, and the continuous expansion of the beverage sector. The market size is estimated at $141.7 billion in the base year 2025, with a projected Compound Annual Growth Rate (CAGR) of 3.9% from 2025 to 2033. Key growth accelerators include the increasing adoption of sustainable and eco-friendly packaging, the integration of advanced technologies such as smart packaging, and a growing preference for lightweight, recyclable materials. Market challenges encompass volatile raw material costs, stringent environmental regulations, and plastic waste management concerns. Regional market leadership is currently held by North America and Europe, with Asia-Pacific anticipated to exhibit the fastest growth.
Plastic and Metal Packaging Market Size (In Billion)
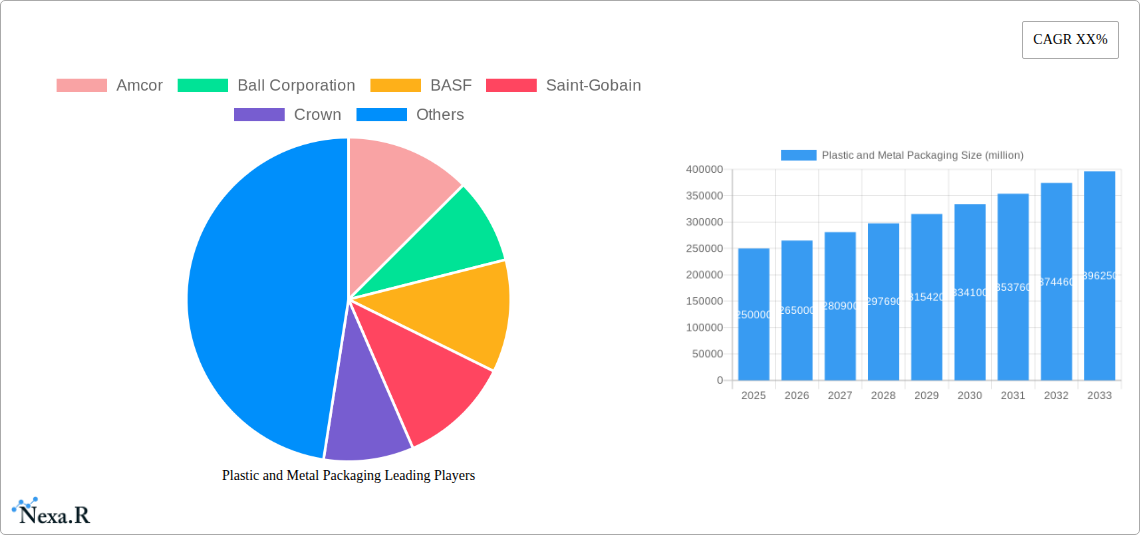
Leading market participants such as Amcor, Ball Corporation, BASF, Saint-Gobain, and Crown Holdings are prioritizing research and development to deliver innovative packaging solutions aligned with consumer preferences and sustainability goals. The market is segmented by material type (plastic, metal, composite), packaging format (bottles, cans, jars, pouches), and end-use industry (food & beverage, pharmaceutical, personal care). Strategic imperatives for major companies involve portfolio diversification, global market expansion, and strategic alliances. The overarching trend towards sustainable packaging is fundamentally reshaping the market's future, motivating a strong emphasis on eco-conscious materials and manufacturing processes.
Plastic and Metal Packaging Company Market Share
Plastic and Metal Packaging Market Report: 2019-2033
This comprehensive report provides a detailed analysis of the global plastic and metal packaging market, offering invaluable insights for industry professionals, investors, and strategic decision-makers. The study period covers 2019-2033, with a base year of 2025 and a forecast period of 2025-2033. The report meticulously examines market dynamics, growth trends, regional dominance, product landscapes, challenges, opportunities, and key players, delivering a 360-degree view of this dynamic sector. Parent market is Packaging and child market is Plastic and Metal Packaging.
Plastic and Metal Packaging Market Dynamics & Structure
The global plastic and metal packaging market is characterized by moderate concentration, with a few major players holding significant market share. The market is driven by technological innovations in lightweighting, barrier properties, and sustainable materials. Stringent regulatory frameworks concerning recyclability and environmental impact significantly influence market strategies. Competitive substitutes, such as paper-based and biodegradable alternatives, are emerging, impacting market share. End-user demographics, particularly shifting consumer preferences towards convenience and sustainability, are reshaping demand patterns. M&A activity remains robust, with approximately xx deals completed in the historical period (2019-2024), representing a xx million units value.
- Market Concentration: Top 5 players hold approximately xx% market share in 2025.
- Technological Innovation: Focus on lightweighting, barrier enhancements, and sustainable materials (e.g., recycled content).
- Regulatory Landscape: Growing emphasis on recyclability, waste reduction, and circular economy initiatives.
- Competitive Substitutes: Increased adoption of paper-based and biodegradable alternatives poses a challenge.
- End-User Demographics: Consumer preference for convenience and sustainable packaging influences demand.
- M&A Activity: Consolidation and expansion strategies drive significant M&A activity.
Plastic and Metal Packaging Growth Trends & Insights
The global plastic and metal packaging market experienced a compound annual growth rate (CAGR) of xx% during the historical period (2019-2024), reaching a market size of xx million units in 2024. The market is projected to continue its growth trajectory, with a forecasted CAGR of xx% from 2025 to 2033, driven by factors such as increasing demand from the food and beverage, personal care, and pharmaceutical industries. Technological disruptions, including the introduction of innovative barrier films and sustainable packaging solutions, are accelerating market growth. Shifting consumer preferences towards e-commerce and convenience are further fueling market expansion. Market penetration of sustainable packaging materials is expected to increase from xx% in 2025 to xx% by 2033. (Specific data based on analysis conducted using XXX methodology.)
Dominant Regions, Countries, or Segments in Plastic and Metal Packaging
North America and Europe currently dominate the plastic and metal packaging market, driven by robust economies, well-established infrastructure, and high consumer spending. However, Asia-Pacific is expected to witness significant growth during the forecast period, fueled by rapid industrialization and urbanization. Within segments, food and beverage packaging holds the largest market share, due to consistently high demand.
- North America: Strong regulatory framework focused on sustainability but challenges remain regarding recycling infrastructure.
- Europe: High adoption of sustainable packaging solutions but faces pressure from rising material costs.
- Asia-Pacific: Rapid economic growth and increasing disposable incomes drive strong growth, but infrastructure development is key.
- Food and Beverage: Largest segment due to consistent demand and diverse packaging requirements.
Plastic and Metal Packaging Product Landscape
The plastic and metal packaging market offers a diverse range of products, including cans, bottles, jars, films, flexible packaging, and closures. Recent innovations focus on lightweighting, improved barrier properties, enhanced printability, and incorporation of recycled content to meet sustainability requirements. Unique selling propositions often center around convenience, aesthetics, and improved shelf life. Advancements in material science and manufacturing processes drive continuous product improvements and competitiveness.
Key Drivers, Barriers & Challenges in Plastic and Metal Packaging
Key Drivers:
- Increasing demand from various end-use sectors (food & beverage, personal care, pharmaceuticals).
- Technological advancements leading to enhanced packaging performance and sustainability.
- Favorable government policies and initiatives promoting sustainable packaging.
Key Challenges and Restraints:
- Fluctuating raw material prices and supply chain disruptions impacting profitability.
- Stringent environmental regulations demanding higher recyclability and reduced plastic use.
- Intense competition from alternative packaging materials and evolving consumer preferences. (XX million units of market share lost due to competition in 2024.)
Emerging Opportunities in Plastic and Metal Packaging
- Growing demand for sustainable and eco-friendly packaging solutions.
- Expansion into emerging markets with rising consumer spending and demand for packaged goods.
- Development of innovative packaging technologies to improve product shelf life and reduce waste.
Growth Accelerators in the Plastic and Metal Packaging Industry
Technological breakthroughs, such as the development of advanced barrier materials and lightweighting solutions, are significantly accelerating market growth. Strategic partnerships between packaging companies and brand owners are facilitating the adoption of innovative and sustainable packaging solutions. Market expansion into new geographic regions and the development of tailored packaging solutions for specific consumer needs will further propel the market forward.
Key Players Shaping the Plastic and Metal Packaging Market
- Amcor
- Ball Corporation
- BASF
- Saint-Gobain
- Crown
- Sonoco Products
- Sealed Air Corporation
- Mondi Group
- Berry Global
- Huhtamaki OYJ
- Greif
- Ardagh
- Silgan
- Huber Packaging
- Kian Joo Group
- JL Clark
- Avon Crowncaps & Containers
- UnitedCan Company
- Macbey
- William Say
- Can Pack Group
- HUBER Packaging
- Toyo Seikan
Notable Milestones in Plastic and Metal Packaging Sector
- 2021: Amcor launches a new range of recyclable and compostable packaging solutions.
- 2022: Ball Corporation invests heavily in aluminum can production capacity.
- 2023: Berry Global acquires a smaller packaging company, expanding its market reach.
- 2024: New regulations on plastic packaging come into effect in several regions.
In-Depth Plastic and Metal Packaging Market Outlook
The future of the plastic and metal packaging market is bright, with continued growth driven by technological innovation, increasing sustainability concerns, and rising demand from diverse end-use sectors. Strategic opportunities abound for companies focused on developing innovative, sustainable, and cost-effective packaging solutions. Market expansion into emerging markets and the adoption of circular economy principles will be crucial for long-term success. The market is poised to reach xx million units by 2033, presenting significant growth potential for key players and new entrants alike.
Plastic and Metal Packaging Segmentation
-
1. Application
- 1.1. Food packaging
- 1.2. Beverage packaging
- 1.3. Personal care packaging
- 1.4. Industrial packaging
-
2. Types
- 2.1. Rigid Packaging
- 2.2. Flexible Packaging
Plastic and Metal Packaging Segmentation By Geography
-
1. North America
- 1.1. United States
- 1.2. Canada
- 1.3. Mexico
-
2. South America
- 2.1. Brazil
- 2.2. Argentina
- 2.3. Rest of South America
-
3. Europe
- 3.1. United Kingdom
- 3.2. Germany
- 3.3. France
- 3.4. Italy
- 3.5. Spain
- 3.6. Russia
- 3.7. Benelux
- 3.8. Nordics
- 3.9. Rest of Europe
-
4. Middle East & Africa
- 4.1. Turkey
- 4.2. Israel
- 4.3. GCC
- 4.4. North Africa
- 4.5. South Africa
- 4.6. Rest of Middle East & Africa
-
5. Asia Pacific
- 5.1. China
- 5.2. India
- 5.3. Japan
- 5.4. South Korea
- 5.5. ASEAN
- 5.6. Oceania
- 5.7. Rest of Asia Pacific

Plastic and Metal Packaging Regional Market Share
Geographic Coverage of Plastic and Metal Packaging
Plastic and Metal Packaging REPORT HIGHLIGHTS
| Aspects | Details |
|---|---|
| Study Period | 2020-2034 |
| Base Year | 2025 |
| Estimated Year | 2026 |
| Forecast Period | 2026-2034 |
| Historical Period | 2020-2025 |
| Growth Rate | CAGR of 3.9% from 2020-2034 |
| Segmentation |
|
Table of Contents
- 1. Introduction
- 1.1. Research Scope
- 1.2. Market Segmentation
- 1.3. Research Methodology
- 1.4. Definitions and Assumptions
- 2. Executive Summary
- 2.1. Introduction
- 3. Market Dynamics
- 3.1. Introduction
- 3.2. Market Drivers
- 3.3. Market Restrains
- 3.4. Market Trends
- 4. Market Factor Analysis
- 4.1. Porters Five Forces
- 4.2. Supply/Value Chain
- 4.3. PESTEL analysis
- 4.4. Market Entropy
- 4.5. Patent/Trademark Analysis
- 5. Global Plastic and Metal Packaging Analysis, Insights and Forecast, 2020-2032
- 5.1. Market Analysis, Insights and Forecast - by Application
- 5.1.1. Food packaging
- 5.1.2. Beverage packaging
- 5.1.3. Personal care packaging
- 5.1.4. Industrial packaging
- 5.2. Market Analysis, Insights and Forecast - by Types
- 5.2.1. Rigid Packaging
- 5.2.2. Flexible Packaging
- 5.3. Market Analysis, Insights and Forecast - by Region
- 5.3.1. North America
- 5.3.2. South America
- 5.3.3. Europe
- 5.3.4. Middle East & Africa
- 5.3.5. Asia Pacific
- 5.1. Market Analysis, Insights and Forecast - by Application
- 6. North America Plastic and Metal Packaging Analysis, Insights and Forecast, 2020-2032
- 6.1. Market Analysis, Insights and Forecast - by Application
- 6.1.1. Food packaging
- 6.1.2. Beverage packaging
- 6.1.3. Personal care packaging
- 6.1.4. Industrial packaging
- 6.2. Market Analysis, Insights and Forecast - by Types
- 6.2.1. Rigid Packaging
- 6.2.2. Flexible Packaging
- 6.1. Market Analysis, Insights and Forecast - by Application
- 7. South America Plastic and Metal Packaging Analysis, Insights and Forecast, 2020-2032
- 7.1. Market Analysis, Insights and Forecast - by Application
- 7.1.1. Food packaging
- 7.1.2. Beverage packaging
- 7.1.3. Personal care packaging
- 7.1.4. Industrial packaging
- 7.2. Market Analysis, Insights and Forecast - by Types
- 7.2.1. Rigid Packaging
- 7.2.2. Flexible Packaging
- 7.1. Market Analysis, Insights and Forecast - by Application
- 8. Europe Plastic and Metal Packaging Analysis, Insights and Forecast, 2020-2032
- 8.1. Market Analysis, Insights and Forecast - by Application
- 8.1.1. Food packaging
- 8.1.2. Beverage packaging
- 8.1.3. Personal care packaging
- 8.1.4. Industrial packaging
- 8.2. Market Analysis, Insights and Forecast - by Types
- 8.2.1. Rigid Packaging
- 8.2.2. Flexible Packaging
- 8.1. Market Analysis, Insights and Forecast - by Application
- 9. Middle East & Africa Plastic and Metal Packaging Analysis, Insights and Forecast, 2020-2032
- 9.1. Market Analysis, Insights and Forecast - by Application
- 9.1.1. Food packaging
- 9.1.2. Beverage packaging
- 9.1.3. Personal care packaging
- 9.1.4. Industrial packaging
- 9.2. Market Analysis, Insights and Forecast - by Types
- 9.2.1. Rigid Packaging
- 9.2.2. Flexible Packaging
- 9.1. Market Analysis, Insights and Forecast - by Application
- 10. Asia Pacific Plastic and Metal Packaging Analysis, Insights and Forecast, 2020-2032
- 10.1. Market Analysis, Insights and Forecast - by Application
- 10.1.1. Food packaging
- 10.1.2. Beverage packaging
- 10.1.3. Personal care packaging
- 10.1.4. Industrial packaging
- 10.2. Market Analysis, Insights and Forecast - by Types
- 10.2.1. Rigid Packaging
- 10.2.2. Flexible Packaging
- 10.1. Market Analysis, Insights and Forecast - by Application
- 11. Competitive Analysis
- 11.1. Global Market Share Analysis 2025
- 11.2. Company Profiles
- 11.2.1 Amcor
- 11.2.1.1. Overview
- 11.2.1.2. Products
- 11.2.1.3. SWOT Analysis
- 11.2.1.4. Recent Developments
- 11.2.1.5. Financials (Based on Availability)
- 11.2.2 Ball Corporation
- 11.2.2.1. Overview
- 11.2.2.2. Products
- 11.2.2.3. SWOT Analysis
- 11.2.2.4. Recent Developments
- 11.2.2.5. Financials (Based on Availability)
- 11.2.3 BASF
- 11.2.3.1. Overview
- 11.2.3.2. Products
- 11.2.3.3. SWOT Analysis
- 11.2.3.4. Recent Developments
- 11.2.3.5. Financials (Based on Availability)
- 11.2.4 Saint-Gobain
- 11.2.4.1. Overview
- 11.2.4.2. Products
- 11.2.4.3. SWOT Analysis
- 11.2.4.4. Recent Developments
- 11.2.4.5. Financials (Based on Availability)
- 11.2.5 Crown
- 11.2.5.1. Overview
- 11.2.5.2. Products
- 11.2.5.3. SWOT Analysis
- 11.2.5.4. Recent Developments
- 11.2.5.5. Financials (Based on Availability)
- 11.2.6 Sonoco Products
- 11.2.6.1. Overview
- 11.2.6.2. Products
- 11.2.6.3. SWOT Analysis
- 11.2.6.4. Recent Developments
- 11.2.6.5. Financials (Based on Availability)
- 11.2.7 Sealed Air Corporation
- 11.2.7.1. Overview
- 11.2.7.2. Products
- 11.2.7.3. SWOT Analysis
- 11.2.7.4. Recent Developments
- 11.2.7.5. Financials (Based on Availability)
- 11.2.8 Mondi Group
- 11.2.8.1. Overview
- 11.2.8.2. Products
- 11.2.8.3. SWOT Analysis
- 11.2.8.4. Recent Developments
- 11.2.8.5. Financials (Based on Availability)
- 11.2.9 Berry Global
- 11.2.9.1. Overview
- 11.2.9.2. Products
- 11.2.9.3. SWOT Analysis
- 11.2.9.4. Recent Developments
- 11.2.9.5. Financials (Based on Availability)
- 11.2.10 Huhtamaki OYJ
- 11.2.10.1. Overview
- 11.2.10.2. Products
- 11.2.10.3. SWOT Analysis
- 11.2.10.4. Recent Developments
- 11.2.10.5. Financials (Based on Availability)
- 11.2.11 Greif
- 11.2.11.1. Overview
- 11.2.11.2. Products
- 11.2.11.3. SWOT Analysis
- 11.2.11.4. Recent Developments
- 11.2.11.5. Financials (Based on Availability)
- 11.2.12 Ardagh
- 11.2.12.1. Overview
- 11.2.12.2. Products
- 11.2.12.3. SWOT Analysis
- 11.2.12.4. Recent Developments
- 11.2.12.5. Financials (Based on Availability)
- 11.2.13 Silgan
- 11.2.13.1. Overview
- 11.2.13.2. Products
- 11.2.13.3. SWOT Analysis
- 11.2.13.4. Recent Developments
- 11.2.13.5. Financials (Based on Availability)
- 11.2.14 Huber Packaging
- 11.2.14.1. Overview
- 11.2.14.2. Products
- 11.2.14.3. SWOT Analysis
- 11.2.14.4. Recent Developments
- 11.2.14.5. Financials (Based on Availability)
- 11.2.15 Kian Joo Group
- 11.2.15.1. Overview
- 11.2.15.2. Products
- 11.2.15.3. SWOT Analysis
- 11.2.15.4. Recent Developments
- 11.2.15.5. Financials (Based on Availability)
- 11.2.16 JL Clark
- 11.2.16.1. Overview
- 11.2.16.2. Products
- 11.2.16.3. SWOT Analysis
- 11.2.16.4. Recent Developments
- 11.2.16.5. Financials (Based on Availability)
- 11.2.17 Avon Crowncaps & Containers
- 11.2.17.1. Overview
- 11.2.17.2. Products
- 11.2.17.3. SWOT Analysis
- 11.2.17.4. Recent Developments
- 11.2.17.5. Financials (Based on Availability)
- 11.2.18 UnitedCan Company
- 11.2.18.1. Overview
- 11.2.18.2. Products
- 11.2.18.3. SWOT Analysis
- 11.2.18.4. Recent Developments
- 11.2.18.5. Financials (Based on Availability)
- 11.2.19 Macbey
- 11.2.19.1. Overview
- 11.2.19.2. Products
- 11.2.19.3. SWOT Analysis
- 11.2.19.4. Recent Developments
- 11.2.19.5. Financials (Based on Availability)
- 11.2.20 William Say
- 11.2.20.1. Overview
- 11.2.20.2. Products
- 11.2.20.3. SWOT Analysis
- 11.2.20.4. Recent Developments
- 11.2.20.5. Financials (Based on Availability)
- 11.2.21 Can Pack Group
- 11.2.21.1. Overview
- 11.2.21.2. Products
- 11.2.21.3. SWOT Analysis
- 11.2.21.4. Recent Developments
- 11.2.21.5. Financials (Based on Availability)
- 11.2.22 HUBER Packaging
- 11.2.22.1. Overview
- 11.2.22.2. Products
- 11.2.22.3. SWOT Analysis
- 11.2.22.4. Recent Developments
- 11.2.22.5. Financials (Based on Availability)
- 11.2.23 Toyo Seikan
- 11.2.23.1. Overview
- 11.2.23.2. Products
- 11.2.23.3. SWOT Analysis
- 11.2.23.4. Recent Developments
- 11.2.23.5. Financials (Based on Availability)
- 11.2.1 Amcor
List of Figures
- Figure 1: Global Plastic and Metal Packaging Revenue Breakdown (billion, %) by Region 2025 & 2033
- Figure 2: North America Plastic and Metal Packaging Revenue (billion), by Application 2025 & 2033
- Figure 3: North America Plastic and Metal Packaging Revenue Share (%), by Application 2025 & 2033
- Figure 4: North America Plastic and Metal Packaging Revenue (billion), by Types 2025 & 2033
- Figure 5: North America Plastic and Metal Packaging Revenue Share (%), by Types 2025 & 2033
- Figure 6: North America Plastic and Metal Packaging Revenue (billion), by Country 2025 & 2033
- Figure 7: North America Plastic and Metal Packaging Revenue Share (%), by Country 2025 & 2033
- Figure 8: South America Plastic and Metal Packaging Revenue (billion), by Application 2025 & 2033
- Figure 9: South America Plastic and Metal Packaging Revenue Share (%), by Application 2025 & 2033
- Figure 10: South America Plastic and Metal Packaging Revenue (billion), by Types 2025 & 2033
- Figure 11: South America Plastic and Metal Packaging Revenue Share (%), by Types 2025 & 2033
- Figure 12: South America Plastic and Metal Packaging Revenue (billion), by Country 2025 & 2033
- Figure 13: South America Plastic and Metal Packaging Revenue Share (%), by Country 2025 & 2033
- Figure 14: Europe Plastic and Metal Packaging Revenue (billion), by Application 2025 & 2033
- Figure 15: Europe Plastic and Metal Packaging Revenue Share (%), by Application 2025 & 2033
- Figure 16: Europe Plastic and Metal Packaging Revenue (billion), by Types 2025 & 2033
- Figure 17: Europe Plastic and Metal Packaging Revenue Share (%), by Types 2025 & 2033
- Figure 18: Europe Plastic and Metal Packaging Revenue (billion), by Country 2025 & 2033
- Figure 19: Europe Plastic and Metal Packaging Revenue Share (%), by Country 2025 & 2033
- Figure 20: Middle East & Africa Plastic and Metal Packaging Revenue (billion), by Application 2025 & 2033
- Figure 21: Middle East & Africa Plastic and Metal Packaging Revenue Share (%), by Application 2025 & 2033
- Figure 22: Middle East & Africa Plastic and Metal Packaging Revenue (billion), by Types 2025 & 2033
- Figure 23: Middle East & Africa Plastic and Metal Packaging Revenue Share (%), by Types 2025 & 2033
- Figure 24: Middle East & Africa Plastic and Metal Packaging Revenue (billion), by Country 2025 & 2033
- Figure 25: Middle East & Africa Plastic and Metal Packaging Revenue Share (%), by Country 2025 & 2033
- Figure 26: Asia Pacific Plastic and Metal Packaging Revenue (billion), by Application 2025 & 2033
- Figure 27: Asia Pacific Plastic and Metal Packaging Revenue Share (%), by Application 2025 & 2033
- Figure 28: Asia Pacific Plastic and Metal Packaging Revenue (billion), by Types 2025 & 2033
- Figure 29: Asia Pacific Plastic and Metal Packaging Revenue Share (%), by Types 2025 & 2033
- Figure 30: Asia Pacific Plastic and Metal Packaging Revenue (billion), by Country 2025 & 2033
- Figure 31: Asia Pacific Plastic and Metal Packaging Revenue Share (%), by Country 2025 & 2033
List of Tables
- Table 1: Global Plastic and Metal Packaging Revenue billion Forecast, by Application 2020 & 2033
- Table 2: Global Plastic and Metal Packaging Revenue billion Forecast, by Types 2020 & 2033
- Table 3: Global Plastic and Metal Packaging Revenue billion Forecast, by Region 2020 & 2033
- Table 4: Global Plastic and Metal Packaging Revenue billion Forecast, by Application 2020 & 2033
- Table 5: Global Plastic and Metal Packaging Revenue billion Forecast, by Types 2020 & 2033
- Table 6: Global Plastic and Metal Packaging Revenue billion Forecast, by Country 2020 & 2033
- Table 7: United States Plastic and Metal Packaging Revenue (billion) Forecast, by Application 2020 & 2033
- Table 8: Canada Plastic and Metal Packaging Revenue (billion) Forecast, by Application 2020 & 2033
- Table 9: Mexico Plastic and Metal Packaging Revenue (billion) Forecast, by Application 2020 & 2033
- Table 10: Global Plastic and Metal Packaging Revenue billion Forecast, by Application 2020 & 2033
- Table 11: Global Plastic and Metal Packaging Revenue billion Forecast, by Types 2020 & 2033
- Table 12: Global Plastic and Metal Packaging Revenue billion Forecast, by Country 2020 & 2033
- Table 13: Brazil Plastic and Metal Packaging Revenue (billion) Forecast, by Application 2020 & 2033
- Table 14: Argentina Plastic and Metal Packaging Revenue (billion) Forecast, by Application 2020 & 2033
- Table 15: Rest of South America Plastic and Metal Packaging Revenue (billion) Forecast, by Application 2020 & 2033
- Table 16: Global Plastic and Metal Packaging Revenue billion Forecast, by Application 2020 & 2033
- Table 17: Global Plastic and Metal Packaging Revenue billion Forecast, by Types 2020 & 2033
- Table 18: Global Plastic and Metal Packaging Revenue billion Forecast, by Country 2020 & 2033
- Table 19: United Kingdom Plastic and Metal Packaging Revenue (billion) Forecast, by Application 2020 & 2033
- Table 20: Germany Plastic and Metal Packaging Revenue (billion) Forecast, by Application 2020 & 2033
- Table 21: France Plastic and Metal Packaging Revenue (billion) Forecast, by Application 2020 & 2033
- Table 22: Italy Plastic and Metal Packaging Revenue (billion) Forecast, by Application 2020 & 2033
- Table 23: Spain Plastic and Metal Packaging Revenue (billion) Forecast, by Application 2020 & 2033
- Table 24: Russia Plastic and Metal Packaging Revenue (billion) Forecast, by Application 2020 & 2033
- Table 25: Benelux Plastic and Metal Packaging Revenue (billion) Forecast, by Application 2020 & 2033
- Table 26: Nordics Plastic and Metal Packaging Revenue (billion) Forecast, by Application 2020 & 2033
- Table 27: Rest of Europe Plastic and Metal Packaging Revenue (billion) Forecast, by Application 2020 & 2033
- Table 28: Global Plastic and Metal Packaging Revenue billion Forecast, by Application 2020 & 2033
- Table 29: Global Plastic and Metal Packaging Revenue billion Forecast, by Types 2020 & 2033
- Table 30: Global Plastic and Metal Packaging Revenue billion Forecast, by Country 2020 & 2033
- Table 31: Turkey Plastic and Metal Packaging Revenue (billion) Forecast, by Application 2020 & 2033
- Table 32: Israel Plastic and Metal Packaging Revenue (billion) Forecast, by Application 2020 & 2033
- Table 33: GCC Plastic and Metal Packaging Revenue (billion) Forecast, by Application 2020 & 2033
- Table 34: North Africa Plastic and Metal Packaging Revenue (billion) Forecast, by Application 2020 & 2033
- Table 35: South Africa Plastic and Metal Packaging Revenue (billion) Forecast, by Application 2020 & 2033
- Table 36: Rest of Middle East & Africa Plastic and Metal Packaging Revenue (billion) Forecast, by Application 2020 & 2033
- Table 37: Global Plastic and Metal Packaging Revenue billion Forecast, by Application 2020 & 2033
- Table 38: Global Plastic and Metal Packaging Revenue billion Forecast, by Types 2020 & 2033
- Table 39: Global Plastic and Metal Packaging Revenue billion Forecast, by Country 2020 & 2033
- Table 40: China Plastic and Metal Packaging Revenue (billion) Forecast, by Application 2020 & 2033
- Table 41: India Plastic and Metal Packaging Revenue (billion) Forecast, by Application 2020 & 2033
- Table 42: Japan Plastic and Metal Packaging Revenue (billion) Forecast, by Application 2020 & 2033
- Table 43: South Korea Plastic and Metal Packaging Revenue (billion) Forecast, by Application 2020 & 2033
- Table 44: ASEAN Plastic and Metal Packaging Revenue (billion) Forecast, by Application 2020 & 2033
- Table 45: Oceania Plastic and Metal Packaging Revenue (billion) Forecast, by Application 2020 & 2033
- Table 46: Rest of Asia Pacific Plastic and Metal Packaging Revenue (billion) Forecast, by Application 2020 & 2033
Frequently Asked Questions
1. What is the projected Compound Annual Growth Rate (CAGR) of the Plastic and Metal Packaging?
The projected CAGR is approximately 3.9%.
2. Which companies are prominent players in the Plastic and Metal Packaging?
Key companies in the market include Amcor, Ball Corporation, BASF, Saint-Gobain, Crown, Sonoco Products, Sealed Air Corporation, Mondi Group, Berry Global, Huhtamaki OYJ, Greif, Ardagh, Silgan, Huber Packaging, Kian Joo Group, JL Clark, Avon Crowncaps & Containers, UnitedCan Company, Macbey, William Say, Can Pack Group, HUBER Packaging, Toyo Seikan.
3. What are the main segments of the Plastic and Metal Packaging?
The market segments include Application, Types.
4. Can you provide details about the market size?
The market size is estimated to be USD 141.7 billion as of 2022.
5. What are some drivers contributing to market growth?
N/A
6. What are the notable trends driving market growth?
N/A
7. Are there any restraints impacting market growth?
N/A
8. Can you provide examples of recent developments in the market?
N/A
9. What pricing options are available for accessing the report?
Pricing options include single-user, multi-user, and enterprise licenses priced at USD 2900.00, USD 4350.00, and USD 5800.00 respectively.
10. Is the market size provided in terms of value or volume?
The market size is provided in terms of value, measured in billion.
11. Are there any specific market keywords associated with the report?
Yes, the market keyword associated with the report is "Plastic and Metal Packaging," which aids in identifying and referencing the specific market segment covered.
12. How do I determine which pricing option suits my needs best?
The pricing options vary based on user requirements and access needs. Individual users may opt for single-user licenses, while businesses requiring broader access may choose multi-user or enterprise licenses for cost-effective access to the report.
13. Are there any additional resources or data provided in the Plastic and Metal Packaging report?
While the report offers comprehensive insights, it's advisable to review the specific contents or supplementary materials provided to ascertain if additional resources or data are available.
14. How can I stay updated on further developments or reports in the Plastic and Metal Packaging?
To stay informed about further developments, trends, and reports in the Plastic and Metal Packaging, consider subscribing to industry newsletters, following relevant companies and organizations, or regularly checking reputable industry news sources and publications.
Methodology
Step 1 - Identification of Relevant Samples Size from Population Database


Step 2 - Approaches for Defining Global Market Size (Value, Volume* & Price*)

Note*: In applicable scenarios
Step 3 - Data Sources
Primary Research
- Web Analytics
- Survey Reports
- Research Institute
- Latest Research Reports
- Opinion Leaders
Secondary Research
- Annual Reports
- White Paper
- Latest Press Release
- Industry Association
- Paid Database
- Investor Presentations

Step 4 - Data Triangulation
Involves using different sources of information in order to increase the validity of a study
These sources are likely to be stakeholders in a program - participants, other researchers, program staff, other community members, and so on.
Then we put all data in single framework & apply various statistical tools to find out the dynamic on the market.
During the analysis stage, feedback from the stakeholder groups would be compared to determine areas of agreement as well as areas of divergence