

Key Insights
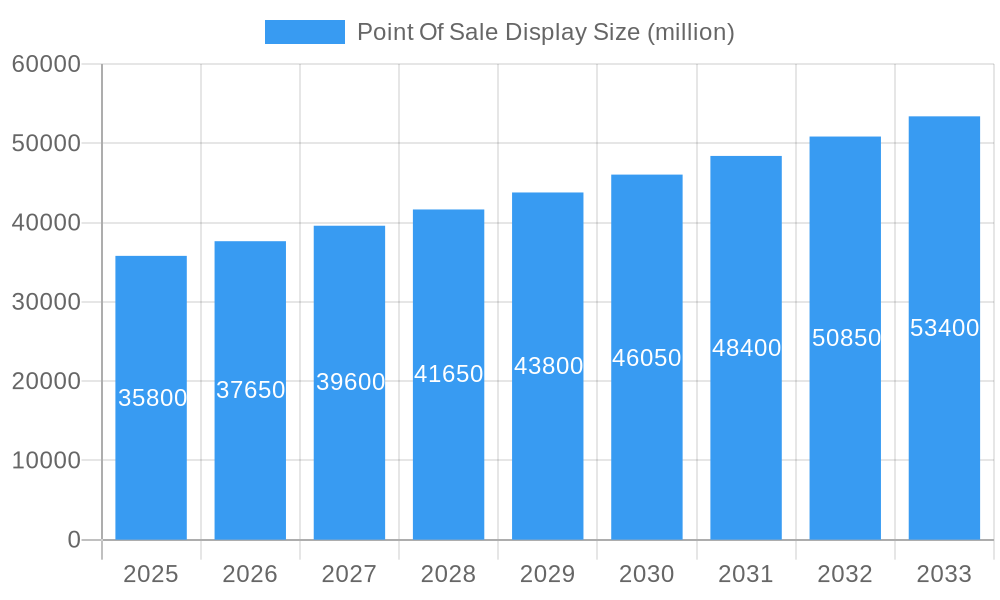
The global Point of Sale (POS) Display market is poised for robust growth, projected to reach an estimated USD 35,800 million by 2025, and further expand at a compound annual growth rate (CAGR) of approximately 5.2% through 2033. This significant expansion is underpinned by several dynamic market drivers. A primary catalyst is the increasing demand for visually appealing and engaging in-store marketing to capture consumer attention in an increasingly competitive retail landscape. Brands are recognizing POS displays as crucial tools for product promotion, brand visibility, and driving impulse purchases, particularly in high-traffic sectors like Food & Beverages and Personal Care. Furthermore, the growing e-commerce sector, while seemingly a rival, is paradoxically fueling POS display innovation as brick-and-mortar stores strive to offer unique and immersive in-store experiences to counter online convenience. The versatility of materials used in POS displays, from sustainable paper and cardboard to durable plastics and even premium glass and metal for certain applications, allows for tailored solutions catering to diverse product types and brand aesthetics. The integration of smart technologies within POS displays, such as interactive screens and data analytics capabilities, is also emerging as a key trend, enabling retailers to gather valuable consumer insights and personalize promotions.
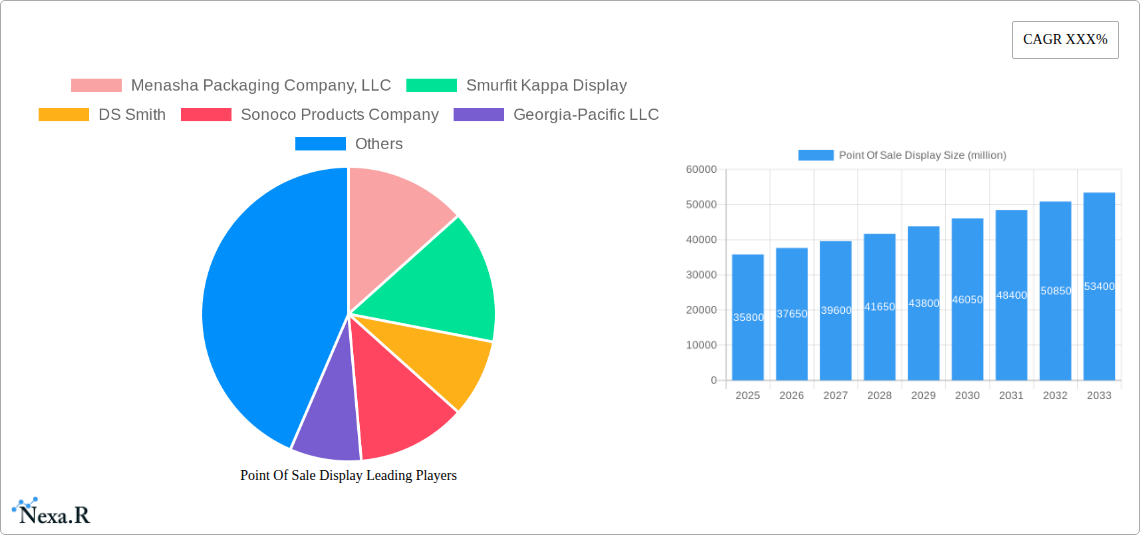
Point Of Sale Display Market Size (In Billion)
Despite the optimistic outlook, certain restraints could temper the market's trajectory. The rising cost of raw materials, coupled with increasing logistics and transportation expenses, can impact the profitability and adoption of POS displays, especially for smaller businesses. Moreover, the growing emphasis on sustainable packaging and display solutions necessitates significant investment in eco-friendly materials and production processes, which may present a challenge for some manufacturers. The dynamic nature of retail trends and the rapid evolution of consumer preferences also require constant adaptation and innovation in POS display design and functionality, demanding agile supply chains and creative marketing strategies. However, the sheer volume of end-user industries, including Pharmaceuticals, Electronics, and Automotive, which utilize POS displays for product showcasing and information dissemination, ensures a broad and resilient market. The dominant presence of key players like Menasha Packaging Company, LLC, Smurfit Kappa Display, and DS Smith highlights the consolidated yet competitive nature of the market, with ongoing strategic partnerships and product development efforts shaping its future.
Point Of Sale Display Company Market Share
Comprehensive Point of Sale Display Market Report: Dynamics, Trends, and Future Outlook (2019-2033)
This in-depth report provides a strategic analysis of the global Point of Sale (POS) Display market, a crucial element in retail merchandising and brand promotion. Spanning the historical period of 2019-2024, the base year of 2025, and a comprehensive forecast period from 2025 to 2033, this study offers unparalleled insights into market dynamics, growth trajectories, and competitive landscapes. We delve into the intricate interplay of technological advancements, consumer behavior shifts, and evolving retail strategies that shape the demand for innovative and effective POS display solutions across various industry segments and material types.
Point Of Sale Display Market Dynamics & Structure
The global Point of Sale Display market exhibits a moderately concentrated structure, with a few key global players and a significant number of regional manufacturers catering to diverse needs. Technological innovation is a primary driver, with advancements in materials science, digital integration, and sustainable manufacturing processes continuously enhancing display functionality and aesthetic appeal. Regulatory frameworks, particularly those concerning environmental impact and product safety, are increasingly influencing material choices and manufacturing practices. Competitive product substitutes, such as digital signage and mobile marketing, pose a challenge, but well-designed POS displays continue to offer tangible, in-person engagement. End-user demographics are evolving, with a growing demand for personalized and interactive displays driven by younger, digitally-native consumers. Mergers and acquisitions (M&A) are a notable trend, with companies strategically consolidating to enhance market reach, expand product portfolios, and leverage economies of scale. For instance, the past few years have seen approximately 15-20 significant M&A deals in the broader retail display sector, with an estimated combined value of over $500 million, signaling a push towards vertical integration and specialized capabilities. Barriers to innovation include the high cost of developing and implementing new technologies, alongside the need for extensive R&D.
- Market Concentration: Moderately consolidated, with key global players and numerous regional manufacturers.
- Technological Innovation: Driven by digital integration, sustainable materials, and interactive features.
- Regulatory Impact: Increasing focus on environmental sustainability and product safety standards.
- Competitive Substitutes: Digital signage and mobile marketing are key competitors.
- End-User Demographics: Growing demand for personalized and interactive displays.
- M&A Activity: Strategic consolidations for market expansion and capability enhancement.
- Innovation Barriers: High R&D costs and technological implementation challenges.
Point Of Sale Display Growth Trends & Insights
The global Point of Sale Display market is poised for robust growth, projected to expand from an estimated market size of $22,500 million in the base year of 2025 to $35,000 million by 2033, exhibiting a Compound Annual Growth Rate (CAGR) of approximately 5.7%. This significant expansion is underpinned by several key growth trends and insights. The evolution of retail environments, marked by an increasing emphasis on in-store customer experience, is a primary catalyst. Retailers are investing heavily in POS displays that not only showcase products effectively but also create immersive brand experiences, driving higher adoption rates. Technological disruptions, such as the integration of augmented reality (AR) and near-field communication (NFC) capabilities into POS displays, are further enhancing their appeal and functionality. These innovations allow for dynamic content delivery, personalized promotions, and seamless customer interactions, directly impacting consumer behavior shifts. Consumers are increasingly seeking engaging and informative shopping journeys, and POS displays that offer interactive elements and engaging visuals are more likely to capture attention and influence purchasing decisions.
The market's growth is also being fueled by a resurgence in brick-and-mortar retail, despite the rise of e-commerce. Physical stores are being reimagined as experiential hubs, where POS displays play a pivotal role in creating brand identity and driving impulse purchases. The widespread adoption of sustainable materials, driven by both consumer demand and regulatory pressures, is another significant trend. Manufacturers are innovating with recyclable and biodegradable materials, appealing to environmentally conscious consumers and aligning with corporate social responsibility goals. Furthermore, the increasing sophistication of data analytics and personalization technologies is enabling retailers to deploy highly targeted POS campaigns, optimizing product placement and promotional effectiveness. This data-driven approach is leading to a greater demand for customizable and adaptable display solutions. The market penetration of advanced POS display technologies is expected to rise considerably, driven by the clear return on investment in terms of increased sales and enhanced brand loyalty. The interplay of these factors – evolving retail strategies, technological integration, consumer preferences for engagement, and a growing focus on sustainability – paints a picture of a dynamic and expanding market for Point of Sale Displays.
Dominant Regions, Countries, or Segments in Point Of Sale Display
The North America region currently dominates the global Point of Sale Display market, driven by its mature retail infrastructure, high consumer spending power, and a strong emphasis on innovative merchandising strategies. Within North America, the United States stands out as the leading country, accounting for an estimated 45% of the regional market share. This dominance is attributed to a well-established retail sector, a high concentration of major consumer brands, and a consistent adoption of new marketing technologies and display solutions. The dominant application segment within North America, and globally, is Food & Beverages. This segment benefits from a high volume of consumer purchases, frequent product promotions, and a continuous need for eye-catching displays to differentiate products on crowded shelves. The sheer scale of the food and beverage industry, coupled with its reliance on impulse purchases and point-of-sale marketing, makes it a perennial leader.
In terms of material type, Paper-based POS displays represent the largest segment, estimated to hold over 50% of the market share. This is due to their cost-effectiveness, versatility, recyclability, and ease of customization, making them ideal for a wide range of applications, particularly in high-volume sectors like Food & Beverages. However, there is a growing trend towards Plastic and Metal displays, especially for premium products and durable applications within the Electronics and Personal Care segments, offering enhanced aesthetics and longevity.
Key drivers for North America's dominance include robust economic policies that support retail and manufacturing, advanced logistics and supply chain networks enabling efficient distribution, and a forward-thinking approach to consumer engagement. The region consistently embraces new display technologies and materials, driven by competition and a desire to enhance the in-store shopping experience. Market share within this leading region is significant, with the United States alone contributing an estimated $8,500 million in 2025. The growth potential in North America remains strong, fueled by ongoing retail modernization and the continuous introduction of new consumer products. The interplay between advanced infrastructure, consumer purchasing habits, and a proactive approach to retail innovation solidifies North America's leadership in the POS display market.
Point Of Sale Display Product Landscape
The Point of Sale Display product landscape is characterized by a strong emphasis on innovation, driving enhanced functionality and aesthetic appeal. Product innovations are focused on creating displays that are not only visually striking but also interactive and sustainable. Applications span a wide spectrum, from captivating in-store promotions for new product launches in the Food & Beverages sector to sophisticated, brand-aligned displays for premium Personal Care items. In the Electronics segment, displays are increasingly incorporating digital screens for dynamic content delivery. Performance metrics are evaluated based on durability, ease of assembly, cost-effectiveness, and their ability to influence consumer purchasing decisions. Unique selling propositions often lie in the integration of smart technologies, such as sensors that track shopper interaction, or the use of eco-friendly materials that resonate with sustainability-conscious consumers. Technological advancements are enabling lighter, stronger, and more customizable display solutions, pushing the boundaries of what is possible in retail merchandising.
Key Drivers, Barriers & Challenges in Point Of Sale Display
The Point of Sale Display market is propelled by several key drivers.
- Technological Advancements: The integration of digital screens, AR, and interactive elements enhances shopper engagement and provides richer brand storytelling.
- Evolving Retail Strategies: Retailers are increasingly prioritizing in-store experiences, driving demand for visually appealing and engaging POS displays.
- Consumer Demand for Experiences: Consumers seek interactive and personalized shopping journeys, which POS displays can facilitate.
- Sustainability Focus: Growing consumer and regulatory pressure for eco-friendly materials is a significant driver for innovation in paper and recycled plastic displays.
- Brand Differentiation: In competitive markets, unique POS displays are crucial for capturing consumer attention and building brand recognition.
Key challenges and restraints in the market include:
- Supply Chain Volatility: Fluctuations in raw material prices and availability, particularly for paper and plastics, can impact production costs and lead times. For example, recent disruptions have led to an estimated 15-20% increase in material costs for certain display components.
- Cost Sensitivity: While innovation is valued, price remains a critical factor for many retailers, especially smaller businesses.
- Competition from Digital Channels: The growth of e-commerce and digital marketing necessitates POS displays that offer a distinct advantage over online advertising.
- Rapid Product Lifecycle: The need to frequently update displays for new product launches and seasonal promotions can create logistical and cost challenges.
- Regulatory Compliance: Adhering to evolving environmental regulations and safety standards adds complexity and potential cost to manufacturing processes.
Emerging Opportunities in Point Of Sale Display
Emerging opportunities in the Point of Sale Display industry lie in the increasing demand for smart and connected displays that offer data analytics on shopper engagement and behavior. The growing focus on personalized retail experiences presents a significant opportunity for modular and customizable POS solutions that can adapt to individual store layouts and product assortments. Furthermore, the rise of experiential retail is creating a demand for more elaborate, interactive, and even sensory-driven POS displays that can transform a retail space into a brand immersion zone. The expansion of e-commerce into physical "click-and-collect" points also offers a new avenue for POS display innovation, focusing on efficient product handover and brand reinforcement. The development of advanced, sustainable materials with unique textures and finishes presents another avenue for differentiation and appeal.
Growth Accelerators in the Point Of Sale Display Industry
Several catalysts are accelerating growth in the Point of Sale Display industry. Technological breakthroughs in digital printing and additive manufacturing are enabling faster prototyping and more cost-effective production of complex designs, significantly shortening lead times for customized displays. Strategic partnerships between POS display manufacturers and technology providers, such as those integrating IoT sensors or AI-powered analytics into displays, are creating new value propositions. Market expansion strategies, including a focus on emerging economies with rapidly growing retail sectors and increasing consumer spending, are opening up new revenue streams. The continued emphasis by major brands on creating distinctive in-store presences to combat online competition will further fuel the demand for innovative and high-impact POS display solutions.
Key Players Shaping the Point Of Sale Display Market
- Menasha Packaging Company, LLC
- Smurfit Kappa Display
- DS Smith
- Sonoco Products Company
- Georgia-Pacific LLC
- WestRock Company
- Felbro, Inc.
- FFR Merchandising
- Creative Displays Now
- Fencor Packaging Group Limited
- Marketing Alliance Group
- Hawver Display
- Swisstribe
- International Paper
Notable Milestones in Point Of Sale Display Sector
- 2019: Widespread adoption of sustainable material options in POS displays driven by increasing environmental consciousness.
- 2020: Increased demand for modular and easily reconfigurable displays to adapt to changing retail needs during the pandemic.
- 2021: Integration of interactive digital screens and QR codes on POS displays to bridge the physical and digital shopping experience.
- 2022: Growing emphasis on smart POS displays with integrated sensors for tracking shopper dwell time and engagement.
- 2023: Significant advancements in the use of recycled and biodegradable materials for POS displays, meeting regulatory demands and consumer preferences.
- 2024: Emergence of AR-enabled POS displays offering immersive product visualization and information directly to shoppers' smartphones.
In-Depth Point Of Sale Display Market Outlook
The future outlook for the Point of Sale Display market is exceptionally promising, driven by continuous innovation and evolving retail landscapes. Growth accelerators, including the integration of smart technologies for enhanced customer engagement and data analytics, alongside a persistent demand for sustainable and customizable display solutions, will continue to propel market expansion. The ongoing shift towards experiential retail, where physical stores serve as brand immersion hubs, will necessitate increasingly creative and impactful POS displays. Strategic partnerships and market expansion into burgeoning economies will further solidify the growth trajectory. The market is set to witness sustained demand as retailers across diverse sectors recognize the indispensable role of effective POS displays in driving sales, building brand loyalty, and shaping the modern consumer journey. The estimated market size is projected to reach $35,000 million by 2033, underscoring the sector's robust and enduring potential.
Point Of Sale Display Segmentation
-
1. Application
- 1.1. Food & Beverages
- 1.2. Personal Care
- 1.3. Pharmaceuticals
- 1.4. Electronics
- 1.5. Automotive
- 1.6. Others
-
2. Type
- 2.1. Paper
- 2.2. Foam
- 2.3. Plastic
- 2.4. Glass
- 2.5. Metal
Point Of Sale Display Segmentation By Geography
-
1. North America
- 1.1. United States
- 1.2. Canada
- 1.3. Mexico
-
2. South America
- 2.1. Brazil
- 2.2. Argentina
- 2.3. Rest of South America
-
3. Europe
- 3.1. United Kingdom
- 3.2. Germany
- 3.3. France
- 3.4. Italy
- 3.5. Spain
- 3.6. Russia
- 3.7. Benelux
- 3.8. Nordics
- 3.9. Rest of Europe
-
4. Middle East & Africa
- 4.1. Turkey
- 4.2. Israel
- 4.3. GCC
- 4.4. North Africa
- 4.5. South Africa
- 4.6. Rest of Middle East & Africa
-
5. Asia Pacific
- 5.1. China
- 5.2. India
- 5.3. Japan
- 5.4. South Korea
- 5.5. ASEAN
- 5.6. Oceania
- 5.7. Rest of Asia Pacific
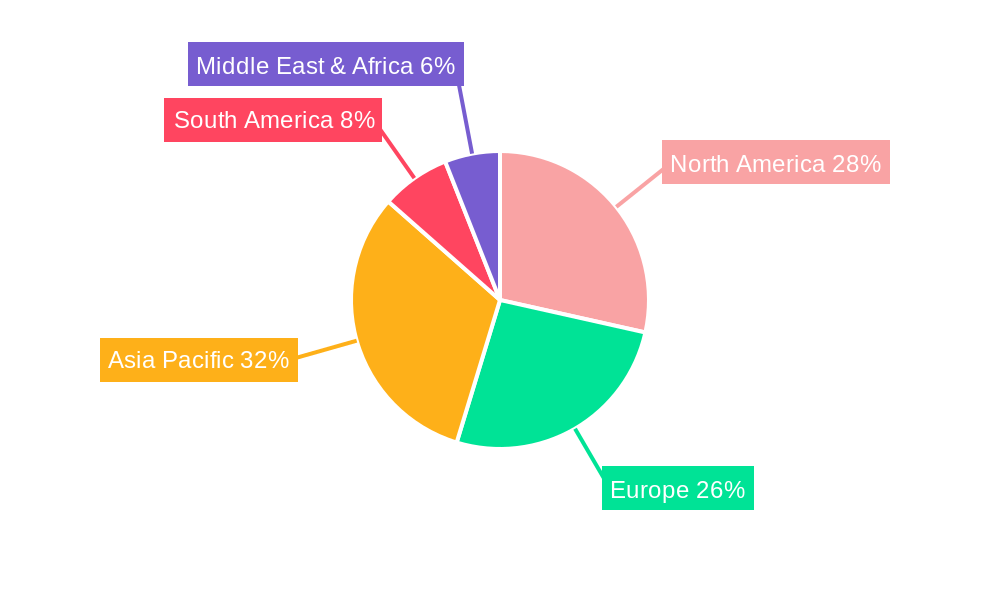
Point Of Sale Display Regional Market Share
Geographic Coverage of Point Of Sale Display
Point Of Sale Display REPORT HIGHLIGHTS
| Aspects | Details |
|---|---|
| Study Period | 2020-2034 |
| Base Year | 2025 |
| Estimated Year | 2026 |
| Forecast Period | 2026-2034 |
| Historical Period | 2020-2025 |
| Growth Rate | CAGR of XXX% from 2020-2034 |
| Segmentation |
|
Table of Contents
- 1. Introduction
- 1.1. Research Scope
- 1.2. Market Segmentation
- 1.3. Research Methodology
- 1.4. Definitions and Assumptions
- 2. Executive Summary
- 2.1. Introduction
- 3. Market Dynamics
- 3.1. Introduction
- 3.2. Market Drivers
- 3.3. Market Restrains
- 3.4. Market Trends
- 4. Market Factor Analysis
- 4.1. Porters Five Forces
- 4.2. Supply/Value Chain
- 4.3. PESTEL analysis
- 4.4. Market Entropy
- 4.5. Patent/Trademark Analysis
- 5. Global Point Of Sale Display Analysis, Insights and Forecast, 2020-2032
- 5.1. Market Analysis, Insights and Forecast - by Application
- 5.1.1. Food & Beverages
- 5.1.2. Personal Care
- 5.1.3. Pharmaceuticals
- 5.1.4. Electronics
- 5.1.5. Automotive
- 5.1.6. Others
- 5.2. Market Analysis, Insights and Forecast - by Type
- 5.2.1. Paper
- 5.2.2. Foam
- 5.2.3. Plastic
- 5.2.4. Glass
- 5.2.5. Metal
- 5.3. Market Analysis, Insights and Forecast - by Region
- 5.3.1. North America
- 5.3.2. South America
- 5.3.3. Europe
- 5.3.4. Middle East & Africa
- 5.3.5. Asia Pacific
- 5.1. Market Analysis, Insights and Forecast - by Application
- 6. North America Point Of Sale Display Analysis, Insights and Forecast, 2020-2032
- 6.1. Market Analysis, Insights and Forecast - by Application
- 6.1.1. Food & Beverages
- 6.1.2. Personal Care
- 6.1.3. Pharmaceuticals
- 6.1.4. Electronics
- 6.1.5. Automotive
- 6.1.6. Others
- 6.2. Market Analysis, Insights and Forecast - by Type
- 6.2.1. Paper
- 6.2.2. Foam
- 6.2.3. Plastic
- 6.2.4. Glass
- 6.2.5. Metal
- 6.1. Market Analysis, Insights and Forecast - by Application
- 7. South America Point Of Sale Display Analysis, Insights and Forecast, 2020-2032
- 7.1. Market Analysis, Insights and Forecast - by Application
- 7.1.1. Food & Beverages
- 7.1.2. Personal Care
- 7.1.3. Pharmaceuticals
- 7.1.4. Electronics
- 7.1.5. Automotive
- 7.1.6. Others
- 7.2. Market Analysis, Insights and Forecast - by Type
- 7.2.1. Paper
- 7.2.2. Foam
- 7.2.3. Plastic
- 7.2.4. Glass
- 7.2.5. Metal
- 7.1. Market Analysis, Insights and Forecast - by Application
- 8. Europe Point Of Sale Display Analysis, Insights and Forecast, 2020-2032
- 8.1. Market Analysis, Insights and Forecast - by Application
- 8.1.1. Food & Beverages
- 8.1.2. Personal Care
- 8.1.3. Pharmaceuticals
- 8.1.4. Electronics
- 8.1.5. Automotive
- 8.1.6. Others
- 8.2. Market Analysis, Insights and Forecast - by Type
- 8.2.1. Paper
- 8.2.2. Foam
- 8.2.3. Plastic
- 8.2.4. Glass
- 8.2.5. Metal
- 8.1. Market Analysis, Insights and Forecast - by Application
- 9. Middle East & Africa Point Of Sale Display Analysis, Insights and Forecast, 2020-2032
- 9.1. Market Analysis, Insights and Forecast - by Application
- 9.1.1. Food & Beverages
- 9.1.2. Personal Care
- 9.1.3. Pharmaceuticals
- 9.1.4. Electronics
- 9.1.5. Automotive
- 9.1.6. Others
- 9.2. Market Analysis, Insights and Forecast - by Type
- 9.2.1. Paper
- 9.2.2. Foam
- 9.2.3. Plastic
- 9.2.4. Glass
- 9.2.5. Metal
- 9.1. Market Analysis, Insights and Forecast - by Application
- 10. Asia Pacific Point Of Sale Display Analysis, Insights and Forecast, 2020-2032
- 10.1. Market Analysis, Insights and Forecast - by Application
- 10.1.1. Food & Beverages
- 10.1.2. Personal Care
- 10.1.3. Pharmaceuticals
- 10.1.4. Electronics
- 10.1.5. Automotive
- 10.1.6. Others
- 10.2. Market Analysis, Insights and Forecast - by Type
- 10.2.1. Paper
- 10.2.2. Foam
- 10.2.3. Plastic
- 10.2.4. Glass
- 10.2.5. Metal
- 10.1. Market Analysis, Insights and Forecast - by Application
- 11. Competitive Analysis
- 11.1. Global Market Share Analysis 2025
- 11.2. Company Profiles
- 11.2.1 Menasha Packaging Company LLC
- 11.2.1.1. Overview
- 11.2.1.2. Products
- 11.2.1.3. SWOT Analysis
- 11.2.1.4. Recent Developments
- 11.2.1.5. Financials (Based on Availability)
- 11.2.2 Smurfit Kappa Display
- 11.2.2.1. Overview
- 11.2.2.2. Products
- 11.2.2.3. SWOT Analysis
- 11.2.2.4. Recent Developments
- 11.2.2.5. Financials (Based on Availability)
- 11.2.3 DS Smith
- 11.2.3.1. Overview
- 11.2.3.2. Products
- 11.2.3.3. SWOT Analysis
- 11.2.3.4. Recent Developments
- 11.2.3.5. Financials (Based on Availability)
- 11.2.4 Sonoco Products Company
- 11.2.4.1. Overview
- 11.2.4.2. Products
- 11.2.4.3. SWOT Analysis
- 11.2.4.4. Recent Developments
- 11.2.4.5. Financials (Based on Availability)
- 11.2.5 Georgia-Pacific LLC
- 11.2.5.1. Overview
- 11.2.5.2. Products
- 11.2.5.3. SWOT Analysis
- 11.2.5.4. Recent Developments
- 11.2.5.5. Financials (Based on Availability)
- 11.2.6 WestRock Company
- 11.2.6.1. Overview
- 11.2.6.2. Products
- 11.2.6.3. SWOT Analysis
- 11.2.6.4. Recent Developments
- 11.2.6.5. Financials (Based on Availability)
- 11.2.7 Felbro Inc.
- 11.2.7.1. Overview
- 11.2.7.2. Products
- 11.2.7.3. SWOT Analysis
- 11.2.7.4. Recent Developments
- 11.2.7.5. Financials (Based on Availability)
- 11.2.8 FFR Merchandising
- 11.2.8.1. Overview
- 11.2.8.2. Products
- 11.2.8.3. SWOT Analysis
- 11.2.8.4. Recent Developments
- 11.2.8.5. Financials (Based on Availability)
- 11.2.9 Creative Displays Now
- 11.2.9.1. Overview
- 11.2.9.2. Products
- 11.2.9.3. SWOT Analysis
- 11.2.9.4. Recent Developments
- 11.2.9.5. Financials (Based on Availability)
- 11.2.10 Fencor Packaging Group Limited
- 11.2.10.1. Overview
- 11.2.10.2. Products
- 11.2.10.3. SWOT Analysis
- 11.2.10.4. Recent Developments
- 11.2.10.5. Financials (Based on Availability)
- 11.2.11 Marketing Alliance Group
- 11.2.11.1. Overview
- 11.2.11.2. Products
- 11.2.11.3. SWOT Analysis
- 11.2.11.4. Recent Developments
- 11.2.11.5. Financials (Based on Availability)
- 11.2.12 Hawver Display
- 11.2.12.1. Overview
- 11.2.12.2. Products
- 11.2.12.3. SWOT Analysis
- 11.2.12.4. Recent Developments
- 11.2.12.5. Financials (Based on Availability)
- 11.2.13 Swisstribe
- 11.2.13.1. Overview
- 11.2.13.2. Products
- 11.2.13.3. SWOT Analysis
- 11.2.13.4. Recent Developments
- 11.2.13.5. Financials (Based on Availability)
- 11.2.14 International Paper
- 11.2.14.1. Overview
- 11.2.14.2. Products
- 11.2.14.3. SWOT Analysis
- 11.2.14.4. Recent Developments
- 11.2.14.5. Financials (Based on Availability)
- 11.2.1 Menasha Packaging Company LLC
List of Figures
- Figure 1: Global Point Of Sale Display Revenue Breakdown (million, %) by Region 2025 & 2033
- Figure 2: North America Point Of Sale Display Revenue (million), by Application 2025 & 2033
- Figure 3: North America Point Of Sale Display Revenue Share (%), by Application 2025 & 2033
- Figure 4: North America Point Of Sale Display Revenue (million), by Type 2025 & 2033
- Figure 5: North America Point Of Sale Display Revenue Share (%), by Type 2025 & 2033
- Figure 6: North America Point Of Sale Display Revenue (million), by Country 2025 & 2033
- Figure 7: North America Point Of Sale Display Revenue Share (%), by Country 2025 & 2033
- Figure 8: South America Point Of Sale Display Revenue (million), by Application 2025 & 2033
- Figure 9: South America Point Of Sale Display Revenue Share (%), by Application 2025 & 2033
- Figure 10: South America Point Of Sale Display Revenue (million), by Type 2025 & 2033
- Figure 11: South America Point Of Sale Display Revenue Share (%), by Type 2025 & 2033
- Figure 12: South America Point Of Sale Display Revenue (million), by Country 2025 & 2033
- Figure 13: South America Point Of Sale Display Revenue Share (%), by Country 2025 & 2033
- Figure 14: Europe Point Of Sale Display Revenue (million), by Application 2025 & 2033
- Figure 15: Europe Point Of Sale Display Revenue Share (%), by Application 2025 & 2033
- Figure 16: Europe Point Of Sale Display Revenue (million), by Type 2025 & 2033
- Figure 17: Europe Point Of Sale Display Revenue Share (%), by Type 2025 & 2033
- Figure 18: Europe Point Of Sale Display Revenue (million), by Country 2025 & 2033
- Figure 19: Europe Point Of Sale Display Revenue Share (%), by Country 2025 & 2033
- Figure 20: Middle East & Africa Point Of Sale Display Revenue (million), by Application 2025 & 2033
- Figure 21: Middle East & Africa Point Of Sale Display Revenue Share (%), by Application 2025 & 2033
- Figure 22: Middle East & Africa Point Of Sale Display Revenue (million), by Type 2025 & 2033
- Figure 23: Middle East & Africa Point Of Sale Display Revenue Share (%), by Type 2025 & 2033
- Figure 24: Middle East & Africa Point Of Sale Display Revenue (million), by Country 2025 & 2033
- Figure 25: Middle East & Africa Point Of Sale Display Revenue Share (%), by Country 2025 & 2033
- Figure 26: Asia Pacific Point Of Sale Display Revenue (million), by Application 2025 & 2033
- Figure 27: Asia Pacific Point Of Sale Display Revenue Share (%), by Application 2025 & 2033
- Figure 28: Asia Pacific Point Of Sale Display Revenue (million), by Type 2025 & 2033
- Figure 29: Asia Pacific Point Of Sale Display Revenue Share (%), by Type 2025 & 2033
- Figure 30: Asia Pacific Point Of Sale Display Revenue (million), by Country 2025 & 2033
- Figure 31: Asia Pacific Point Of Sale Display Revenue Share (%), by Country 2025 & 2033
List of Tables
- Table 1: Global Point Of Sale Display Revenue million Forecast, by Application 2020 & 2033
- Table 2: Global Point Of Sale Display Revenue million Forecast, by Type 2020 & 2033
- Table 3: Global Point Of Sale Display Revenue million Forecast, by Region 2020 & 2033
- Table 4: Global Point Of Sale Display Revenue million Forecast, by Application 2020 & 2033
- Table 5: Global Point Of Sale Display Revenue million Forecast, by Type 2020 & 2033
- Table 6: Global Point Of Sale Display Revenue million Forecast, by Country 2020 & 2033
- Table 7: United States Point Of Sale Display Revenue (million) Forecast, by Application 2020 & 2033
- Table 8: Canada Point Of Sale Display Revenue (million) Forecast, by Application 2020 & 2033
- Table 9: Mexico Point Of Sale Display Revenue (million) Forecast, by Application 2020 & 2033
- Table 10: Global Point Of Sale Display Revenue million Forecast, by Application 2020 & 2033
- Table 11: Global Point Of Sale Display Revenue million Forecast, by Type 2020 & 2033
- Table 12: Global Point Of Sale Display Revenue million Forecast, by Country 2020 & 2033
- Table 13: Brazil Point Of Sale Display Revenue (million) Forecast, by Application 2020 & 2033
- Table 14: Argentina Point Of Sale Display Revenue (million) Forecast, by Application 2020 & 2033
- Table 15: Rest of South America Point Of Sale Display Revenue (million) Forecast, by Application 2020 & 2033
- Table 16: Global Point Of Sale Display Revenue million Forecast, by Application 2020 & 2033
- Table 17: Global Point Of Sale Display Revenue million Forecast, by Type 2020 & 2033
- Table 18: Global Point Of Sale Display Revenue million Forecast, by Country 2020 & 2033
- Table 19: United Kingdom Point Of Sale Display Revenue (million) Forecast, by Application 2020 & 2033
- Table 20: Germany Point Of Sale Display Revenue (million) Forecast, by Application 2020 & 2033
- Table 21: France Point Of Sale Display Revenue (million) Forecast, by Application 2020 & 2033
- Table 22: Italy Point Of Sale Display Revenue (million) Forecast, by Application 2020 & 2033
- Table 23: Spain Point Of Sale Display Revenue (million) Forecast, by Application 2020 & 2033
- Table 24: Russia Point Of Sale Display Revenue (million) Forecast, by Application 2020 & 2033
- Table 25: Benelux Point Of Sale Display Revenue (million) Forecast, by Application 2020 & 2033
- Table 26: Nordics Point Of Sale Display Revenue (million) Forecast, by Application 2020 & 2033
- Table 27: Rest of Europe Point Of Sale Display Revenue (million) Forecast, by Application 2020 & 2033
- Table 28: Global Point Of Sale Display Revenue million Forecast, by Application 2020 & 2033
- Table 29: Global Point Of Sale Display Revenue million Forecast, by Type 2020 & 2033
- Table 30: Global Point Of Sale Display Revenue million Forecast, by Country 2020 & 2033
- Table 31: Turkey Point Of Sale Display Revenue (million) Forecast, by Application 2020 & 2033
- Table 32: Israel Point Of Sale Display Revenue (million) Forecast, by Application 2020 & 2033
- Table 33: GCC Point Of Sale Display Revenue (million) Forecast, by Application 2020 & 2033
- Table 34: North Africa Point Of Sale Display Revenue (million) Forecast, by Application 2020 & 2033
- Table 35: South Africa Point Of Sale Display Revenue (million) Forecast, by Application 2020 & 2033
- Table 36: Rest of Middle East & Africa Point Of Sale Display Revenue (million) Forecast, by Application 2020 & 2033
- Table 37: Global Point Of Sale Display Revenue million Forecast, by Application 2020 & 2033
- Table 38: Global Point Of Sale Display Revenue million Forecast, by Type 2020 & 2033
- Table 39: Global Point Of Sale Display Revenue million Forecast, by Country 2020 & 2033
- Table 40: China Point Of Sale Display Revenue (million) Forecast, by Application 2020 & 2033
- Table 41: India Point Of Sale Display Revenue (million) Forecast, by Application 2020 & 2033
- Table 42: Japan Point Of Sale Display Revenue (million) Forecast, by Application 2020 & 2033
- Table 43: South Korea Point Of Sale Display Revenue (million) Forecast, by Application 2020 & 2033
- Table 44: ASEAN Point Of Sale Display Revenue (million) Forecast, by Application 2020 & 2033
- Table 45: Oceania Point Of Sale Display Revenue (million) Forecast, by Application 2020 & 2033
- Table 46: Rest of Asia Pacific Point Of Sale Display Revenue (million) Forecast, by Application 2020 & 2033
Frequently Asked Questions
1. What is the projected Compound Annual Growth Rate (CAGR) of the Point Of Sale Display?
The projected CAGR is approximately XXX%.
2. Which companies are prominent players in the Point Of Sale Display?
Key companies in the market include Menasha Packaging Company, LLC, Smurfit Kappa Display, DS Smith, Sonoco Products Company, Georgia-Pacific LLC, WestRock Company, Felbro, Inc., FFR Merchandising, Creative Displays Now, Fencor Packaging Group Limited, Marketing Alliance Group, Hawver Display, Swisstribe, International Paper.
3. What are the main segments of the Point Of Sale Display?
The market segments include Application, Type.
4. Can you provide details about the market size?
The market size is estimated to be USD XXX million as of 2022.
5. What are some drivers contributing to market growth?
N/A
6. What are the notable trends driving market growth?
N/A
7. Are there any restraints impacting market growth?
N/A
8. Can you provide examples of recent developments in the market?
N/A
9. What pricing options are available for accessing the report?
Pricing options include single-user, multi-user, and enterprise licenses priced at USD 2900.00, USD 4350.00, and USD 5800.00 respectively.
10. Is the market size provided in terms of value or volume?
The market size is provided in terms of value, measured in million.
11. Are there any specific market keywords associated with the report?
Yes, the market keyword associated with the report is "Point Of Sale Display," which aids in identifying and referencing the specific market segment covered.
12. How do I determine which pricing option suits my needs best?
The pricing options vary based on user requirements and access needs. Individual users may opt for single-user licenses, while businesses requiring broader access may choose multi-user or enterprise licenses for cost-effective access to the report.
13. Are there any additional resources or data provided in the Point Of Sale Display report?
While the report offers comprehensive insights, it's advisable to review the specific contents or supplementary materials provided to ascertain if additional resources or data are available.
14. How can I stay updated on further developments or reports in the Point Of Sale Display?
To stay informed about further developments, trends, and reports in the Point Of Sale Display, consider subscribing to industry newsletters, following relevant companies and organizations, or regularly checking reputable industry news sources and publications.
Methodology
Step 1 - Identification of Relevant Samples Size from Population Database


Step 2 - Approaches for Defining Global Market Size (Value, Volume* & Price*)

Note*: In applicable scenarios
Step 3 - Data Sources
Primary Research
- Web Analytics
- Survey Reports
- Research Institute
- Latest Research Reports
- Opinion Leaders
Secondary Research
- Annual Reports
- White Paper
- Latest Press Release
- Industry Association
- Paid Database
- Investor Presentations

Step 4 - Data Triangulation
Involves using different sources of information in order to increase the validity of a study
These sources are likely to be stakeholders in a program - participants, other researchers, program staff, other community members, and so on.
Then we put all data in single framework & apply various statistical tools to find out the dynamic on the market.
During the analysis stage, feedback from the stakeholder groups would be compared to determine areas of agreement as well as areas of divergence