

Key Insights
The global Poly Cone Caps market is projected for significant expansion, anticipating a market size of $1203.4 million by 2025, with a robust Compound Annual Growth Rate (CAGR) of 13.6% from the base year 2025 through 2033. This growth is propelled by increasing demand across key end-use industries, particularly Food & Beverages and Personal Care & Cosmetics, which constitute the largest application segments. Poly cone caps' inherent qualities, including superior sealing, tamper-evidence, and cost-effectiveness, make them essential for diverse packaging solutions. Innovations in material science and manufacturing are also fostering the development of more sustainable and advanced poly cone cap designs, further stimulating market adoption.
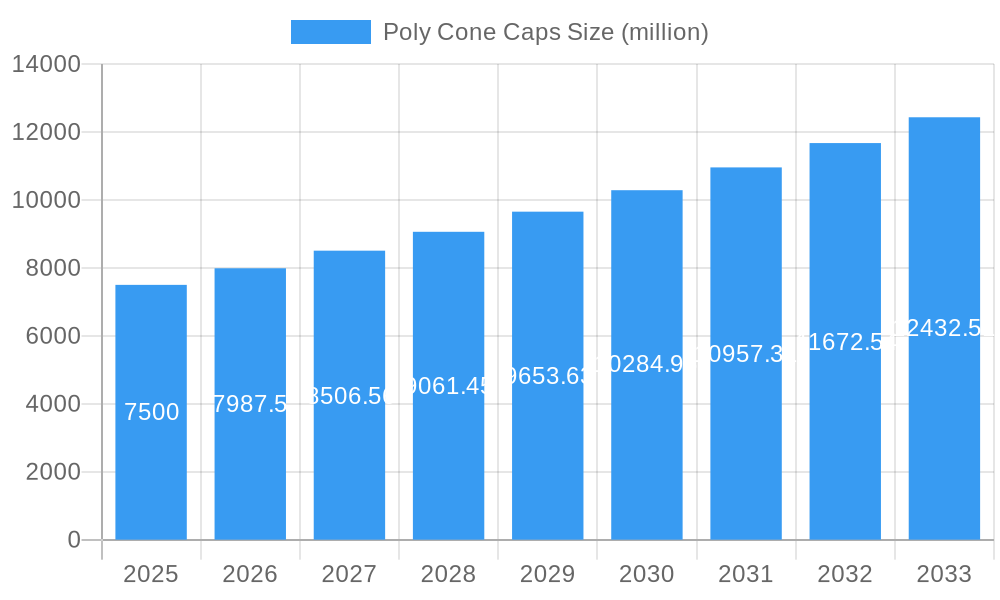
Poly Cone Caps Market Size (In Billion)
Market growth is further supported by favorable trends such as the rising demand for convenient and secure packaging, the expansion of e-commerce requiring enhanced product protection during transit, and continuous product innovation by leading manufacturers. These companies are investing in R&D to deliver specialized caps with advanced functionalities. However, potential challenges include raw material price volatility, especially for petrochemical derivatives, and increasing regulatory pressures concerning plastic usage and disposal. Geographically, the Asia Pacific region, led by China and India, is expected to experience the most dynamic growth due to its expanding industrial base and burgeoning consumer market. North America and Europe will remain significant markets, driven by established industries and a strong emphasis on product safety and visual appeal.
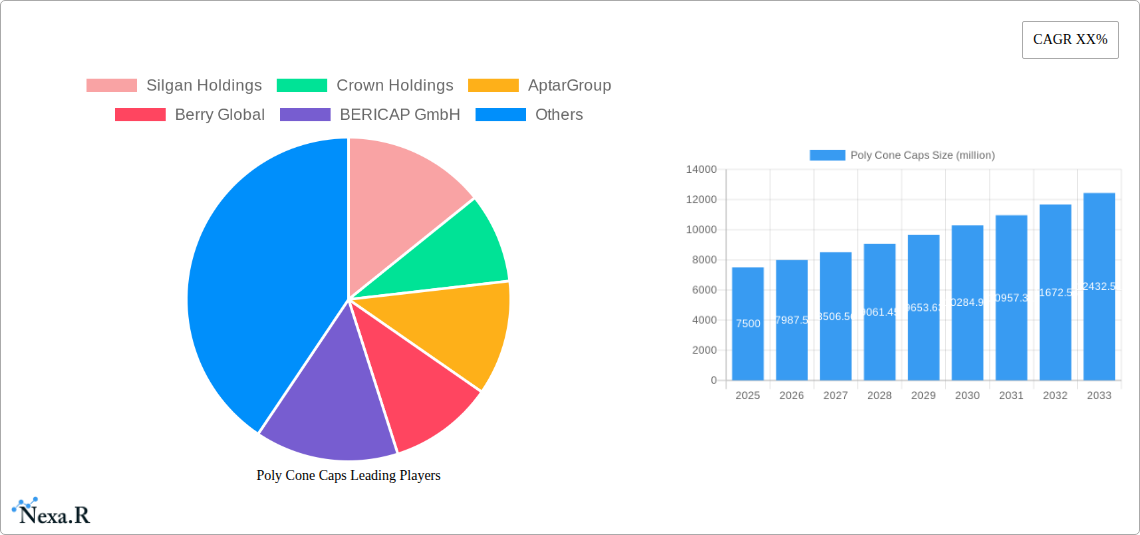
Poly Cone Caps Company Market Share
This comprehensive report provides an in-depth analysis of the global Poly Cone Caps market, a critical segment within the broader packaging closure industry. Covering the historical period 2019-2024 and projecting growth through 2033, this analysis utilizes extensive data to offer actionable insights for stakeholders. The report examines market dynamics, growth trajectories, regional leadership, product innovations, key drivers, challenges, emerging opportunities, and a forward-looking perspective on the future of poly cone caps.
Poly Cone Caps Market Dynamics & Structure
The global Poly Cone Caps market exhibits a moderately concentrated structure, with key players like Silgan Holdings, Crown Holdings, AptarGroup, Berry Global, and BERICAP GmbH holding significant market shares. Technological innovation is a primary driver, with ongoing advancements in material science leading to lighter, more durable, and sustainable poly cone cap solutions. Regulatory frameworks, particularly those concerning food contact safety and environmental impact, are continuously shaping product development and manufacturing processes. Competitive product substitutes, such as metal caps and other plastic closure types, present a constant challenge, necessitating continuous innovation and cost-effectiveness. End-user demographics are shifting towards a demand for convenience, tamper-evidence, and eco-friendly packaging, directly influencing poly cone cap design and functionality. Mergers and acquisitions (M&A) remain a significant trend, with companies consolidating their market positions and expanding their product portfolios. For instance, the historical period saw an estimated 35 M&A deals, contributing to the industry's consolidation.
- Market Concentration: Dominated by a few large players, but with significant opportunities for niche manufacturers.
- Technological Drivers: Advancements in polymer technology, injection molding techniques, and anti-counterfeiting features.
- Regulatory Landscape: Strict compliance with FDA, EU food safety regulations, and growing emphasis on recyclability standards.
- Competitive Substitutes: Metal caps, snap-on caps, and alternative plastic closure designs.
- End-User Demographics: Increasing demand for user-friendly designs, child-resistant features, and sustainable materials.
- M&A Trends: Strategic acquisitions to expand geographical reach, technological capabilities, and product offerings.
Poly Cone Caps Growth Trends & Insights
The global Poly Cone Caps market is projected to experience robust growth driven by increasing demand across various end-use industries. The market size, valued at an estimated USD 5,500 million in the base year 2025, is anticipated to reach USD 7,950 million by 2033, demonstrating a Compound Annual Growth Rate (CAGR) of approximately 4.8% during the forecast period (2025-2033). Adoption rates are steadily increasing, particularly in emerging economies where industrialization and consumer spending power are on the rise. Technological disruptions, such as advancements in automation for cap manufacturing and the integration of smart packaging features, are further propelling market expansion. Consumer behavior shifts towards e-commerce and ready-to-consume products are also contributing significantly, necessitating secure and efficient packaging solutions like poly cone caps. The "less than 15 mm" segment, essential for small vials and specialized packaging, is expected to see a consistent demand, while the "15 to 30 mm" segment, crucial for beverage and personal care products, will continue to be the largest contributor to market volume. The report's analysis reveals that the "30 to 40 mm" and "More Than 40 mm" segments will witness accelerated growth due to their application in larger containers for chemicals, lubricants, and industrial products. The historical period (2019-2024) witnessed steady market penetration, with an estimated 72% of eligible product packaging utilizing poly cone caps by 2024. This upward trajectory is expected to continue as manufacturers prioritize cost-effectiveness, product integrity, and consumer appeal in their packaging strategies. The growing emphasis on tamper-evident features and enhanced sealing capabilities will further cement the position of poly cone caps in the market.
Dominant Regions, Countries, or Segments in Poly Cone Caps
North America, led by the United States, is a dominant region in the global Poly Cone Caps market, contributing an estimated 30% of the global market share in the base year 2025. This dominance is fueled by a mature industrial base, strong consumer demand across diverse sectors, and a high prevalence of stringent quality and safety standards. The food & beverages segment, accounting for approximately 45% of the total application market, is a primary driver of growth in this region, closely followed by personal care & cosmetics. The "15 to 30 mm" type segment holds the largest market share within North America, catering to the widespread use in beverage bottles, personal care products, and pharmaceuticals.
- North America (USA, Canada, Mexico): High per capita consumption, advanced manufacturing capabilities, and a strong focus on product safety and convenience.
- Application Dominance: Food & Beverages (estimated 30% of regional market), Personal Care & Cosmetics (estimated 25% of regional market).
- Type Dominance: 15 to 30 mm (estimated 40% of regional segment market).
- Key Drivers: Robust retail infrastructure, high disposable incomes, and increasing demand for premium and convenience packaging.
Asia Pacific, particularly China, is emerging as a significant growth engine, driven by rapid industrialization, a burgeoning middle class, and expanding manufacturing capabilities. China's market share is projected to reach 25% by 2033.
- Asia Pacific (China, India, Japan): Fastest-growing market, large population base, and increasing adoption of modern packaging solutions.
- Application Dominance: Food & Beverages, Chemicals & Fertilizers (driven by agricultural output).
- Type Dominance: 15 to 30 mm and Less Than 15 mm (for pharmaceutical applications).
- Key Drivers: Favorable manufacturing costs, growing export markets, and increasing consumer awareness of packaged goods.
Europe follows closely, with Germany, France, and the UK leading the demand for high-quality and sustainable poly cone caps.
- Europe (Germany, UK, France): Emphasis on sustainability, stringent regulations, and a mature market for premium packaging.
- Application Dominance: Food & Beverages, Pharmaceuticals.
- Type Dominance: 15 to 30 mm and 30 to 40 mm.
- Key Drivers: Strict environmental policies, consumer preference for eco-friendly products, and established food and beverage industries.
The "Others" application segment, encompassing industrial chemicals, lubricants, and agricultural products, is experiencing substantial growth, particularly in developing economies. This is driven by the need for secure containment and safe dispensing of these products. The "More Than 40 mm" type segment is also witnessing an upward trend due to its application in larger industrial containers.
Poly Cone Caps Product Landscape
The poly cone caps market is characterized by a diverse product landscape designed to meet specific application needs. Innovations focus on enhanced sealing integrity, tamper-evidence, ease of dispensing, and improved sustainability. Features such as induction seals, push-and-turn mechanisms, and child-resistant designs are increasingly integrated. The performance metrics emphasize chemical resistance, thermal stability, and leak-proof capabilities, ensuring product safety and shelf-life extension. Technological advancements in polymer blends and manufacturing processes allow for the creation of caps that are both lightweight and robust, contributing to reduced material usage and lower transportation costs. Unique selling propositions often revolve around customizable designs, color options, and the incorporation of anti-counterfeiting technologies to protect brand integrity.
Key Drivers, Barriers & Challenges in Poly Cone Caps
Key Drivers:
- Growing Demand from Food & Beverage Industry: Essential for maintaining product freshness and preventing contamination in a wide range of food and beverage products.
- Expansion of Personal Care & Cosmetics Sector: Demand for secure, aesthetically pleasing, and functional closures for lotions, creams, and other personal care items.
- Industrialization and Growth in Chemicals & Fertilizers: Need for robust and leak-proof closures for safe storage and transportation of industrial chemicals and agricultural products.
- Technological Advancements: Innovations in material science leading to more durable, lightweight, and sustainable poly cone caps.
- E-commerce Growth: Increased reliance on secure packaging for shipping and delivery of consumer goods.
Barriers & Challenges:
- Competition from Alternative Closure Types: Metal caps and other plastic closures offer competitive alternatives, necessitating continuous innovation and cost management.
- Volatility in Raw Material Prices: Fluctuations in the cost of polyethylene and polypropylene can impact manufacturing costs and profit margins.
- Stringent Regulatory Compliance: Adhering to evolving food safety and environmental regulations can be costly and time-consuming.
- Supply Chain Disruptions: Global events and geopolitical factors can impact the availability and cost of raw materials and finished goods.
- Consumer Preference for Sustainability: Pressure to adopt fully recyclable or biodegradable materials, requiring significant R&D investment.
Emerging Opportunities in Poly Cone Caps
Emerging opportunities in the poly cone caps market lie in the development of biodegradable and compostable materials, catering to the growing global demand for sustainable packaging solutions. The integration of smart technology, such as RFID tags or NFC chips, within the caps presents a significant opportunity for enhanced traceability, anti-counterfeiting, and consumer engagement. Furthermore, the expanding pharmaceutical industry, particularly in emerging markets, offers substantial growth potential for specialized poly cone caps with advanced tamper-evident and child-resistant features. Untapped markets in developing regions, where packaged goods consumption is on the rise, also present fertile ground for expansion.
Growth Accelerators in the Poly Cone Caps Industry
Key growth accelerators for the poly cone caps industry include ongoing technological breakthroughs in polymer science that enable the creation of higher-performance, more cost-effective, and environmentally friendly materials. Strategic partnerships between cap manufacturers and packaging machinery providers are streamlining production processes and reducing lead times. Market expansion strategies focused on emerging economies, coupled with the development of customized closure solutions for niche applications, will further propel long-term growth. The increasing adoption of automation in manufacturing plants is also a significant catalyst, improving efficiency and scalability.
Key Players Shaping the Poly Cone Caps Market
- Silgan Holdings
- Crown Holdings
- AptarGroup
- Berry Global
- BERICAP GmbH
- Closure Systems International
- RPC Group
- ALPLA
- THC
- O.Berk
- United Caps Luxembourg
- Toyo Seikan
- Pact Group Holdings
- Humen Xincheng Plastic Factory
- Zijiang
- Zhuhai Zhongfu
Notable Milestones in Poly Cone Caps Sector
- 2020: Significant increase in demand for tamper-evident caps due to heightened consumer awareness of product safety.
- 2021: Advancements in bio-based polymers for sustainable cap production gain traction.
- 2022: Increased investment in R&D for child-resistant closure technologies.
- 2023: Several key players announce strategic acquisitions to expand their product portfolios and market reach.
- 2024: Growing adoption of advanced injection molding techniques for improved efficiency and reduced waste.
In-Depth Poly Cone Caps Market Outlook
The future outlook for the poly cone caps market is exceptionally positive, driven by sustained demand from core industries and an increasing focus on innovation and sustainability. Growth accelerators like advancements in material science, strategic market expansion into high-growth regions, and the continuous evolution of packaging requirements will shape the industry landscape. The increasing integration of smart features and the development of eco-friendly alternatives are expected to create new avenues for growth. Stakeholders who prioritize product development aligned with consumer preferences for convenience, safety, and environmental responsibility are poised for significant success in the coming years. The market is expected to remain dynamic, with ongoing consolidation and technological advancements driving value creation.
Poly Cone Caps Segmentation
-
1. Application
- 1.1. Food & Beverages
- 1.2. Personal Care & Cosmetics
- 1.3. Chemicals & Fertilizers
- 1.4. Petroleum & Lubricants
- 1.5. Others
-
2. Types
- 2.1. Less Than 15 mm
- 2.2. 15 to 30 mm
- 2.3. 30 to 40 mm
- 2.4. More Than 40 mm
Poly Cone Caps Segmentation By Geography
-
1. North America
- 1.1. United States
- 1.2. Canada
- 1.3. Mexico
-
2. South America
- 2.1. Brazil
- 2.2. Argentina
- 2.3. Rest of South America
-
3. Europe
- 3.1. United Kingdom
- 3.2. Germany
- 3.3. France
- 3.4. Italy
- 3.5. Spain
- 3.6. Russia
- 3.7. Benelux
- 3.8. Nordics
- 3.9. Rest of Europe
-
4. Middle East & Africa
- 4.1. Turkey
- 4.2. Israel
- 4.3. GCC
- 4.4. North Africa
- 4.5. South Africa
- 4.6. Rest of Middle East & Africa
-
5. Asia Pacific
- 5.1. China
- 5.2. India
- 5.3. Japan
- 5.4. South Korea
- 5.5. ASEAN
- 5.6. Oceania
- 5.7. Rest of Asia Pacific
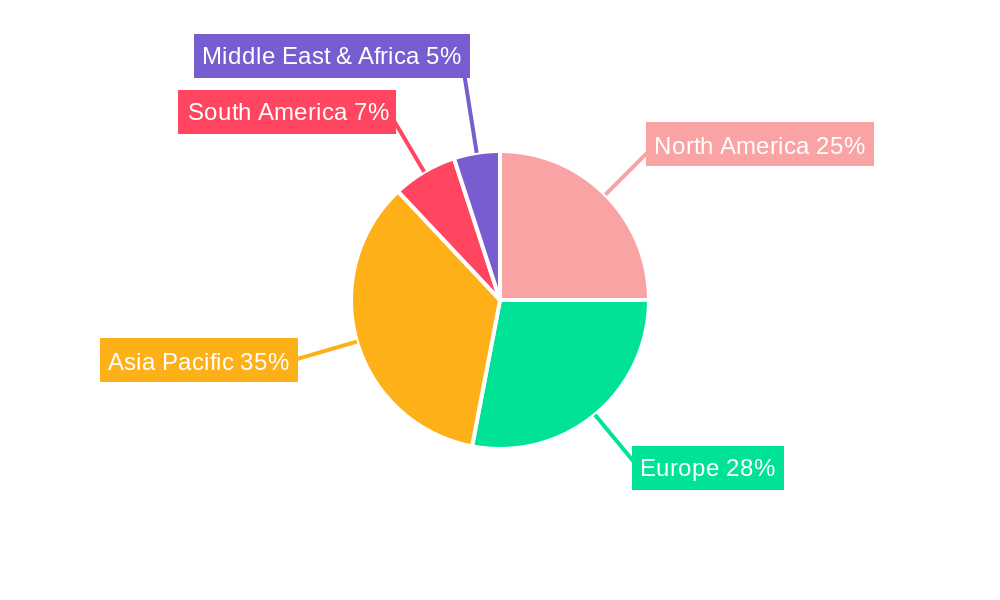
Poly Cone Caps Regional Market Share
Geographic Coverage of Poly Cone Caps
Poly Cone Caps REPORT HIGHLIGHTS
| Aspects | Details |
|---|---|
| Study Period | 2020-2034 |
| Base Year | 2025 |
| Estimated Year | 2026 |
| Forecast Period | 2026-2034 |
| Historical Period | 2020-2025 |
| Growth Rate | CAGR of 13.6% from 2020-2034 |
| Segmentation |
|
Table of Contents
- 1. Introduction
- 1.1. Research Scope
- 1.2. Market Segmentation
- 1.3. Research Methodology
- 1.4. Definitions and Assumptions
- 2. Executive Summary
- 2.1. Introduction
- 3. Market Dynamics
- 3.1. Introduction
- 3.2. Market Drivers
- 3.3. Market Restrains
- 3.4. Market Trends
- 4. Market Factor Analysis
- 4.1. Porters Five Forces
- 4.2. Supply/Value Chain
- 4.3. PESTEL analysis
- 4.4. Market Entropy
- 4.5. Patent/Trademark Analysis
- 5. Global Poly Cone Caps Analysis, Insights and Forecast, 2020-2032
- 5.1. Market Analysis, Insights and Forecast - by Application
- 5.1.1. Food & Beverages
- 5.1.2. Personal Care & Cosmetics
- 5.1.3. Chemicals & Fertilizers
- 5.1.4. Petroleum & Lubricants
- 5.1.5. Others
- 5.2. Market Analysis, Insights and Forecast - by Types
- 5.2.1. Less Than 15 mm
- 5.2.2. 15 to 30 mm
- 5.2.3. 30 to 40 mm
- 5.2.4. More Than 40 mm
- 5.3. Market Analysis, Insights and Forecast - by Region
- 5.3.1. North America
- 5.3.2. South America
- 5.3.3. Europe
- 5.3.4. Middle East & Africa
- 5.3.5. Asia Pacific
- 5.1. Market Analysis, Insights and Forecast - by Application
- 6. North America Poly Cone Caps Analysis, Insights and Forecast, 2020-2032
- 6.1. Market Analysis, Insights and Forecast - by Application
- 6.1.1. Food & Beverages
- 6.1.2. Personal Care & Cosmetics
- 6.1.3. Chemicals & Fertilizers
- 6.1.4. Petroleum & Lubricants
- 6.1.5. Others
- 6.2. Market Analysis, Insights and Forecast - by Types
- 6.2.1. Less Than 15 mm
- 6.2.2. 15 to 30 mm
- 6.2.3. 30 to 40 mm
- 6.2.4. More Than 40 mm
- 6.1. Market Analysis, Insights and Forecast - by Application
- 7. South America Poly Cone Caps Analysis, Insights and Forecast, 2020-2032
- 7.1. Market Analysis, Insights and Forecast - by Application
- 7.1.1. Food & Beverages
- 7.1.2. Personal Care & Cosmetics
- 7.1.3. Chemicals & Fertilizers
- 7.1.4. Petroleum & Lubricants
- 7.1.5. Others
- 7.2. Market Analysis, Insights and Forecast - by Types
- 7.2.1. Less Than 15 mm
- 7.2.2. 15 to 30 mm
- 7.2.3. 30 to 40 mm
- 7.2.4. More Than 40 mm
- 7.1. Market Analysis, Insights and Forecast - by Application
- 8. Europe Poly Cone Caps Analysis, Insights and Forecast, 2020-2032
- 8.1. Market Analysis, Insights and Forecast - by Application
- 8.1.1. Food & Beverages
- 8.1.2. Personal Care & Cosmetics
- 8.1.3. Chemicals & Fertilizers
- 8.1.4. Petroleum & Lubricants
- 8.1.5. Others
- 8.2. Market Analysis, Insights and Forecast - by Types
- 8.2.1. Less Than 15 mm
- 8.2.2. 15 to 30 mm
- 8.2.3. 30 to 40 mm
- 8.2.4. More Than 40 mm
- 8.1. Market Analysis, Insights and Forecast - by Application
- 9. Middle East & Africa Poly Cone Caps Analysis, Insights and Forecast, 2020-2032
- 9.1. Market Analysis, Insights and Forecast - by Application
- 9.1.1. Food & Beverages
- 9.1.2. Personal Care & Cosmetics
- 9.1.3. Chemicals & Fertilizers
- 9.1.4. Petroleum & Lubricants
- 9.1.5. Others
- 9.2. Market Analysis, Insights and Forecast - by Types
- 9.2.1. Less Than 15 mm
- 9.2.2. 15 to 30 mm
- 9.2.3. 30 to 40 mm
- 9.2.4. More Than 40 mm
- 9.1. Market Analysis, Insights and Forecast - by Application
- 10. Asia Pacific Poly Cone Caps Analysis, Insights and Forecast, 2020-2032
- 10.1. Market Analysis, Insights and Forecast - by Application
- 10.1.1. Food & Beverages
- 10.1.2. Personal Care & Cosmetics
- 10.1.3. Chemicals & Fertilizers
- 10.1.4. Petroleum & Lubricants
- 10.1.5. Others
- 10.2. Market Analysis, Insights and Forecast - by Types
- 10.2.1. Less Than 15 mm
- 10.2.2. 15 to 30 mm
- 10.2.3. 30 to 40 mm
- 10.2.4. More Than 40 mm
- 10.1. Market Analysis, Insights and Forecast - by Application
- 11. Competitive Analysis
- 11.1. Global Market Share Analysis 2025
- 11.2. Company Profiles
- 11.2.1 Silgan Holdings
- 11.2.1.1. Overview
- 11.2.1.2. Products
- 11.2.1.3. SWOT Analysis
- 11.2.1.4. Recent Developments
- 11.2.1.5. Financials (Based on Availability)
- 11.2.2 Crown Holdings
- 11.2.2.1. Overview
- 11.2.2.2. Products
- 11.2.2.3. SWOT Analysis
- 11.2.2.4. Recent Developments
- 11.2.2.5. Financials (Based on Availability)
- 11.2.3 AptarGroup
- 11.2.3.1. Overview
- 11.2.3.2. Products
- 11.2.3.3. SWOT Analysis
- 11.2.3.4. Recent Developments
- 11.2.3.5. Financials (Based on Availability)
- 11.2.4 Berry Global
- 11.2.4.1. Overview
- 11.2.4.2. Products
- 11.2.4.3. SWOT Analysis
- 11.2.4.4. Recent Developments
- 11.2.4.5. Financials (Based on Availability)
- 11.2.5 BERICAP GmbH
- 11.2.5.1. Overview
- 11.2.5.2. Products
- 11.2.5.3. SWOT Analysis
- 11.2.5.4. Recent Developments
- 11.2.5.5. Financials (Based on Availability)
- 11.2.6 Closure Systems International
- 11.2.6.1. Overview
- 11.2.6.2. Products
- 11.2.6.3. SWOT Analysis
- 11.2.6.4. Recent Developments
- 11.2.6.5. Financials (Based on Availability)
- 11.2.7 RPC Group
- 11.2.7.1. Overview
- 11.2.7.2. Products
- 11.2.7.3. SWOT Analysis
- 11.2.7.4. Recent Developments
- 11.2.7.5. Financials (Based on Availability)
- 11.2.8 ALPLA
- 11.2.8.1. Overview
- 11.2.8.2. Products
- 11.2.8.3. SWOT Analysis
- 11.2.8.4. Recent Developments
- 11.2.8.5. Financials (Based on Availability)
- 11.2.9 THC
- 11.2.9.1. Overview
- 11.2.9.2. Products
- 11.2.9.3. SWOT Analysis
- 11.2.9.4. Recent Developments
- 11.2.9.5. Financials (Based on Availability)
- 11.2.10 O.Berk
- 11.2.10.1. Overview
- 11.2.10.2. Products
- 11.2.10.3. SWOT Analysis
- 11.2.10.4. Recent Developments
- 11.2.10.5. Financials (Based on Availability)
- 11.2.11 United Caps Luxembourg
- 11.2.11.1. Overview
- 11.2.11.2. Products
- 11.2.11.3. SWOT Analysis
- 11.2.11.4. Recent Developments
- 11.2.11.5. Financials (Based on Availability)
- 11.2.12 Toyo Seikan
- 11.2.12.1. Overview
- 11.2.12.2. Products
- 11.2.12.3. SWOT Analysis
- 11.2.12.4. Recent Developments
- 11.2.12.5. Financials (Based on Availability)
- 11.2.13 Pact Group Holdings
- 11.2.13.1. Overview
- 11.2.13.2. Products
- 11.2.13.3. SWOT Analysis
- 11.2.13.4. Recent Developments
- 11.2.13.5. Financials (Based on Availability)
- 11.2.14 Humen Xincheng Plastic Factory
- 11.2.14.1. Overview
- 11.2.14.2. Products
- 11.2.14.3. SWOT Analysis
- 11.2.14.4. Recent Developments
- 11.2.14.5. Financials (Based on Availability)
- 11.2.15 Zijiang
- 11.2.15.1. Overview
- 11.2.15.2. Products
- 11.2.15.3. SWOT Analysis
- 11.2.15.4. Recent Developments
- 11.2.15.5. Financials (Based on Availability)
- 11.2.16 Zhuhai Zhongfu
- 11.2.16.1. Overview
- 11.2.16.2. Products
- 11.2.16.3. SWOT Analysis
- 11.2.16.4. Recent Developments
- 11.2.16.5. Financials (Based on Availability)
- 11.2.1 Silgan Holdings
List of Figures
- Figure 1: Global Poly Cone Caps Revenue Breakdown (million, %) by Region 2025 & 2033
- Figure 2: North America Poly Cone Caps Revenue (million), by Application 2025 & 2033
- Figure 3: North America Poly Cone Caps Revenue Share (%), by Application 2025 & 2033
- Figure 4: North America Poly Cone Caps Revenue (million), by Types 2025 & 2033
- Figure 5: North America Poly Cone Caps Revenue Share (%), by Types 2025 & 2033
- Figure 6: North America Poly Cone Caps Revenue (million), by Country 2025 & 2033
- Figure 7: North America Poly Cone Caps Revenue Share (%), by Country 2025 & 2033
- Figure 8: South America Poly Cone Caps Revenue (million), by Application 2025 & 2033
- Figure 9: South America Poly Cone Caps Revenue Share (%), by Application 2025 & 2033
- Figure 10: South America Poly Cone Caps Revenue (million), by Types 2025 & 2033
- Figure 11: South America Poly Cone Caps Revenue Share (%), by Types 2025 & 2033
- Figure 12: South America Poly Cone Caps Revenue (million), by Country 2025 & 2033
- Figure 13: South America Poly Cone Caps Revenue Share (%), by Country 2025 & 2033
- Figure 14: Europe Poly Cone Caps Revenue (million), by Application 2025 & 2033
- Figure 15: Europe Poly Cone Caps Revenue Share (%), by Application 2025 & 2033
- Figure 16: Europe Poly Cone Caps Revenue (million), by Types 2025 & 2033
- Figure 17: Europe Poly Cone Caps Revenue Share (%), by Types 2025 & 2033
- Figure 18: Europe Poly Cone Caps Revenue (million), by Country 2025 & 2033
- Figure 19: Europe Poly Cone Caps Revenue Share (%), by Country 2025 & 2033
- Figure 20: Middle East & Africa Poly Cone Caps Revenue (million), by Application 2025 & 2033
- Figure 21: Middle East & Africa Poly Cone Caps Revenue Share (%), by Application 2025 & 2033
- Figure 22: Middle East & Africa Poly Cone Caps Revenue (million), by Types 2025 & 2033
- Figure 23: Middle East & Africa Poly Cone Caps Revenue Share (%), by Types 2025 & 2033
- Figure 24: Middle East & Africa Poly Cone Caps Revenue (million), by Country 2025 & 2033
- Figure 25: Middle East & Africa Poly Cone Caps Revenue Share (%), by Country 2025 & 2033
- Figure 26: Asia Pacific Poly Cone Caps Revenue (million), by Application 2025 & 2033
- Figure 27: Asia Pacific Poly Cone Caps Revenue Share (%), by Application 2025 & 2033
- Figure 28: Asia Pacific Poly Cone Caps Revenue (million), by Types 2025 & 2033
- Figure 29: Asia Pacific Poly Cone Caps Revenue Share (%), by Types 2025 & 2033
- Figure 30: Asia Pacific Poly Cone Caps Revenue (million), by Country 2025 & 2033
- Figure 31: Asia Pacific Poly Cone Caps Revenue Share (%), by Country 2025 & 2033
List of Tables
- Table 1: Global Poly Cone Caps Revenue million Forecast, by Application 2020 & 2033
- Table 2: Global Poly Cone Caps Revenue million Forecast, by Types 2020 & 2033
- Table 3: Global Poly Cone Caps Revenue million Forecast, by Region 2020 & 2033
- Table 4: Global Poly Cone Caps Revenue million Forecast, by Application 2020 & 2033
- Table 5: Global Poly Cone Caps Revenue million Forecast, by Types 2020 & 2033
- Table 6: Global Poly Cone Caps Revenue million Forecast, by Country 2020 & 2033
- Table 7: United States Poly Cone Caps Revenue (million) Forecast, by Application 2020 & 2033
- Table 8: Canada Poly Cone Caps Revenue (million) Forecast, by Application 2020 & 2033
- Table 9: Mexico Poly Cone Caps Revenue (million) Forecast, by Application 2020 & 2033
- Table 10: Global Poly Cone Caps Revenue million Forecast, by Application 2020 & 2033
- Table 11: Global Poly Cone Caps Revenue million Forecast, by Types 2020 & 2033
- Table 12: Global Poly Cone Caps Revenue million Forecast, by Country 2020 & 2033
- Table 13: Brazil Poly Cone Caps Revenue (million) Forecast, by Application 2020 & 2033
- Table 14: Argentina Poly Cone Caps Revenue (million) Forecast, by Application 2020 & 2033
- Table 15: Rest of South America Poly Cone Caps Revenue (million) Forecast, by Application 2020 & 2033
- Table 16: Global Poly Cone Caps Revenue million Forecast, by Application 2020 & 2033
- Table 17: Global Poly Cone Caps Revenue million Forecast, by Types 2020 & 2033
- Table 18: Global Poly Cone Caps Revenue million Forecast, by Country 2020 & 2033
- Table 19: United Kingdom Poly Cone Caps Revenue (million) Forecast, by Application 2020 & 2033
- Table 20: Germany Poly Cone Caps Revenue (million) Forecast, by Application 2020 & 2033
- Table 21: France Poly Cone Caps Revenue (million) Forecast, by Application 2020 & 2033
- Table 22: Italy Poly Cone Caps Revenue (million) Forecast, by Application 2020 & 2033
- Table 23: Spain Poly Cone Caps Revenue (million) Forecast, by Application 2020 & 2033
- Table 24: Russia Poly Cone Caps Revenue (million) Forecast, by Application 2020 & 2033
- Table 25: Benelux Poly Cone Caps Revenue (million) Forecast, by Application 2020 & 2033
- Table 26: Nordics Poly Cone Caps Revenue (million) Forecast, by Application 2020 & 2033
- Table 27: Rest of Europe Poly Cone Caps Revenue (million) Forecast, by Application 2020 & 2033
- Table 28: Global Poly Cone Caps Revenue million Forecast, by Application 2020 & 2033
- Table 29: Global Poly Cone Caps Revenue million Forecast, by Types 2020 & 2033
- Table 30: Global Poly Cone Caps Revenue million Forecast, by Country 2020 & 2033
- Table 31: Turkey Poly Cone Caps Revenue (million) Forecast, by Application 2020 & 2033
- Table 32: Israel Poly Cone Caps Revenue (million) Forecast, by Application 2020 & 2033
- Table 33: GCC Poly Cone Caps Revenue (million) Forecast, by Application 2020 & 2033
- Table 34: North Africa Poly Cone Caps Revenue (million) Forecast, by Application 2020 & 2033
- Table 35: South Africa Poly Cone Caps Revenue (million) Forecast, by Application 2020 & 2033
- Table 36: Rest of Middle East & Africa Poly Cone Caps Revenue (million) Forecast, by Application 2020 & 2033
- Table 37: Global Poly Cone Caps Revenue million Forecast, by Application 2020 & 2033
- Table 38: Global Poly Cone Caps Revenue million Forecast, by Types 2020 & 2033
- Table 39: Global Poly Cone Caps Revenue million Forecast, by Country 2020 & 2033
- Table 40: China Poly Cone Caps Revenue (million) Forecast, by Application 2020 & 2033
- Table 41: India Poly Cone Caps Revenue (million) Forecast, by Application 2020 & 2033
- Table 42: Japan Poly Cone Caps Revenue (million) Forecast, by Application 2020 & 2033
- Table 43: South Korea Poly Cone Caps Revenue (million) Forecast, by Application 2020 & 2033
- Table 44: ASEAN Poly Cone Caps Revenue (million) Forecast, by Application 2020 & 2033
- Table 45: Oceania Poly Cone Caps Revenue (million) Forecast, by Application 2020 & 2033
- Table 46: Rest of Asia Pacific Poly Cone Caps Revenue (million) Forecast, by Application 2020 & 2033
Frequently Asked Questions
1. What is the projected Compound Annual Growth Rate (CAGR) of the Poly Cone Caps?
The projected CAGR is approximately 13.6%.
2. Which companies are prominent players in the Poly Cone Caps?
Key companies in the market include Silgan Holdings, Crown Holdings, AptarGroup, Berry Global, BERICAP GmbH, Closure Systems International, RPC Group, ALPLA, THC, O.Berk, United Caps Luxembourg, Toyo Seikan, Pact Group Holdings, Humen Xincheng Plastic Factory, Zijiang, Zhuhai Zhongfu.
3. What are the main segments of the Poly Cone Caps?
The market segments include Application, Types.
4. Can you provide details about the market size?
The market size is estimated to be USD 1203.4 million as of 2022.
5. What are some drivers contributing to market growth?
N/A
6. What are the notable trends driving market growth?
N/A
7. Are there any restraints impacting market growth?
N/A
8. Can you provide examples of recent developments in the market?
N/A
9. What pricing options are available for accessing the report?
Pricing options include single-user, multi-user, and enterprise licenses priced at USD 4900.00, USD 7350.00, and USD 9800.00 respectively.
10. Is the market size provided in terms of value or volume?
The market size is provided in terms of value, measured in million.
11. Are there any specific market keywords associated with the report?
Yes, the market keyword associated with the report is "Poly Cone Caps," which aids in identifying and referencing the specific market segment covered.
12. How do I determine which pricing option suits my needs best?
The pricing options vary based on user requirements and access needs. Individual users may opt for single-user licenses, while businesses requiring broader access may choose multi-user or enterprise licenses for cost-effective access to the report.
13. Are there any additional resources or data provided in the Poly Cone Caps report?
While the report offers comprehensive insights, it's advisable to review the specific contents or supplementary materials provided to ascertain if additional resources or data are available.
14. How can I stay updated on further developments or reports in the Poly Cone Caps?
To stay informed about further developments, trends, and reports in the Poly Cone Caps, consider subscribing to industry newsletters, following relevant companies and organizations, or regularly checking reputable industry news sources and publications.
Methodology
Step 1 - Identification of Relevant Samples Size from Population Database


Step 2 - Approaches for Defining Global Market Size (Value, Volume* & Price*)

Note*: In applicable scenarios
Step 3 - Data Sources
Primary Research
- Web Analytics
- Survey Reports
- Research Institute
- Latest Research Reports
- Opinion Leaders
Secondary Research
- Annual Reports
- White Paper
- Latest Press Release
- Industry Association
- Paid Database
- Investor Presentations

Step 4 - Data Triangulation
Involves using different sources of information in order to increase the validity of a study
These sources are likely to be stakeholders in a program - participants, other researchers, program staff, other community members, and so on.
Then we put all data in single framework & apply various statistical tools to find out the dynamic on the market.
During the analysis stage, feedback from the stakeholder groups would be compared to determine areas of agreement as well as areas of divergence