

Key Insights
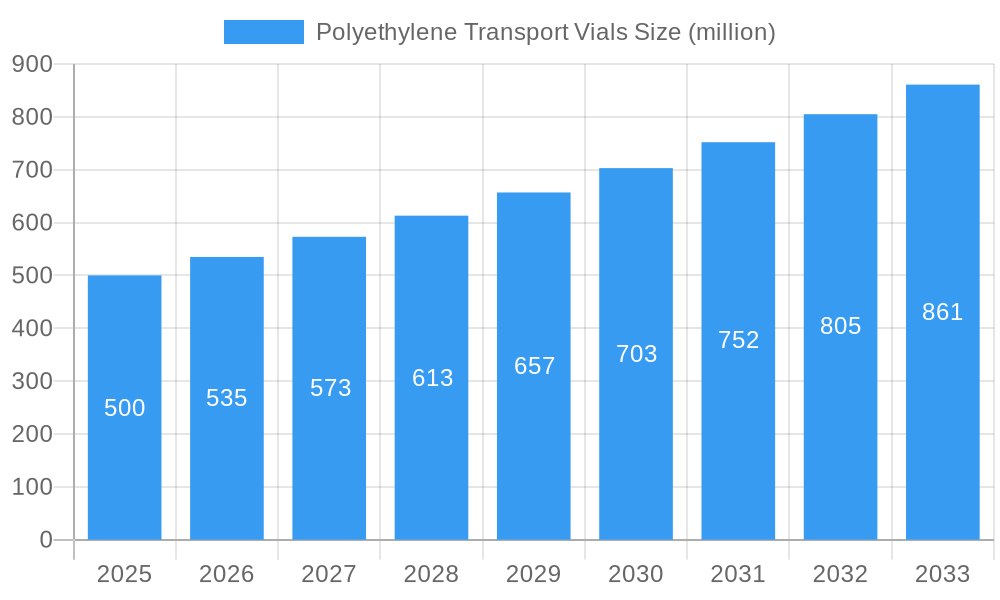
The global Polyethylene Transport Vials market is poised for significant expansion, projected to reach a substantial USD 500 million by 2025. This growth trajectory is underpinned by a healthy CAGR of 7% over the forecast period from 2025 to 2033. The increasing demand for reliable and safe transportation of biological samples, pharmaceuticals, and chemicals across research laboratories, hospitals, and pharmaceutical companies is a primary driver. Advancements in vial design, focusing on improved sealing capabilities and chemical inertness, are further fueling market adoption. Educational institutes also contribute to the demand, requiring these vials for experimental purposes and academic research. The overall market sentiment is positive, with continuous innovation aimed at enhancing product durability and compliance with stringent regulatory standards.
Polyethylene Transport Vials Market Size (In Million)
The market is characterized by a diverse range of applications, with Research Laboratories and Pharmaceutical Companies emerging as key consumers due to their extensive research and development activities and the critical need for sample integrity. Hospitals are also significant end-users, relying on these vials for diagnostic samples and clinical trials. While the 20ml segment is a prominent offering, catering to a wide array of sample volumes, the market is also seeing a rise in specialized vial formats. Key players such as Gerresheimer, Schott, and West Pharmaceutical Services are actively contributing to market dynamics through product development and strategic collaborations. Regional analysis indicates robust growth in North America and Europe, driven by advanced healthcare infrastructure and substantial R&D investments, with Asia Pacific showing accelerated growth potential.
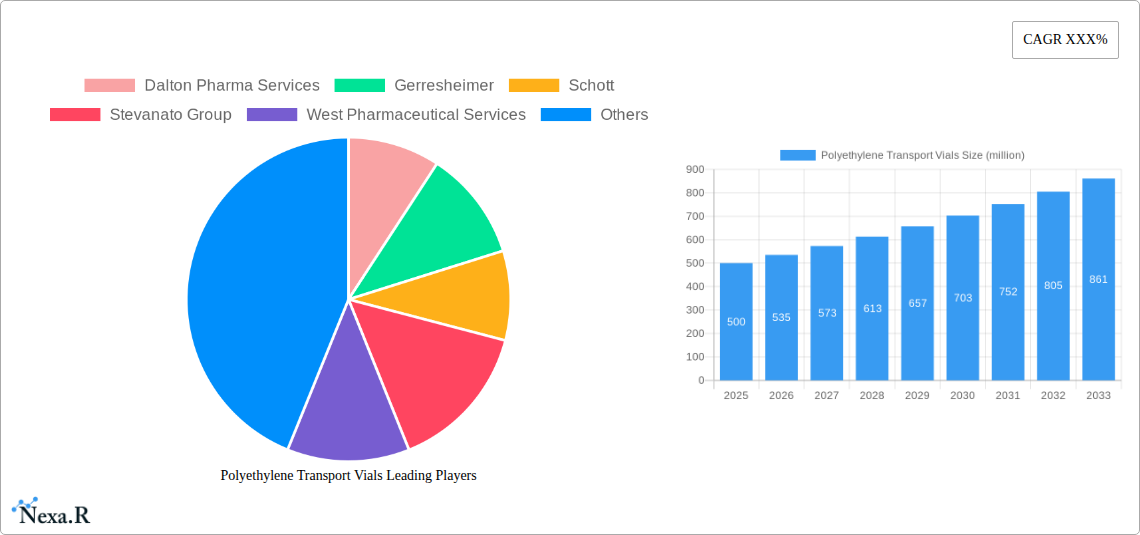
Polyethylene Transport Vials Company Market Share
Polyethylene Transport Vials Market: Comprehensive Analysis and Future Outlook (2019-2033)
This in-depth market research report provides an exhaustive analysis of the global Polyethylene Transport Vials market, covering market dynamics, growth trends, regional dominance, product landscape, key drivers, challenges, opportunities, and a detailed outlook for the forecast period of 2025–2033. Leveraging comprehensive data from the historical period (2019–2024) and the base year (2025), this report offers strategic insights for industry stakeholders.
Polyethylene Transport Vials Market Dynamics & Structure
The global Polyethylene Transport Vials market exhibits a moderately concentrated structure, characterized by a mix of established global players and regional manufacturers. Technological innovation remains a significant driver, with advancements in material science and manufacturing processes continually enhancing vial performance, durability, and sterility. Regulatory frameworks, particularly those pertaining to pharmaceutical packaging and sample integrity, play a crucial role in shaping market entry and product development. Competitive product substitutes, while present in the form of glass vials and other polymer-based containers, are increasingly being challenged by the cost-effectiveness and robust properties of polyethylene. End-user demographics are shifting, with a growing demand from research laboratories and pharmaceutical companies for reliable, single-use transport solutions. Mergers and acquisitions (M&A) trends are observed, as larger players seek to expand their product portfolios and market reach. For instance, the estimated M&A deal volume in the broader pharmaceutical packaging sector has seen a steady increase, indicating consolidation efforts and strategic investments in specialized segments like transport vials. Innovation barriers include the stringent validation processes required for pharmaceutical applications and the capital investment needed for advanced manufacturing technologies.
- Market Concentration: Moderate to High among key players.
- Technological Innovation: Focus on material science, barrier properties, and tamper-evident features.
- Regulatory Landscape: Driven by pharmaceutical, diagnostic, and laboratory safety standards.
- Competitive Landscape: Competition from glass, other polymers, and specialized containment solutions.
- End-User Evolution: Increasing demand for sterile, leak-proof, and traceable vials.
- M&A Activity: Strategic acquisitions to gain market share and technological capabilities.
Polyethylene Transport Vials Growth Trends & Insights
The Polyethylene Transport Vials market is poised for robust growth, projected to expand at a substantial Compound Annual Growth Rate (CAGR) over the forecast period. This expansion is underpinned by increasing global healthcare expenditures, a surge in pharmaceutical research and development activities, and the growing need for safe and efficient transportation of biological samples, reagents, and drug formulations. The adoption rate of polyethylene transport vials is steadily increasing, particularly within pharmaceutical companies and research laboratories, owing to their superior chemical resistance, shatterproof nature, and cost-effectiveness compared to traditional glass alternatives. Technological disruptions, such as advancements in polymer extrusion and molding techniques, are leading to the development of vials with enhanced features, including improved sealing mechanisms and tamper-evident designs, further accelerating market penetration. Consumer behavior shifts are also contributing to this growth; there is a discernible preference for single-use, disposable vials to minimize the risk of cross-contamination and streamline laboratory workflows. This trend is particularly evident in diagnostic testing and clinical trials, where sample integrity is paramount. The market penetration of polyethylene transport vials is expected to reach approximately 45% of the total transport vial market by 2033. The market size is estimated to grow from USD 850 million in 2019 to an anticipated USD 1,800 million by 2033.
Dominant Regions, Countries, or Segments in Polyethylene Transport Vials
The Pharmaceutical Companies segment is identified as the dominant force driving growth in the global Polyethylene Transport Vials market. This dominance stems from the pharmaceutical industry's critical need for reliable, sterile, and compliant packaging solutions for drug substances, intermediates, and finished products during research, development, clinical trials, and distribution. The stringent regulatory requirements governing pharmaceutical packaging, coupled with the inherent advantages of polyethylene transport vials – such as their shatterproof nature, chemical inertness, and affordability – make them an indispensable choice for these entities. North America, particularly the United States, leads in terms of market share within this segment, owing to its vast pharmaceutical manufacturing base, extensive R&D investments, and robust regulatory oversight that promotes the adoption of advanced packaging technologies. Economic policies in the region, such as government initiatives supporting biopharmaceutical innovation, further fuel the demand. Moreover, the presence of a sophisticated healthcare infrastructure and a high prevalence of chronic diseases necessitating advanced drug development contribute to the sustained demand for these vials. The market share of the pharmaceutical companies segment is estimated to be around 35% of the total market.
- Dominant Application Segment: Pharmaceutical Companies
- Key Drivers: Stringent regulatory compliance, need for sample integrity, large-scale drug development, cost-effectiveness.
- Market Share (Segment): Approximately 35 million units in 2025, projected to reach 60 million units by 2033.
- Leading Region: North America (specifically the USA)
- Dominance Factors: Extensive pharmaceutical R&D infrastructure, significant biopharmaceutical manufacturing, supportive economic policies, high healthcare expenditure.
- Growth Potential: Continued investment in drug discovery and precision medicine.
- Dominant Type: While not exclusively dominant, the 20ml vial size represents a highly versatile and frequently utilized capacity across various applications within the pharmaceutical and research laboratory sectors, contributing significantly to overall market volume.
Polyethylene Transport Vials Product Landscape
The polyethylene transport vials market is characterized by continuous product innovation focused on enhancing functionality and meeting evolving industry demands. Manufacturers are developing vials with superior barrier properties to protect sensitive contents from moisture and oxygen ingress, thereby extending shelf life. Advanced manufacturing techniques are enabling the production of vials with improved dimensional accuracy and consistency, crucial for automated laboratory processes. Innovations also include the integration of tamper-evident seals, child-resistant closures, and enhanced grip features for ease of handling. The primary applications span the secure containment and transportation of biological samples, diagnostic reagents, pharmaceutical formulations, and research chemicals, ensuring sterility and integrity throughout the supply chain. Performance metrics such as leak-proof sealing, resistance to breakage, chemical inertness, and compatibility with various sterilization methods are key differentiators.
Key Drivers, Barriers & Challenges in Polyethylene Transport Vials
Key Drivers:
The growth of the Polyethylene Transport Vials market is primarily propelled by the escalating global demand for pharmaceuticals and diagnostics, fueled by an aging population and the increasing prevalence of chronic diseases. Advancements in biotechnology and personalized medicine are leading to the development of more complex therapeutics and diagnostics, necessitating advanced containment solutions. The cost-effectiveness and superior performance of polyethylene compared to traditional materials like glass also act as significant drivers, particularly in large-scale manufacturing and distribution. Furthermore, increasing investments in R&D by pharmaceutical and life science companies globally are creating a sustained demand for reliable transport vials.
Barriers & Challenges:
Despite the positive outlook, the market faces several challenges. Stringent regulatory compliance for pharmaceutical packaging can be a significant hurdle, requiring extensive validation and testing, which adds to product development costs and timelines. The presence of established substitutes, such as high-quality glass vials, can limit market penetration in certain niche applications where specific properties are paramount. Supply chain disruptions, raw material price volatility, and increasing competition from emerging manufacturers, particularly in Asia, pose further challenges to market stability and profitability. Ensuring consistent quality and sterility across all production batches remains a critical operational challenge for manufacturers.
Emerging Opportunities in Polyethylene Transport Vials
Emerging opportunities within the Polyethylene Transport Vials sector lie in the growing demand for sustainable and eco-friendly packaging solutions. Manufacturers can explore the development of vials made from recycled or biodegradable polyethylene, catering to the increasing environmental consciousness of end-users and regulatory bodies. The expansion of telemedicine and remote diagnostics presents an opportunity for specialized transport vials designed for home-based sample collection and secure mailing. Furthermore, the integration of smart technologies, such as RFID tags or QR codes, for enhanced traceability and inventory management in the pharmaceutical supply chain offers a promising avenue for product differentiation and value addition.
Growth Accelerators in the Polyethylene Transport Vials Industry
Several catalysts are accelerating long-term growth in the Polyethylene Transport Vials industry. Technological breakthroughs in polymer science are leading to the development of vials with improved chemical resistance, enhanced thermal stability, and superior barrier properties, enabling the safe transport of a wider range of sensitive biologics and chemicals. Strategic partnerships between vial manufacturers and pharmaceutical companies, diagnostic kit producers, and logistics providers are crucial for co-developing tailored solutions and expanding market reach. Furthermore, the increasing focus on precision medicine and the rise of biologics necessitate specialized, high-performance transport vials, creating a significant growth avenue. Market expansion strategies, including tapping into emerging economies with growing healthcare infrastructure, will also contribute to sustained growth.
Key Players Shaping the Polyethylene Transport Vials Market
- Dalton Pharma Services
- Gerresheimer
- Schott
- Stevanato Group
- West Pharmaceutical Services
- Phoenix Glass
- Pacific Vial Manufacturing
- Shandong Pharmaceutical Glass
- Anhui Huaxin Medicinal Glass Products
- Pioneer Impex
- SGD Pharma Group
- PGP Glass Company
Notable Milestones in Polyethylene Transport Vials Sector
- 2019: Increased adoption of single-use vials in pharmaceutical manufacturing for enhanced sterility and reduced cross-contamination risks.
- 2020: Significant surge in demand for diagnostic sample transport vials due to the global COVID-19 pandemic, highlighting the critical role of reliable containment.
- 2021: Introduction of advanced tamper-evident sealing technologies for polyethylene transport vials, improving supply chain security.
- 2022: Growing emphasis on sustainability leading to early-stage research into biodegradable polyethylene alternatives for transport vials.
- 2023: Development of specialized polyethylene transport vials with enhanced chemical inertness for the transportation of highly sensitive biologic drugs and gene therapies.
- 2024: Strategic partnerships between vial manufacturers and logistics companies to optimize cold-chain transportation solutions for temperature-sensitive samples.
In-Depth Polyethylene Transport Vials Market Outlook
The Polyethylene Transport Vials market is poised for continued expansion, driven by sustained innovation and an ever-growing demand for reliable sample and product containment. Growth accelerators, including advancements in material science leading to improved vial performance and the increasing adoption of sustainable packaging solutions, will shape the future landscape. Strategic partnerships and market expansion into emerging economies will further bolster growth trajectories. The market's ability to adapt to evolving regulatory requirements and the increasing complexity of pharmaceutical and diagnostic products will be key to unlocking future potential and capitalizing on emerging opportunities.
Polyethylene Transport Vials Segmentation
-
1. Application
- 1.1. Research Laboratory
- 1.2. Hospitals
- 1.3. Pharmaceutical Companies
- 1.4. Educational Institutes
- 1.5. Others
-
2. Type
- 2.1. <2ml
- 2.2. 2ml to 5ml
- 2.3. 5ml to 10ml
- 2.4. 10ml to 20ml
- 2.5. >20ml
Polyethylene Transport Vials Segmentation By Geography
-
1. North America
- 1.1. United States
- 1.2. Canada
- 1.3. Mexico
-
2. South America
- 2.1. Brazil
- 2.2. Argentina
- 2.3. Rest of South America
-
3. Europe
- 3.1. United Kingdom
- 3.2. Germany
- 3.3. France
- 3.4. Italy
- 3.5. Spain
- 3.6. Russia
- 3.7. Benelux
- 3.8. Nordics
- 3.9. Rest of Europe
-
4. Middle East & Africa
- 4.1. Turkey
- 4.2. Israel
- 4.3. GCC
- 4.4. North Africa
- 4.5. South Africa
- 4.6. Rest of Middle East & Africa
-
5. Asia Pacific
- 5.1. China
- 5.2. India
- 5.3. Japan
- 5.4. South Korea
- 5.5. ASEAN
- 5.6. Oceania
- 5.7. Rest of Asia Pacific
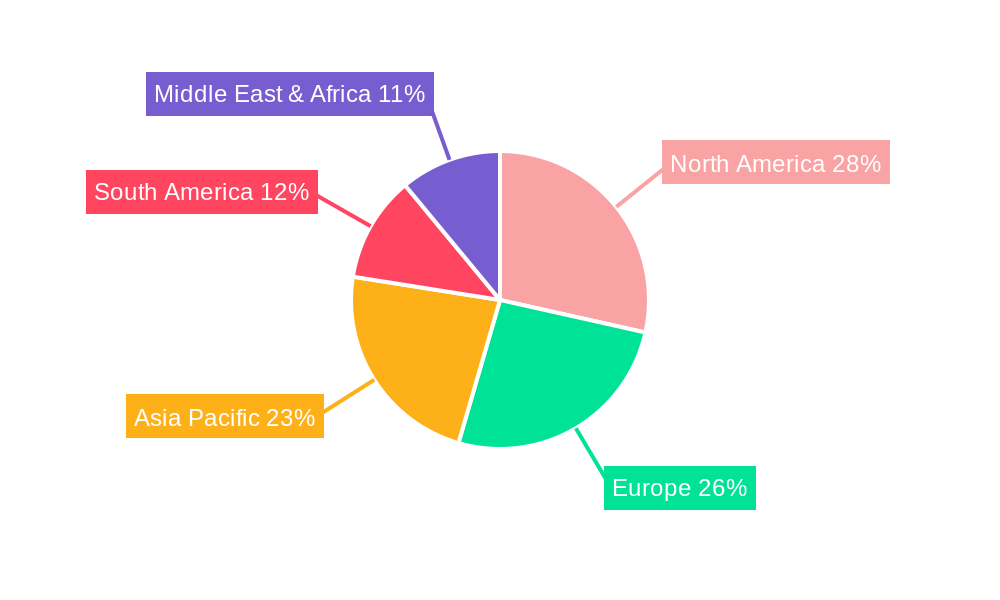
Polyethylene Transport Vials Regional Market Share
Geographic Coverage of Polyethylene Transport Vials
Polyethylene Transport Vials REPORT HIGHLIGHTS
| Aspects | Details |
|---|---|
| Study Period | 2020-2034 |
| Base Year | 2025 |
| Estimated Year | 2026 |
| Forecast Period | 2026-2034 |
| Historical Period | 2020-2025 |
| Growth Rate | CAGR of 7% from 2020-2034 |
| Segmentation |
|
Table of Contents
- 1. Introduction
- 1.1. Research Scope
- 1.2. Market Segmentation
- 1.3. Research Methodology
- 1.4. Definitions and Assumptions
- 2. Executive Summary
- 2.1. Introduction
- 3. Market Dynamics
- 3.1. Introduction
- 3.2. Market Drivers
- 3.3. Market Restrains
- 3.4. Market Trends
- 4. Market Factor Analysis
- 4.1. Porters Five Forces
- 4.2. Supply/Value Chain
- 4.3. PESTEL analysis
- 4.4. Market Entropy
- 4.5. Patent/Trademark Analysis
- 5. Global Polyethylene Transport Vials Analysis, Insights and Forecast, 2020-2032
- 5.1. Market Analysis, Insights and Forecast - by Application
- 5.1.1. Research Laboratory
- 5.1.2. Hospitals
- 5.1.3. Pharmaceutical Companies
- 5.1.4. Educational Institutes
- 5.1.5. Others
- 5.2. Market Analysis, Insights and Forecast - by Type
- 5.2.1. <2ml
- 5.2.2. 2ml to 5ml
- 5.2.3. 5ml to 10ml
- 5.2.4. 10ml to 20ml
- 5.2.5. >20ml
- 5.3. Market Analysis, Insights and Forecast - by Region
- 5.3.1. North America
- 5.3.2. South America
- 5.3.3. Europe
- 5.3.4. Middle East & Africa
- 5.3.5. Asia Pacific
- 5.1. Market Analysis, Insights and Forecast - by Application
- 6. North America Polyethylene Transport Vials Analysis, Insights and Forecast, 2020-2032
- 6.1. Market Analysis, Insights and Forecast - by Application
- 6.1.1. Research Laboratory
- 6.1.2. Hospitals
- 6.1.3. Pharmaceutical Companies
- 6.1.4. Educational Institutes
- 6.1.5. Others
- 6.2. Market Analysis, Insights and Forecast - by Type
- 6.2.1. <2ml
- 6.2.2. 2ml to 5ml
- 6.2.3. 5ml to 10ml
- 6.2.4. 10ml to 20ml
- 6.2.5. >20ml
- 6.1. Market Analysis, Insights and Forecast - by Application
- 7. South America Polyethylene Transport Vials Analysis, Insights and Forecast, 2020-2032
- 7.1. Market Analysis, Insights and Forecast - by Application
- 7.1.1. Research Laboratory
- 7.1.2. Hospitals
- 7.1.3. Pharmaceutical Companies
- 7.1.4. Educational Institutes
- 7.1.5. Others
- 7.2. Market Analysis, Insights and Forecast - by Type
- 7.2.1. <2ml
- 7.2.2. 2ml to 5ml
- 7.2.3. 5ml to 10ml
- 7.2.4. 10ml to 20ml
- 7.2.5. >20ml
- 7.1. Market Analysis, Insights and Forecast - by Application
- 8. Europe Polyethylene Transport Vials Analysis, Insights and Forecast, 2020-2032
- 8.1. Market Analysis, Insights and Forecast - by Application
- 8.1.1. Research Laboratory
- 8.1.2. Hospitals
- 8.1.3. Pharmaceutical Companies
- 8.1.4. Educational Institutes
- 8.1.5. Others
- 8.2. Market Analysis, Insights and Forecast - by Type
- 8.2.1. <2ml
- 8.2.2. 2ml to 5ml
- 8.2.3. 5ml to 10ml
- 8.2.4. 10ml to 20ml
- 8.2.5. >20ml
- 8.1. Market Analysis, Insights and Forecast - by Application
- 9. Middle East & Africa Polyethylene Transport Vials Analysis, Insights and Forecast, 2020-2032
- 9.1. Market Analysis, Insights and Forecast - by Application
- 9.1.1. Research Laboratory
- 9.1.2. Hospitals
- 9.1.3. Pharmaceutical Companies
- 9.1.4. Educational Institutes
- 9.1.5. Others
- 9.2. Market Analysis, Insights and Forecast - by Type
- 9.2.1. <2ml
- 9.2.2. 2ml to 5ml
- 9.2.3. 5ml to 10ml
- 9.2.4. 10ml to 20ml
- 9.2.5. >20ml
- 9.1. Market Analysis, Insights and Forecast - by Application
- 10. Asia Pacific Polyethylene Transport Vials Analysis, Insights and Forecast, 2020-2032
- 10.1. Market Analysis, Insights and Forecast - by Application
- 10.1.1. Research Laboratory
- 10.1.2. Hospitals
- 10.1.3. Pharmaceutical Companies
- 10.1.4. Educational Institutes
- 10.1.5. Others
- 10.2. Market Analysis, Insights and Forecast - by Type
- 10.2.1. <2ml
- 10.2.2. 2ml to 5ml
- 10.2.3. 5ml to 10ml
- 10.2.4. 10ml to 20ml
- 10.2.5. >20ml
- 10.1. Market Analysis, Insights and Forecast - by Application
- 11. Competitive Analysis
- 11.1. Global Market Share Analysis 2025
- 11.2. Company Profiles
- 11.2.1 Dalton Pharma Services
- 11.2.1.1. Overview
- 11.2.1.2. Products
- 11.2.1.3. SWOT Analysis
- 11.2.1.4. Recent Developments
- 11.2.1.5. Financials (Based on Availability)
- 11.2.2 Gerresheimer
- 11.2.2.1. Overview
- 11.2.2.2. Products
- 11.2.2.3. SWOT Analysis
- 11.2.2.4. Recent Developments
- 11.2.2.5. Financials (Based on Availability)
- 11.2.3 Schott
- 11.2.3.1. Overview
- 11.2.3.2. Products
- 11.2.3.3. SWOT Analysis
- 11.2.3.4. Recent Developments
- 11.2.3.5. Financials (Based on Availability)
- 11.2.4 Stevanato Group
- 11.2.4.1. Overview
- 11.2.4.2. Products
- 11.2.4.3. SWOT Analysis
- 11.2.4.4. Recent Developments
- 11.2.4.5. Financials (Based on Availability)
- 11.2.5 West Pharmaceutical Services
- 11.2.5.1. Overview
- 11.2.5.2. Products
- 11.2.5.3. SWOT Analysis
- 11.2.5.4. Recent Developments
- 11.2.5.5. Financials (Based on Availability)
- 11.2.6 Phoenix Glass
- 11.2.6.1. Overview
- 11.2.6.2. Products
- 11.2.6.3. SWOT Analysis
- 11.2.6.4. Recent Developments
- 11.2.6.5. Financials (Based on Availability)
- 11.2.7 Pacific Vial Manufacturing
- 11.2.7.1. Overview
- 11.2.7.2. Products
- 11.2.7.3. SWOT Analysis
- 11.2.7.4. Recent Developments
- 11.2.7.5. Financials (Based on Availability)
- 11.2.8 Shandong Pharmaceutical Glass
- 11.2.8.1. Overview
- 11.2.8.2. Products
- 11.2.8.3. SWOT Analysis
- 11.2.8.4. Recent Developments
- 11.2.8.5. Financials (Based on Availability)
- 11.2.9 Anhui Huaxin Medicinal Glass Products
- 11.2.9.1. Overview
- 11.2.9.2. Products
- 11.2.9.3. SWOT Analysis
- 11.2.9.4. Recent Developments
- 11.2.9.5. Financials (Based on Availability)
- 11.2.10 Pioneer Impex
- 11.2.10.1. Overview
- 11.2.10.2. Products
- 11.2.10.3. SWOT Analysis
- 11.2.10.4. Recent Developments
- 11.2.10.5. Financials (Based on Availability)
- 11.2.11 SGD Pharma Group
- 11.2.11.1. Overview
- 11.2.11.2. Products
- 11.2.11.3. SWOT Analysis
- 11.2.11.4. Recent Developments
- 11.2.11.5. Financials (Based on Availability)
- 11.2.12 PGP Glass Company
- 11.2.12.1. Overview
- 11.2.12.2. Products
- 11.2.12.3. SWOT Analysis
- 11.2.12.4. Recent Developments
- 11.2.12.5. Financials (Based on Availability)
- 11.2.1 Dalton Pharma Services
List of Figures
- Figure 1: Global Polyethylene Transport Vials Revenue Breakdown (undefined, %) by Region 2025 & 2033
- Figure 2: Global Polyethylene Transport Vials Volume Breakdown (K, %) by Region 2025 & 2033
- Figure 3: North America Polyethylene Transport Vials Revenue (undefined), by Application 2025 & 2033
- Figure 4: North America Polyethylene Transport Vials Volume (K), by Application 2025 & 2033
- Figure 5: North America Polyethylene Transport Vials Revenue Share (%), by Application 2025 & 2033
- Figure 6: North America Polyethylene Transport Vials Volume Share (%), by Application 2025 & 2033
- Figure 7: North America Polyethylene Transport Vials Revenue (undefined), by Type 2025 & 2033
- Figure 8: North America Polyethylene Transport Vials Volume (K), by Type 2025 & 2033
- Figure 9: North America Polyethylene Transport Vials Revenue Share (%), by Type 2025 & 2033
- Figure 10: North America Polyethylene Transport Vials Volume Share (%), by Type 2025 & 2033
- Figure 11: North America Polyethylene Transport Vials Revenue (undefined), by Country 2025 & 2033
- Figure 12: North America Polyethylene Transport Vials Volume (K), by Country 2025 & 2033
- Figure 13: North America Polyethylene Transport Vials Revenue Share (%), by Country 2025 & 2033
- Figure 14: North America Polyethylene Transport Vials Volume Share (%), by Country 2025 & 2033
- Figure 15: South America Polyethylene Transport Vials Revenue (undefined), by Application 2025 & 2033
- Figure 16: South America Polyethylene Transport Vials Volume (K), by Application 2025 & 2033
- Figure 17: South America Polyethylene Transport Vials Revenue Share (%), by Application 2025 & 2033
- Figure 18: South America Polyethylene Transport Vials Volume Share (%), by Application 2025 & 2033
- Figure 19: South America Polyethylene Transport Vials Revenue (undefined), by Type 2025 & 2033
- Figure 20: South America Polyethylene Transport Vials Volume (K), by Type 2025 & 2033
- Figure 21: South America Polyethylene Transport Vials Revenue Share (%), by Type 2025 & 2033
- Figure 22: South America Polyethylene Transport Vials Volume Share (%), by Type 2025 & 2033
- Figure 23: South America Polyethylene Transport Vials Revenue (undefined), by Country 2025 & 2033
- Figure 24: South America Polyethylene Transport Vials Volume (K), by Country 2025 & 2033
- Figure 25: South America Polyethylene Transport Vials Revenue Share (%), by Country 2025 & 2033
- Figure 26: South America Polyethylene Transport Vials Volume Share (%), by Country 2025 & 2033
- Figure 27: Europe Polyethylene Transport Vials Revenue (undefined), by Application 2025 & 2033
- Figure 28: Europe Polyethylene Transport Vials Volume (K), by Application 2025 & 2033
- Figure 29: Europe Polyethylene Transport Vials Revenue Share (%), by Application 2025 & 2033
- Figure 30: Europe Polyethylene Transport Vials Volume Share (%), by Application 2025 & 2033
- Figure 31: Europe Polyethylene Transport Vials Revenue (undefined), by Type 2025 & 2033
- Figure 32: Europe Polyethylene Transport Vials Volume (K), by Type 2025 & 2033
- Figure 33: Europe Polyethylene Transport Vials Revenue Share (%), by Type 2025 & 2033
- Figure 34: Europe Polyethylene Transport Vials Volume Share (%), by Type 2025 & 2033
- Figure 35: Europe Polyethylene Transport Vials Revenue (undefined), by Country 2025 & 2033
- Figure 36: Europe Polyethylene Transport Vials Volume (K), by Country 2025 & 2033
- Figure 37: Europe Polyethylene Transport Vials Revenue Share (%), by Country 2025 & 2033
- Figure 38: Europe Polyethylene Transport Vials Volume Share (%), by Country 2025 & 2033
- Figure 39: Middle East & Africa Polyethylene Transport Vials Revenue (undefined), by Application 2025 & 2033
- Figure 40: Middle East & Africa Polyethylene Transport Vials Volume (K), by Application 2025 & 2033
- Figure 41: Middle East & Africa Polyethylene Transport Vials Revenue Share (%), by Application 2025 & 2033
- Figure 42: Middle East & Africa Polyethylene Transport Vials Volume Share (%), by Application 2025 & 2033
- Figure 43: Middle East & Africa Polyethylene Transport Vials Revenue (undefined), by Type 2025 & 2033
- Figure 44: Middle East & Africa Polyethylene Transport Vials Volume (K), by Type 2025 & 2033
- Figure 45: Middle East & Africa Polyethylene Transport Vials Revenue Share (%), by Type 2025 & 2033
- Figure 46: Middle East & Africa Polyethylene Transport Vials Volume Share (%), by Type 2025 & 2033
- Figure 47: Middle East & Africa Polyethylene Transport Vials Revenue (undefined), by Country 2025 & 2033
- Figure 48: Middle East & Africa Polyethylene Transport Vials Volume (K), by Country 2025 & 2033
- Figure 49: Middle East & Africa Polyethylene Transport Vials Revenue Share (%), by Country 2025 & 2033
- Figure 50: Middle East & Africa Polyethylene Transport Vials Volume Share (%), by Country 2025 & 2033
- Figure 51: Asia Pacific Polyethylene Transport Vials Revenue (undefined), by Application 2025 & 2033
- Figure 52: Asia Pacific Polyethylene Transport Vials Volume (K), by Application 2025 & 2033
- Figure 53: Asia Pacific Polyethylene Transport Vials Revenue Share (%), by Application 2025 & 2033
- Figure 54: Asia Pacific Polyethylene Transport Vials Volume Share (%), by Application 2025 & 2033
- Figure 55: Asia Pacific Polyethylene Transport Vials Revenue (undefined), by Type 2025 & 2033
- Figure 56: Asia Pacific Polyethylene Transport Vials Volume (K), by Type 2025 & 2033
- Figure 57: Asia Pacific Polyethylene Transport Vials Revenue Share (%), by Type 2025 & 2033
- Figure 58: Asia Pacific Polyethylene Transport Vials Volume Share (%), by Type 2025 & 2033
- Figure 59: Asia Pacific Polyethylene Transport Vials Revenue (undefined), by Country 2025 & 2033
- Figure 60: Asia Pacific Polyethylene Transport Vials Volume (K), by Country 2025 & 2033
- Figure 61: Asia Pacific Polyethylene Transport Vials Revenue Share (%), by Country 2025 & 2033
- Figure 62: Asia Pacific Polyethylene Transport Vials Volume Share (%), by Country 2025 & 2033
List of Tables
- Table 1: Global Polyethylene Transport Vials Revenue undefined Forecast, by Application 2020 & 2033
- Table 2: Global Polyethylene Transport Vials Volume K Forecast, by Application 2020 & 2033
- Table 3: Global Polyethylene Transport Vials Revenue undefined Forecast, by Type 2020 & 2033
- Table 4: Global Polyethylene Transport Vials Volume K Forecast, by Type 2020 & 2033
- Table 5: Global Polyethylene Transport Vials Revenue undefined Forecast, by Region 2020 & 2033
- Table 6: Global Polyethylene Transport Vials Volume K Forecast, by Region 2020 & 2033
- Table 7: Global Polyethylene Transport Vials Revenue undefined Forecast, by Application 2020 & 2033
- Table 8: Global Polyethylene Transport Vials Volume K Forecast, by Application 2020 & 2033
- Table 9: Global Polyethylene Transport Vials Revenue undefined Forecast, by Type 2020 & 2033
- Table 10: Global Polyethylene Transport Vials Volume K Forecast, by Type 2020 & 2033
- Table 11: Global Polyethylene Transport Vials Revenue undefined Forecast, by Country 2020 & 2033
- Table 12: Global Polyethylene Transport Vials Volume K Forecast, by Country 2020 & 2033
- Table 13: United States Polyethylene Transport Vials Revenue (undefined) Forecast, by Application 2020 & 2033
- Table 14: United States Polyethylene Transport Vials Volume (K) Forecast, by Application 2020 & 2033
- Table 15: Canada Polyethylene Transport Vials Revenue (undefined) Forecast, by Application 2020 & 2033
- Table 16: Canada Polyethylene Transport Vials Volume (K) Forecast, by Application 2020 & 2033
- Table 17: Mexico Polyethylene Transport Vials Revenue (undefined) Forecast, by Application 2020 & 2033
- Table 18: Mexico Polyethylene Transport Vials Volume (K) Forecast, by Application 2020 & 2033
- Table 19: Global Polyethylene Transport Vials Revenue undefined Forecast, by Application 2020 & 2033
- Table 20: Global Polyethylene Transport Vials Volume K Forecast, by Application 2020 & 2033
- Table 21: Global Polyethylene Transport Vials Revenue undefined Forecast, by Type 2020 & 2033
- Table 22: Global Polyethylene Transport Vials Volume K Forecast, by Type 2020 & 2033
- Table 23: Global Polyethylene Transport Vials Revenue undefined Forecast, by Country 2020 & 2033
- Table 24: Global Polyethylene Transport Vials Volume K Forecast, by Country 2020 & 2033
- Table 25: Brazil Polyethylene Transport Vials Revenue (undefined) Forecast, by Application 2020 & 2033
- Table 26: Brazil Polyethylene Transport Vials Volume (K) Forecast, by Application 2020 & 2033
- Table 27: Argentina Polyethylene Transport Vials Revenue (undefined) Forecast, by Application 2020 & 2033
- Table 28: Argentina Polyethylene Transport Vials Volume (K) Forecast, by Application 2020 & 2033
- Table 29: Rest of South America Polyethylene Transport Vials Revenue (undefined) Forecast, by Application 2020 & 2033
- Table 30: Rest of South America Polyethylene Transport Vials Volume (K) Forecast, by Application 2020 & 2033
- Table 31: Global Polyethylene Transport Vials Revenue undefined Forecast, by Application 2020 & 2033
- Table 32: Global Polyethylene Transport Vials Volume K Forecast, by Application 2020 & 2033
- Table 33: Global Polyethylene Transport Vials Revenue undefined Forecast, by Type 2020 & 2033
- Table 34: Global Polyethylene Transport Vials Volume K Forecast, by Type 2020 & 2033
- Table 35: Global Polyethylene Transport Vials Revenue undefined Forecast, by Country 2020 & 2033
- Table 36: Global Polyethylene Transport Vials Volume K Forecast, by Country 2020 & 2033
- Table 37: United Kingdom Polyethylene Transport Vials Revenue (undefined) Forecast, by Application 2020 & 2033
- Table 38: United Kingdom Polyethylene Transport Vials Volume (K) Forecast, by Application 2020 & 2033
- Table 39: Germany Polyethylene Transport Vials Revenue (undefined) Forecast, by Application 2020 & 2033
- Table 40: Germany Polyethylene Transport Vials Volume (K) Forecast, by Application 2020 & 2033
- Table 41: France Polyethylene Transport Vials Revenue (undefined) Forecast, by Application 2020 & 2033
- Table 42: France Polyethylene Transport Vials Volume (K) Forecast, by Application 2020 & 2033
- Table 43: Italy Polyethylene Transport Vials Revenue (undefined) Forecast, by Application 2020 & 2033
- Table 44: Italy Polyethylene Transport Vials Volume (K) Forecast, by Application 2020 & 2033
- Table 45: Spain Polyethylene Transport Vials Revenue (undefined) Forecast, by Application 2020 & 2033
- Table 46: Spain Polyethylene Transport Vials Volume (K) Forecast, by Application 2020 & 2033
- Table 47: Russia Polyethylene Transport Vials Revenue (undefined) Forecast, by Application 2020 & 2033
- Table 48: Russia Polyethylene Transport Vials Volume (K) Forecast, by Application 2020 & 2033
- Table 49: Benelux Polyethylene Transport Vials Revenue (undefined) Forecast, by Application 2020 & 2033
- Table 50: Benelux Polyethylene Transport Vials Volume (K) Forecast, by Application 2020 & 2033
- Table 51: Nordics Polyethylene Transport Vials Revenue (undefined) Forecast, by Application 2020 & 2033
- Table 52: Nordics Polyethylene Transport Vials Volume (K) Forecast, by Application 2020 & 2033
- Table 53: Rest of Europe Polyethylene Transport Vials Revenue (undefined) Forecast, by Application 2020 & 2033
- Table 54: Rest of Europe Polyethylene Transport Vials Volume (K) Forecast, by Application 2020 & 2033
- Table 55: Global Polyethylene Transport Vials Revenue undefined Forecast, by Application 2020 & 2033
- Table 56: Global Polyethylene Transport Vials Volume K Forecast, by Application 2020 & 2033
- Table 57: Global Polyethylene Transport Vials Revenue undefined Forecast, by Type 2020 & 2033
- Table 58: Global Polyethylene Transport Vials Volume K Forecast, by Type 2020 & 2033
- Table 59: Global Polyethylene Transport Vials Revenue undefined Forecast, by Country 2020 & 2033
- Table 60: Global Polyethylene Transport Vials Volume K Forecast, by Country 2020 & 2033
- Table 61: Turkey Polyethylene Transport Vials Revenue (undefined) Forecast, by Application 2020 & 2033
- Table 62: Turkey Polyethylene Transport Vials Volume (K) Forecast, by Application 2020 & 2033
- Table 63: Israel Polyethylene Transport Vials Revenue (undefined) Forecast, by Application 2020 & 2033
- Table 64: Israel Polyethylene Transport Vials Volume (K) Forecast, by Application 2020 & 2033
- Table 65: GCC Polyethylene Transport Vials Revenue (undefined) Forecast, by Application 2020 & 2033
- Table 66: GCC Polyethylene Transport Vials Volume (K) Forecast, by Application 2020 & 2033
- Table 67: North Africa Polyethylene Transport Vials Revenue (undefined) Forecast, by Application 2020 & 2033
- Table 68: North Africa Polyethylene Transport Vials Volume (K) Forecast, by Application 2020 & 2033
- Table 69: South Africa Polyethylene Transport Vials Revenue (undefined) Forecast, by Application 2020 & 2033
- Table 70: South Africa Polyethylene Transport Vials Volume (K) Forecast, by Application 2020 & 2033
- Table 71: Rest of Middle East & Africa Polyethylene Transport Vials Revenue (undefined) Forecast, by Application 2020 & 2033
- Table 72: Rest of Middle East & Africa Polyethylene Transport Vials Volume (K) Forecast, by Application 2020 & 2033
- Table 73: Global Polyethylene Transport Vials Revenue undefined Forecast, by Application 2020 & 2033
- Table 74: Global Polyethylene Transport Vials Volume K Forecast, by Application 2020 & 2033
- Table 75: Global Polyethylene Transport Vials Revenue undefined Forecast, by Type 2020 & 2033
- Table 76: Global Polyethylene Transport Vials Volume K Forecast, by Type 2020 & 2033
- Table 77: Global Polyethylene Transport Vials Revenue undefined Forecast, by Country 2020 & 2033
- Table 78: Global Polyethylene Transport Vials Volume K Forecast, by Country 2020 & 2033
- Table 79: China Polyethylene Transport Vials Revenue (undefined) Forecast, by Application 2020 & 2033
- Table 80: China Polyethylene Transport Vials Volume (K) Forecast, by Application 2020 & 2033
- Table 81: India Polyethylene Transport Vials Revenue (undefined) Forecast, by Application 2020 & 2033
- Table 82: India Polyethylene Transport Vials Volume (K) Forecast, by Application 2020 & 2033
- Table 83: Japan Polyethylene Transport Vials Revenue (undefined) Forecast, by Application 2020 & 2033
- Table 84: Japan Polyethylene Transport Vials Volume (K) Forecast, by Application 2020 & 2033
- Table 85: South Korea Polyethylene Transport Vials Revenue (undefined) Forecast, by Application 2020 & 2033
- Table 86: South Korea Polyethylene Transport Vials Volume (K) Forecast, by Application 2020 & 2033
- Table 87: ASEAN Polyethylene Transport Vials Revenue (undefined) Forecast, by Application 2020 & 2033
- Table 88: ASEAN Polyethylene Transport Vials Volume (K) Forecast, by Application 2020 & 2033
- Table 89: Oceania Polyethylene Transport Vials Revenue (undefined) Forecast, by Application 2020 & 2033
- Table 90: Oceania Polyethylene Transport Vials Volume (K) Forecast, by Application 2020 & 2033
- Table 91: Rest of Asia Pacific Polyethylene Transport Vials Revenue (undefined) Forecast, by Application 2020 & 2033
- Table 92: Rest of Asia Pacific Polyethylene Transport Vials Volume (K) Forecast, by Application 2020 & 2033
Frequently Asked Questions
1. What is the projected Compound Annual Growth Rate (CAGR) of the Polyethylene Transport Vials?
The projected CAGR is approximately 7%.
2. Which companies are prominent players in the Polyethylene Transport Vials?
Key companies in the market include Dalton Pharma Services, Gerresheimer, Schott, Stevanato Group, West Pharmaceutical Services, Phoenix Glass, Pacific Vial Manufacturing, Shandong Pharmaceutical Glass, Anhui Huaxin Medicinal Glass Products, Pioneer Impex, SGD Pharma Group, PGP Glass Company.
3. What are the main segments of the Polyethylene Transport Vials?
The market segments include Application, Type.
4. Can you provide details about the market size?
The market size is estimated to be USD XXX N/A as of 2022.
5. What are some drivers contributing to market growth?
N/A
6. What are the notable trends driving market growth?
N/A
7. Are there any restraints impacting market growth?
N/A
8. Can you provide examples of recent developments in the market?
N/A
9. What pricing options are available for accessing the report?
Pricing options include single-user, multi-user, and enterprise licenses priced at USD 3950.00, USD 5925.00, and USD 7900.00 respectively.
10. Is the market size provided in terms of value or volume?
The market size is provided in terms of value, measured in N/A and volume, measured in K.
11. Are there any specific market keywords associated with the report?
Yes, the market keyword associated with the report is "Polyethylene Transport Vials," which aids in identifying and referencing the specific market segment covered.
12. How do I determine which pricing option suits my needs best?
The pricing options vary based on user requirements and access needs. Individual users may opt for single-user licenses, while businesses requiring broader access may choose multi-user or enterprise licenses for cost-effective access to the report.
13. Are there any additional resources or data provided in the Polyethylene Transport Vials report?
While the report offers comprehensive insights, it's advisable to review the specific contents or supplementary materials provided to ascertain if additional resources or data are available.
14. How can I stay updated on further developments or reports in the Polyethylene Transport Vials?
To stay informed about further developments, trends, and reports in the Polyethylene Transport Vials, consider subscribing to industry newsletters, following relevant companies and organizations, or regularly checking reputable industry news sources and publications.
Methodology
Step 1 - Identification of Relevant Samples Size from Population Database


Step 2 - Approaches for Defining Global Market Size (Value, Volume* & Price*)

Note*: In applicable scenarios
Step 3 - Data Sources
Primary Research
- Web Analytics
- Survey Reports
- Research Institute
- Latest Research Reports
- Opinion Leaders
Secondary Research
- Annual Reports
- White Paper
- Latest Press Release
- Industry Association
- Paid Database
- Investor Presentations

Step 4 - Data Triangulation
Involves using different sources of information in order to increase the validity of a study
These sources are likely to be stakeholders in a program - participants, other researchers, program staff, other community members, and so on.
Then we put all data in single framework & apply various statistical tools to find out the dynamic on the market.
During the analysis stage, feedback from the stakeholder groups would be compared to determine areas of agreement as well as areas of divergence