

Key Insights
The global Power Transistors market is set for substantial growth, with an estimated market size of $15.82 billion by 2024, exhibiting a Compound Annual Growth Rate (CAGR) of 8.15%. This expansion is driven by the increasing demand for energy-efficient electronics across diverse industries. Key growth catalysts include the accelerating adoption of electric and hybrid electric vehicles requiring advanced power management, the widespread deployment of 5G infrastructure, continuous innovation in renewable energy sources, and the persistent need for smarter consumer electronics. Industrial automation's focus on efficient power control also presents significant opportunities.
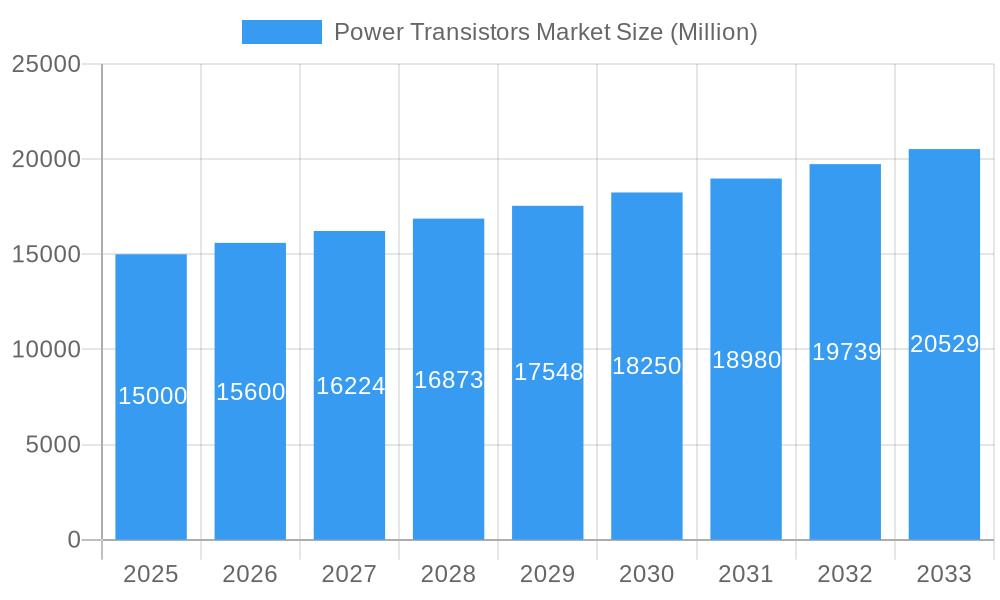
Power Transistors Market Market Size (In Billion)
The market features prominent segments like High Electron Mobility Transistors (HEMTs) and Field Effect Transistors (FETs), recognized for their superior performance in high-speed switching and low on-resistance, crucial for modern power efficiency demands. The integration of wide-bandgap semiconductor materials, such as Silicon Carbide (SiC) and Gallium Nitride (GaN), is enhancing power transistor capabilities for higher voltage and temperature operations with reduced energy loss. While growth is robust, high advanced semiconductor manufacturing costs and the necessity for ongoing R&D pose strategic considerations for market participants.
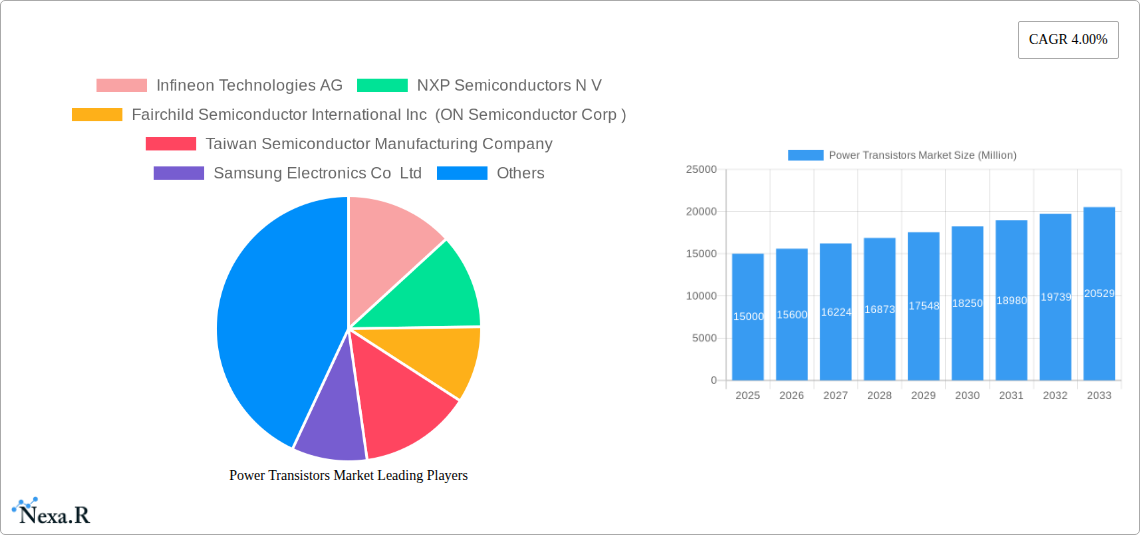
Power Transistors Market Company Market Share
This comprehensive report offers a definitive analysis of the global Power Transistors Market, projecting its trajectory from 2019 to 2033. It delivers granular insights into market dynamics, growth trends, regional influence, product innovation, and strategic opportunities, examining both parent and child markets for a holistic view. With a base year of 2024 and historical data from 2019-2024, the forecast period extends to 2033, providing essential intelligence for industry professionals, investors, and researchers.
Power Transistors Market Dynamics & Structure
The Power Transistors Market is characterized by moderate to high concentration, with a few key players holding significant market share. Technological innovation remains a primary driver, particularly in the development of high-performance materials like Gallium Nitride (GaN) and Silicon Carbide (SiC), which offer superior efficiency and power density over traditional silicon. Regulatory frameworks, especially concerning energy efficiency and emissions, indirectly influence demand by promoting the adoption of advanced power electronics. Competitive product substitutes are evolving rapidly, with ongoing advancements in power semiconductor technologies offering alternatives to existing solutions. End-user demographics are shifting, with increasing demand from industrial automation, electric vehicles, and renewable energy sectors. Mergers and acquisitions (M&A) trends, though not as frequent as in some other tech sectors, are strategic, aimed at consolidating market position and acquiring specialized technologies. For instance, in 2022, the market witnessed strategic acquisitions focused on enhancing GaN and SiC capabilities. Innovation barriers include the high cost of R&D for next-generation materials and the long qualification cycles for mission-critical applications in sectors like aerospace and automotive.
- Market Concentration: Dominated by key semiconductor manufacturers.
- Technological Innovation Drivers: GaN, SiC advancements, miniaturization.
- Regulatory Frameworks: Energy efficiency standards, emissions regulations.
- Competitive Product Substitutes: Continuous improvement in power semiconductor performance.
- End-User Demographics: Growing demand from EV, industrial, and renewable sectors.
- M&A Trends: Strategic acquisitions for technology and market expansion.
Power Transistors Market Growth Trends & Insights
The Power Transistors Market is poised for robust expansion, driven by an insatiable global demand for energy-efficient and high-performance power solutions. The market size is projected to witness a significant Compound Annual Growth Rate (CAGR) of approximately 8.5% during the forecast period. Adoption rates for advanced technologies, particularly GaN and SiC transistors, are accelerating across various end-user industries. These wide-bandgap semiconductors are enabling smaller, lighter, and more efficient power conversion systems, crucial for meeting the stringent performance requirements of modern electronics. Technological disruptions are a constant feature, with ongoing research and development yielding transistors with higher breakdown voltages, lower on-resistance, and improved thermal management capabilities.
Consumer behavior shifts are also playing a pivotal role. The increasing consumer awareness of energy consumption and environmental impact is pushing manufacturers to develop more sustainable products, which in turn drives the demand for efficient power components. The electrification of transportation, coupled with the expansion of renewable energy infrastructure, are monumental growth engines for the power transistors market. Furthermore, the proliferation of 5G networks and the continuous evolution of consumer electronics, from smart home devices to high-performance computing, necessitate advanced power management solutions that power transistors are uniquely positioned to provide. The increasing complexity and power requirements of data centers also contribute significantly to market growth. The global market value is estimated to reach approximately $18,500 million units by 2025, with substantial growth expected in the subsequent years.
- Market Size Evolution: Projected significant growth driven by energy efficiency needs.
- Adoption Rates: Rapid adoption of GaN and SiC technologies.
- Technological Disruptions: Continuous innovation in material science and device architecture.
- Consumer Behavior Shifts: Demand for energy-efficient and sustainable products.
- Key Growth Drivers: Electrification of vehicles, renewable energy, 5G, consumer electronics, data centers.
Dominant Regions, Countries, or Segments in Power Transistors Market
The Field Effect Transistors (FET) segment, particularly MOSFETs and emerging GaN-FETs, is a dominant force within the broader Power Transistors Market. This dominance stems from their inherent advantages in switching speed, efficiency, and ease of integration across a wide spectrum of applications. Within the FET category, eGaN (Enhancement mode Gallium Nitride) transistors are experiencing exceptional growth, driven by their ability to outperform silicon-based counterparts in terms of power density and efficiency, making them indispensable for high-frequency and high-power applications.
The Industrial end-user industry stands out as a primary growth driver for power transistors. This segment encompasses a diverse range of applications, including motor drives, industrial automation, power supplies for manufacturing equipment, and renewable energy inverters. The ongoing trend towards industrial automation and smart manufacturing, fueled by Industry 4.0 initiatives, necessitates advanced and reliable power components for efficient operation. Furthermore, the global push for decarbonization and the expansion of renewable energy sources like solar and wind power are creating massive demand for power transistors used in inverters and grid-connected systems. The robust infrastructure development in emerging economies and the retrofitting of existing industrial facilities with more energy-efficient technologies further bolster demand.
Asia Pacific is the leading region in the Power Transistors Market, propelled by its position as a global manufacturing hub for electronics and its significant investments in infrastructure and renewable energy projects. Countries like China, South Korea, and Taiwan are at the forefront of both production and consumption of power transistors. The region's rapidly growing automotive sector, with a strong focus on electric vehicle (EV) production, is a major catalyst for demand.
- Dominant Segment (Type): Field Effect Transistors (FET), with a notable surge in eGaN.
- Dominant End User Industry: Industrial applications, including automation and renewable energy.
- Key Regional Dominance: Asia Pacific, driven by manufacturing, EVs, and infrastructure.
- Market Share Insights: FETs hold a substantial market share due to versatility and performance.
- Growth Potential: High growth potential in industrial automation and renewable energy sectors.
- Economic Policies: Government incentives for clean energy and advanced manufacturing in Asia Pacific.
Power Transistors Market Product Landscape
The Power Transistors Market is characterized by continuous product innovation focused on enhancing performance metrics like voltage rating, current handling capability, switching speed, and thermal management. Key advancements include the development of ultra-low on-resistance (RDS(on)) transistors and the integration of higher breakdown voltages, enabling more compact and efficient power solutions. Gallium Nitride (GaN) and Silicon Carbide (SiC) technologies are at the forefront, offering superior performance over traditional silicon in applications demanding higher power density and efficiency. For instance, the development of compact 350 V GaN transistors significantly reduces the size of power conversion solutions. Applications span across consumer electronics, industrial automation, telecommunications infrastructure, and aerospace & defense, with new use cases emerging constantly as technology evolves.
Key Drivers, Barriers & Challenges in Power Transistors Market
The Key Drivers propelling the Power Transistors Market are primarily technological advancements, particularly the adoption of wide-bandgap materials like GaN and SiC, which offer superior efficiency and performance. The accelerating global trend towards electrification of transportation, coupled with the expansion of renewable energy infrastructure and the demand for energy-efficient consumer electronics and industrial equipment, are monumental growth catalysts. Government initiatives promoting energy efficiency and carbon emission reduction further fuel market expansion.
Conversely, Barriers and Challenges include the relatively high cost of GaN and SiC technologies compared to traditional silicon, which can limit their adoption in price-sensitive applications. The complex manufacturing processes and supply chain dependencies for these advanced materials also pose challenges. Furthermore, stringent reliability and qualification requirements in critical sectors like automotive and aerospace can lengthen product development cycles. Supply chain disruptions, as experienced in recent years, can impact production volumes and lead times. Intense competition among established players and emerging startups also presents a constant challenge.
Emerging Opportunities in Power Transistors Market
Emerging opportunities within the Power Transistors Market are abundant, driven by the relentless pursuit of greater energy efficiency and higher performance. The rapidly expanding electric vehicle (EV) market represents a significant untapped potential, with increasing demand for efficient onboard chargers, DC-DC converters, and inverter systems. The growth of 5G infrastructure, requiring high-frequency and high-power RF transistors, also presents a substantial opportunity. Furthermore, the development of advanced battery management systems for everything from portable electronics to grid-scale energy storage solutions necessitates sophisticated power transistor technologies. The burgeoning Internet of Things (IoT) ecosystem, with its myriad of low-power devices, also creates a demand for miniature, highly efficient power management components.
Growth Accelerators in the Power Transistors Market Industry
Several key catalysts are accelerating the growth trajectory of the Power Transistors Market. Technological breakthroughs in material science, leading to improved performance and cost-effectiveness of GaN and SiC devices, are paramount. Strategic partnerships between semiconductor manufacturers and system integrators are crucial for co-optimizing designs and accelerating product development for specific applications. Market expansion strategies, particularly by focusing on emerging economies and underserved niche markets, will drive increased adoption. The ongoing miniaturization trend across all electronic devices also acts as a significant growth accelerator, pushing the demand for smaller, yet more powerful, transistor solutions.
Key Players Shaping the Power Transistors Market Market
- Infineon Technologies AG
- NXP Semiconductors N V
- Fairchild Semiconductor International Inc (ON Semiconductor Corp)
- Taiwan Semiconductor Manufacturing Company
- Samsung Electronics Co Ltd
- Microchip Technology Inc
- STMicroelectronics N V
- GLOBALFOUNDRIES Inc
- Texas Instruments Incorporated
- Intel Corporation
Notable Milestones in Power Transistors Market Sector
- September 2022: EPC Power Conversion Corporation announced the EPC2050, a 350 V GaN transistor with a maximum RDS(on) of 80 mΩ and a pulsed output current of 26 A. The EPC2050 measures only 1.95 mm x 1.95 mm, making EPC2050-based solutions ten times smaller than solutions using equivalent silicon devices.
- July 2022: Magnachip Semiconductor Corporation announced the unveiling of a new 24V Metal-Oxide-Semiconductor Field-Effect Transistor (MOSFET) for wireless earphone batteries. The new 24V MOSFET addresses the goal of battery designers for extended battery life after a quick charge by reducing conduction loss. The core cell density of this new product has been increased by 30% compared to the previous version, while the design of the core cell, termination, and source pads has been enhanced to reduce the RDS(on) by 24%.
- March 2022: NXP Semiconductors announced new RF GaN power transistors for 32T32R active antenna systems using its most delinquent proprietary gallium nitride (GaN) technology. The unique series complements NXP's existing portfolio of discrete GaN power amplifier solutions for 64T64R radios, protecting all cellular frequency bands from 2.3GHz to 4.0GHz.
In-Depth Power Transistors Market Market Outlook
The Power Transistors Market is set for sustained and significant growth in the coming years, driven by megatrends such as electrification, digitalization, and sustainability. The continuous innovation in GaN and SiC technologies will unlock new possibilities for power conversion systems, enabling greater energy efficiency and higher performance across a multitude of applications. Strategic investments in R&D, coupled with collaborations across the value chain, will be crucial for overcoming existing challenges and capitalizing on emerging opportunities. The market's future potential lies in its ability to support the global transition to cleaner energy sources, enable more intelligent and connected devices, and drive advancements in high-performance computing and telecommunications.
Power Transistors Market Segmentation
-
1. Type
- 1.1. High Electron Mobility Transistor (HEMT)
- 1.2. Bipolar Junction Transistor (BJT)
- 1.3. Field Effect Transistors (FET)
- 1.4. Multiple Emitter Transistor (MET)
- 1.5. Dual Gat
-
2. End User Industry
- 2.1. Aerospace & Defense
- 2.2. Industrial
- 2.3. Telecommunications
- 2.4. Consumer Electronics
Power Transistors Market Segmentation By Geography
- 1. North America
- 2. Europe
- 3. Asia Pacific
- 4. Latin America
- 5. Middle East
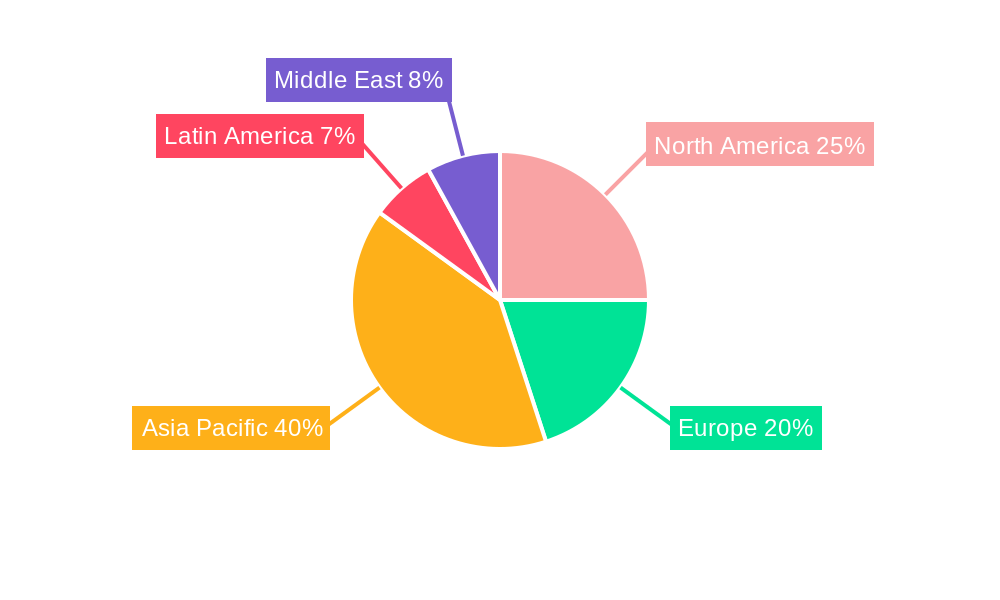
Power Transistors Market Regional Market Share
Geographic Coverage of Power Transistors Market
Power Transistors Market REPORT HIGHLIGHTS
| Aspects | Details |
|---|---|
| Study Period | 2020-2034 |
| Base Year | 2025 |
| Estimated Year | 2026 |
| Forecast Period | 2026-2034 |
| Historical Period | 2020-2025 |
| Growth Rate | CAGR of 8.15% from 2020-2034 |
| Segmentation |
|
Table of Contents
- 1. Introduction
- 1.1. Research Scope
- 1.2. Market Segmentation
- 1.3. Research Objective
- 1.4. Definitions and Assumptions
- 2. Executive Summary
- 2.1. Market Snapshot
- 3. Market Dynamics
- 3.1. Market Drivers
- 3.2. Market Restrains
- 3.3. Market Trends
- 3.4. Market Opportunities
- 4. Market Factor Analysis
- 4.1. Porters Five Forces
- 4.1.1. Bargaining Power of Suppliers
- 4.1.2. Bargaining Power of Buyers
- 4.1.3. Threat of New Entrants
- 4.1.4. Threat of Substitutes
- 4.1.5. Competitive Rivalry
- 4.2. PESTEL analysis
- 4.3. BCG Analysis
- 4.3.1. Stars (High Growth, High Market Share)
- 4.3.2. Cash Cows (Low Growth, High Market Share)
- 4.3.3. Question Mark (High Growth, Low Market Share)
- 4.3.4. Dogs (Low Growth, Low Market Share)
- 4.4. Ansoff Matrix Analysis
- 4.5. Supply Chain Analysis
- 4.6. Regulatory Landscape
- 4.7. Current Market Potential and Opportunity Assessment (TAM–SAM–SOM Framework)
- 4.8. NRP Analyst Note
- 4.1. Porters Five Forces
- 5. Market Analysis, Insights and Forecast 2021-2033
- 5.1. Market Analysis, Insights and Forecast - by Type
- 5.1.1. High Electron Mobility Transistor (HEMT)
- 5.1.2. Bipolar Junction Transistor (BJT)
- 5.1.3. Field Effect Transistors (FET)
- 5.1.4. Multiple Emitter Transistor (MET)
- 5.1.5. Dual Gat
- 5.2. Market Analysis, Insights and Forecast - by End User Industry
- 5.2.1. Aerospace & Defense
- 5.2.2. Industrial
- 5.2.3. Telecommunications
- 5.2.4. Consumer Electronics
- 5.3. Market Analysis, Insights and Forecast - by Region
- 5.3.1. North America
- 5.3.2. Europe
- 5.3.3. Asia Pacific
- 5.3.4. Latin America
- 5.3.5. Middle East
- 5.1. Market Analysis, Insights and Forecast - by Type
- 6. Global Power Transistors Market Analysis, Insights and Forecast, 2021-2033
- 6.1. Market Analysis, Insights and Forecast - by Type
- 6.1.1. High Electron Mobility Transistor (HEMT)
- 6.1.2. Bipolar Junction Transistor (BJT)
- 6.1.3. Field Effect Transistors (FET)
- 6.1.4. Multiple Emitter Transistor (MET)
- 6.1.5. Dual Gat
- 6.2. Market Analysis, Insights and Forecast - by End User Industry
- 6.2.1. Aerospace & Defense
- 6.2.2. Industrial
- 6.2.3. Telecommunications
- 6.2.4. Consumer Electronics
- 6.1. Market Analysis, Insights and Forecast - by Type
- 7. North America Power Transistors Market Analysis, Insights and Forecast, 2020-2032
- 7.1. Market Analysis, Insights and Forecast - by Type
- 7.1.1. High Electron Mobility Transistor (HEMT)
- 7.1.2. Bipolar Junction Transistor (BJT)
- 7.1.3. Field Effect Transistors (FET)
- 7.1.4. Multiple Emitter Transistor (MET)
- 7.1.5. Dual Gat
- 7.2. Market Analysis, Insights and Forecast - by End User Industry
- 7.2.1. Aerospace & Defense
- 7.2.2. Industrial
- 7.2.3. Telecommunications
- 7.2.4. Consumer Electronics
- 7.1. Market Analysis, Insights and Forecast - by Type
- 8. Europe Power Transistors Market Analysis, Insights and Forecast, 2020-2032
- 8.1. Market Analysis, Insights and Forecast - by Type
- 8.1.1. High Electron Mobility Transistor (HEMT)
- 8.1.2. Bipolar Junction Transistor (BJT)
- 8.1.3. Field Effect Transistors (FET)
- 8.1.4. Multiple Emitter Transistor (MET)
- 8.1.5. Dual Gat
- 8.2. Market Analysis, Insights and Forecast - by End User Industry
- 8.2.1. Aerospace & Defense
- 8.2.2. Industrial
- 8.2.3. Telecommunications
- 8.2.4. Consumer Electronics
- 8.1. Market Analysis, Insights and Forecast - by Type
- 9. Asia Pacific Power Transistors Market Analysis, Insights and Forecast, 2020-2032
- 9.1. Market Analysis, Insights and Forecast - by Type
- 9.1.1. High Electron Mobility Transistor (HEMT)
- 9.1.2. Bipolar Junction Transistor (BJT)
- 9.1.3. Field Effect Transistors (FET)
- 9.1.4. Multiple Emitter Transistor (MET)
- 9.1.5. Dual Gat
- 9.2. Market Analysis, Insights and Forecast - by End User Industry
- 9.2.1. Aerospace & Defense
- 9.2.2. Industrial
- 9.2.3. Telecommunications
- 9.2.4. Consumer Electronics
- 9.1. Market Analysis, Insights and Forecast - by Type
- 10. Latin America Power Transistors Market Analysis, Insights and Forecast, 2020-2032
- 10.1. Market Analysis, Insights and Forecast - by Type
- 10.1.1. High Electron Mobility Transistor (HEMT)
- 10.1.2. Bipolar Junction Transistor (BJT)
- 10.1.3. Field Effect Transistors (FET)
- 10.1.4. Multiple Emitter Transistor (MET)
- 10.1.5. Dual Gat
- 10.2. Market Analysis, Insights and Forecast - by End User Industry
- 10.2.1. Aerospace & Defense
- 10.2.2. Industrial
- 10.2.3. Telecommunications
- 10.2.4. Consumer Electronics
- 10.1. Market Analysis, Insights and Forecast - by Type
- 11. Middle East Power Transistors Market Analysis, Insights and Forecast, 2020-2032
- 11.1. Market Analysis, Insights and Forecast - by Type
- 11.1.1. High Electron Mobility Transistor (HEMT)
- 11.1.2. Bipolar Junction Transistor (BJT)
- 11.1.3. Field Effect Transistors (FET)
- 11.1.4. Multiple Emitter Transistor (MET)
- 11.1.5. Dual Gat
- 11.2. Market Analysis, Insights and Forecast - by End User Industry
- 11.2.1. Aerospace & Defense
- 11.2.2. Industrial
- 11.2.3. Telecommunications
- 11.2.4. Consumer Electronics
- 11.1. Market Analysis, Insights and Forecast - by Type
- 12. Competitive Analysis
- 12.1. Company Profiles
- 12.1.1 Infineon Technologies AG
- 12.1.1.1. Company Overview
- 12.1.1.2. Products
- 12.1.1.3. Company Financials
- 12.1.1.4. SWOT Analysis
- 12.1.2 NXP Semiconductors N V
- 12.1.2.1. Company Overview
- 12.1.2.2. Products
- 12.1.2.3. Company Financials
- 12.1.2.4. SWOT Analysis
- 12.1.3 Fairchild Semiconductor International Inc (ON Semiconductor Corp )
- 12.1.3.1. Company Overview
- 12.1.3.2. Products
- 12.1.3.3. Company Financials
- 12.1.3.4. SWOT Analysis
- 12.1.4 Taiwan Semiconductor Manufacturing Company
- 12.1.4.1. Company Overview
- 12.1.4.2. Products
- 12.1.4.3. Company Financials
- 12.1.4.4. SWOT Analysis
- 12.1.5 Samsung Electronics Co Ltd
- 12.1.5.1. Company Overview
- 12.1.5.2. Products
- 12.1.5.3. Company Financials
- 12.1.5.4. SWOT Analysis
- 12.1.6 Microchip Technology Inc *List Not Exhaustive
- 12.1.6.1. Company Overview
- 12.1.6.2. Products
- 12.1.6.3. Company Financials
- 12.1.6.4. SWOT Analysis
- 12.1.7 STMicroelectronics N V
- 12.1.7.1. Company Overview
- 12.1.7.2. Products
- 12.1.7.3. Company Financials
- 12.1.7.4. SWOT Analysis
- 12.1.8 GLOBALFOUNDRIES Inc
- 12.1.8.1. Company Overview
- 12.1.8.2. Products
- 12.1.8.3. Company Financials
- 12.1.8.4. SWOT Analysis
- 12.1.9 Texas Instruments Incorporated
- 12.1.9.1. Company Overview
- 12.1.9.2. Products
- 12.1.9.3. Company Financials
- 12.1.9.4. SWOT Analysis
- 12.1.10 Intel Corporation
- 12.1.10.1. Company Overview
- 12.1.10.2. Products
- 12.1.10.3. Company Financials
- 12.1.10.4. SWOT Analysis
- 12.1.1 Infineon Technologies AG
- 12.2. Market Entropy
- 12.2.1 Company's Key Areas Served
- 12.2.2 Recent Developments
- 12.3. Company Market Share Analysis 2025
- 12.3.1 Top 5 Companies Market Share Analysis
- 12.3.2 Top 3 Companies Market Share Analysis
- 12.4. List of Potential Customers
- 13. Research Methodology
List of Figures
- Figure 1: Global Power Transistors Market Revenue Breakdown (billion, %) by Region 2025 & 2033
- Figure 2: North America Power Transistors Market Revenue (billion), by Type 2025 & 2033
- Figure 3: North America Power Transistors Market Revenue Share (%), by Type 2025 & 2033
- Figure 4: North America Power Transistors Market Revenue (billion), by End User Industry 2025 & 2033
- Figure 5: North America Power Transistors Market Revenue Share (%), by End User Industry 2025 & 2033
- Figure 6: North America Power Transistors Market Revenue (billion), by Country 2025 & 2033
- Figure 7: North America Power Transistors Market Revenue Share (%), by Country 2025 & 2033
- Figure 8: Europe Power Transistors Market Revenue (billion), by Type 2025 & 2033
- Figure 9: Europe Power Transistors Market Revenue Share (%), by Type 2025 & 2033
- Figure 10: Europe Power Transistors Market Revenue (billion), by End User Industry 2025 & 2033
- Figure 11: Europe Power Transistors Market Revenue Share (%), by End User Industry 2025 & 2033
- Figure 12: Europe Power Transistors Market Revenue (billion), by Country 2025 & 2033
- Figure 13: Europe Power Transistors Market Revenue Share (%), by Country 2025 & 2033
- Figure 14: Asia Pacific Power Transistors Market Revenue (billion), by Type 2025 & 2033
- Figure 15: Asia Pacific Power Transistors Market Revenue Share (%), by Type 2025 & 2033
- Figure 16: Asia Pacific Power Transistors Market Revenue (billion), by End User Industry 2025 & 2033
- Figure 17: Asia Pacific Power Transistors Market Revenue Share (%), by End User Industry 2025 & 2033
- Figure 18: Asia Pacific Power Transistors Market Revenue (billion), by Country 2025 & 2033
- Figure 19: Asia Pacific Power Transistors Market Revenue Share (%), by Country 2025 & 2033
- Figure 20: Latin America Power Transistors Market Revenue (billion), by Type 2025 & 2033
- Figure 21: Latin America Power Transistors Market Revenue Share (%), by Type 2025 & 2033
- Figure 22: Latin America Power Transistors Market Revenue (billion), by End User Industry 2025 & 2033
- Figure 23: Latin America Power Transistors Market Revenue Share (%), by End User Industry 2025 & 2033
- Figure 24: Latin America Power Transistors Market Revenue (billion), by Country 2025 & 2033
- Figure 25: Latin America Power Transistors Market Revenue Share (%), by Country 2025 & 2033
- Figure 26: Middle East Power Transistors Market Revenue (billion), by Type 2025 & 2033
- Figure 27: Middle East Power Transistors Market Revenue Share (%), by Type 2025 & 2033
- Figure 28: Middle East Power Transistors Market Revenue (billion), by End User Industry 2025 & 2033
- Figure 29: Middle East Power Transistors Market Revenue Share (%), by End User Industry 2025 & 2033
- Figure 30: Middle East Power Transistors Market Revenue (billion), by Country 2025 & 2033
- Figure 31: Middle East Power Transistors Market Revenue Share (%), by Country 2025 & 2033
List of Tables
- Table 1: Global Power Transistors Market Revenue billion Forecast, by Type 2020 & 2033
- Table 2: Global Power Transistors Market Revenue billion Forecast, by End User Industry 2020 & 2033
- Table 3: Global Power Transistors Market Revenue billion Forecast, by Region 2020 & 2033
- Table 4: Global Power Transistors Market Revenue billion Forecast, by Type 2020 & 2033
- Table 5: Global Power Transistors Market Revenue billion Forecast, by End User Industry 2020 & 2033
- Table 6: Global Power Transistors Market Revenue billion Forecast, by Country 2020 & 2033
- Table 7: Global Power Transistors Market Revenue billion Forecast, by Type 2020 & 2033
- Table 8: Global Power Transistors Market Revenue billion Forecast, by End User Industry 2020 & 2033
- Table 9: Global Power Transistors Market Revenue billion Forecast, by Country 2020 & 2033
- Table 10: Global Power Transistors Market Revenue billion Forecast, by Type 2020 & 2033
- Table 11: Global Power Transistors Market Revenue billion Forecast, by End User Industry 2020 & 2033
- Table 12: Global Power Transistors Market Revenue billion Forecast, by Country 2020 & 2033
- Table 13: Global Power Transistors Market Revenue billion Forecast, by Type 2020 & 2033
- Table 14: Global Power Transistors Market Revenue billion Forecast, by End User Industry 2020 & 2033
- Table 15: Global Power Transistors Market Revenue billion Forecast, by Country 2020 & 2033
- Table 16: Global Power Transistors Market Revenue billion Forecast, by Type 2020 & 2033
- Table 17: Global Power Transistors Market Revenue billion Forecast, by End User Industry 2020 & 2033
- Table 18: Global Power Transistors Market Revenue billion Forecast, by Country 2020 & 2033
Frequently Asked Questions
1. What is the projected Compound Annual Growth Rate (CAGR) of the Power Transistors Market?
The projected CAGR is approximately 8.15%.
2. Which companies are prominent players in the Power Transistors Market?
Key companies in the market include Infineon Technologies AG, NXP Semiconductors N V, Fairchild Semiconductor International Inc (ON Semiconductor Corp ), Taiwan Semiconductor Manufacturing Company, Samsung Electronics Co Ltd, Microchip Technology Inc *List Not Exhaustive, STMicroelectronics N V, GLOBALFOUNDRIES Inc, Texas Instruments Incorporated, Intel Corporation.
3. What are the main segments of the Power Transistors Market?
The market segments include Type, End User Industry.
4. Can you provide details about the market size?
The market size is estimated to be USD 15.82 billion as of 2022.
5. What are some drivers contributing to market growth?
Technological Advancements Leading To Demand for Increasing Device Densities; Proliferation of Consumer Electronics.
6. What are the notable trends driving market growth?
Increasing adoption of High Electron Mobility Transistor (HEMT).
7. Are there any restraints impacting market growth?
Cost of Maintaining Moore's Law is Getting Higher with Low Returns.
8. Can you provide examples of recent developments in the market?
September 2022 - EPC Power Conversion Corporation announced the EPC2050, a 350 V GaN transistor with a maximum RDS(on) of 80 mΩ and a pulsed output current of 26 A. The EPC2050 measures only 1.95 mm x 1.95 mm, making EPC2050-based solutions ten times smaller than solutions using equivalent silicon devices.
9. What pricing options are available for accessing the report?
Pricing options include single-user, multi-user, and enterprise licenses priced at USD 4750, USD 5250, and USD 8750 respectively.
10. Is the market size provided in terms of value or volume?
The market size is provided in terms of value, measured in billion.
11. Are there any specific market keywords associated with the report?
Yes, the market keyword associated with the report is "Power Transistors Market," which aids in identifying and referencing the specific market segment covered.
12. How do I determine which pricing option suits my needs best?
The pricing options vary based on user requirements and access needs. Individual users may opt for single-user licenses, while businesses requiring broader access may choose multi-user or enterprise licenses for cost-effective access to the report.
13. Are there any additional resources or data provided in the Power Transistors Market report?
While the report offers comprehensive insights, it's advisable to review the specific contents or supplementary materials provided to ascertain if additional resources or data are available.
14. How can I stay updated on further developments or reports in the Power Transistors Market?
To stay informed about further developments, trends, and reports in the Power Transistors Market, consider subscribing to industry newsletters, following relevant companies and organizations, or regularly checking reputable industry news sources and publications.
Methodology
Step 1 - Identification of Relevant Samples Size from Population Database


Step 2 - Approaches for Defining Global Market Size (Value, Volume* & Price*)

Note*: In applicable scenarios
Step 3 - Data Sources
Primary Research
- Web Analytics
- Survey Reports
- Research Institute
- Latest Research Reports
- Opinion Leaders
Secondary Research
- Annual Reports
- White Paper
- Latest Press Release
- Industry Association
- Paid Database
- Investor Presentations

Step 4 - Data Triangulation
Involves using different sources of information in order to increase the validity of a study
These sources are likely to be stakeholders in a program - participants, other researchers, program staff, other community members, and so on.
Then we put all data in single framework & apply various statistical tools to find out the dynamic on the market.
During the analysis stage, feedback from the stakeholder groups would be compared to determine areas of agreement as well as areas of divergence