

Key Insights
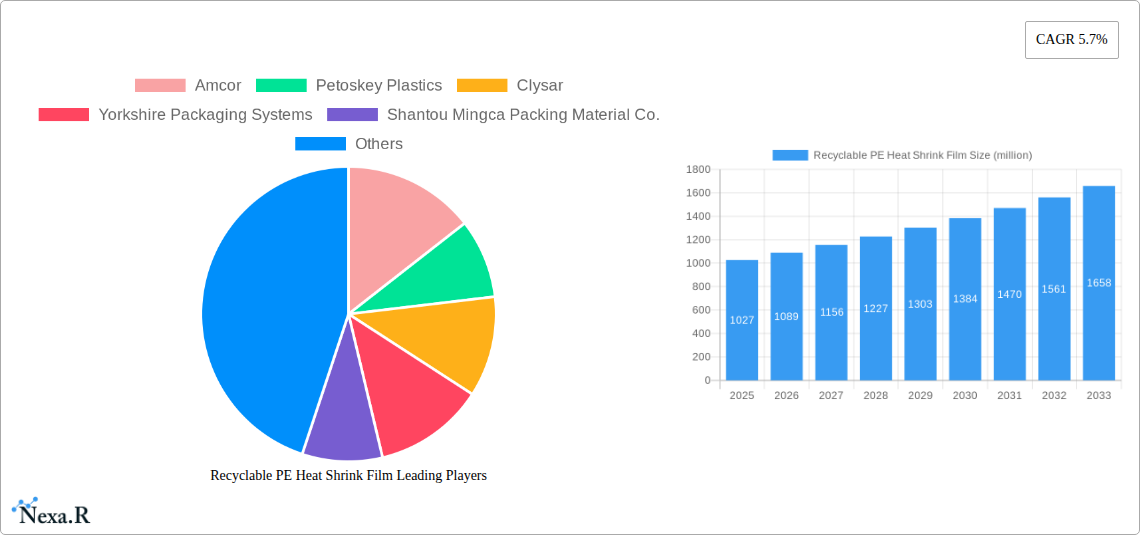
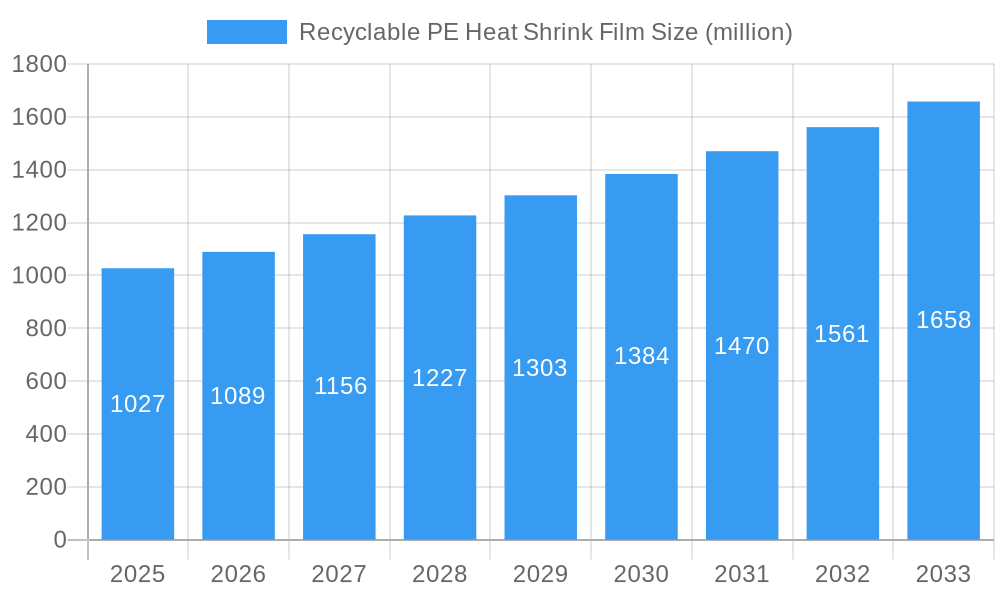
The recyclable PE heat shrink film market, valued at $1027 million in 2025, is projected to experience robust growth, driven by increasing environmental concerns and stringent regulations regarding plastic waste. A compound annual growth rate (CAGR) of 5.7% from 2025 to 2033 indicates a significant expansion of this market. Key drivers include the rising demand for sustainable packaging solutions across various industries, including food and beverage, consumer goods, and pharmaceuticals. Growing consumer awareness of environmental issues and a preference for eco-friendly products are further fueling market growth. The increasing adoption of recyclable PE heat shrink films by major players is also contributing to market expansion. However, the relatively higher cost compared to conventional heat shrink films and technological limitations in recycling infrastructure in certain regions present challenges to market growth. Nevertheless, ongoing innovations in recycling technologies and increased investment in sustainable packaging solutions are expected to mitigate these restraints. The market is segmented by application (food and beverage, industrial, etc.) and geography, with North America and Europe currently holding significant market shares. Leading companies like Amcor, Berry Global, and others are actively investing in developing and commercializing recyclable PE heat shrink films, further strengthening the market's growth trajectory.
Recyclable PE Heat Shrink Film Market Size (In Billion)
The competitive landscape is characterized by the presence of both large multinational corporations and specialized regional players. The market's future success depends on collaborative efforts across the value chain, including producers, brand owners, and recycling facilities. Continued focus on improving recycling infrastructure, coupled with the development of innovative and cost-effective recyclable PE heat shrink films, will be crucial for achieving sustainable market growth and reducing environmental impact. The projected market size for 2033 can be estimated using the CAGR: Assuming consistent growth, the market is expected to significantly expand, indicating considerable opportunities for investors and businesses engaged in the production and distribution of sustainable packaging materials.
Recyclable PE Heat Shrink Film Company Market Share
Recyclable PE Heat Shrink Film Market Report: 2019-2033
This comprehensive report provides a detailed analysis of the recyclable polyethylene (PE) heat shrink film market, encompassing market dynamics, growth trends, regional dominance, product landscape, key players, and future outlook. The study period covers 2019-2033, with a base year of 2025 and a forecast period of 2025-2033. The report caters to industry professionals, investors, and businesses seeking insights into this rapidly evolving market segment within the broader packaging industry. Market values are presented in million units.
Recyclable PE Heat Shrink Film Market Dynamics & Structure
The recyclable PE heat shrink film market is characterized by moderate concentration, with key players like Amcor, Berry Global, and several regional manufacturers holding significant market share. The market is driven by increasing environmental regulations, growing consumer demand for sustainable packaging solutions, and technological advancements in recyclable PE film production. However, high initial investment costs for new recycling infrastructure and the need for consistent material quality pose significant challenges. Mergers and acquisitions (M&A) activity has been moderate in recent years (xx deals in 2024), primarily focused on expanding geographical reach and product portfolios.
- Market Concentration: Moderately concentrated, with top 5 players holding xx% market share in 2024.
- Technological Innovation: Focus on improved recyclability, enhanced barrier properties, and lightweight film designs.
- Regulatory Framework: Stringent environmental regulations driving adoption of recyclable alternatives.
- Competitive Substitutes: Other sustainable packaging materials like biodegradable films and paper-based alternatives.
- End-User Demographics: Food and beverage, consumer goods, industrial goods sectors are major end-users.
- M&A Trends: Consolidation expected to increase, driven by economies of scale and technological advancements.
Recyclable PE Heat Shrink Film Growth Trends & Insights
The recyclable PE heat shrink film market is experiencing robust growth, driven by increasing environmental awareness and stricter regulations. The market size reached xx million units in 2024, exhibiting a CAGR of xx% during the historical period (2019-2024). This growth is expected to continue throughout the forecast period (2025-2033), with a projected CAGR of xx%, reaching xx million units by 2033. Market penetration is steadily rising, particularly in developed economies with advanced recycling infrastructure. Technological disruptions, such as the development of more easily recyclable film structures and improved recycling processes, are further accelerating market growth. Consumer preference for sustainable packaging is a crucial driver, shaping product development and influencing brand choices. However, challenges remain, including inconsistency in recycling infrastructure and the need for consumer education regarding proper disposal.
Dominant Regions, Countries, or Segments in Recyclable PE Heat Shrink Film
North America and Western Europe currently dominate the recyclable PE heat shrink film market, driven by stringent environmental regulations, strong consumer demand for sustainable products, and well-established recycling infrastructure. Asia-Pacific is projected to witness the fastest growth, fuelled by rising disposable incomes, increasing industrialization, and expanding e-commerce sector.
- North America: High adoption rates due to stringent environmental regulations and consumer awareness.
- Western Europe: Well-established recycling infrastructure and strong governmental support for sustainable packaging.
- Asia-Pacific: Fastest-growing region, driven by rising disposable incomes and industrialization.
- Key Drivers: Stringent environmental regulations, growing consumer preference for sustainable packaging, and technological advancements.
Recyclable PE Heat Shrink Film Product Landscape
The product landscape is characterized by a wide range of film types, thicknesses, and barrier properties tailored to specific applications. Innovations focus on improving recyclability through advanced film structures and incorporating recycled content. Key advancements include enhanced barrier properties to extend shelf life and improved shrink properties for efficient packaging. Unique selling propositions include reduced environmental impact, superior performance characteristics, and cost-effectiveness.
Key Drivers, Barriers & Challenges in Recyclable PE Heat Shrink Film
Key Drivers:
- Growing consumer demand for sustainable packaging.
- Stringent environmental regulations promoting recyclable materials.
- Technological advancements improving recyclability and performance.
Key Barriers and Challenges:
- High initial investment costs for recycling infrastructure.
- Inconsistent recycling infrastructure across different regions.
- Competition from alternative sustainable packaging materials.
- Fluctuations in raw material prices.
Emerging Opportunities in Recyclable PE Heat Shrink Film
- Expansion into emerging markets with growing demand for consumer goods.
- Development of innovative applications in diverse industries.
- Collaboration with technology providers to enhance recycling technologies.
- Focus on eco-friendly packaging solutions for e-commerce businesses.
Growth Accelerators in the Recyclable PE Heat Shrink Film Industry
Technological breakthroughs in film design and recycling processes are significant growth catalysts. Strategic partnerships between packaging manufacturers and recycling companies are also crucial for streamlining the recycling process and boosting market adoption. Expanding into new markets and applications, particularly in the food and beverage and e-commerce sectors, will further fuel market expansion.
Key Players Shaping the Recyclable PE Heat Shrink Film Market
- Amcor
- Petoskey Plastics
- Clysar
- Yorkshire Packaging Systems
- Shantou Mingca Packing Material Co.,Ltd
- TBS-PACK GmbH
- Plastic Union
- Berry Global
- Trioworld
- Bagla Group
- KIVO Group
- Borealis AG
- Polifilm
- Coveris
- PLASTO
- IPG
- Cryovac
- Syfan
- Folene Packaging
Notable Milestones in Recyclable PE Heat Shrink Film Sector
- 2021: Amcor launches a new line of recyclable PE heat shrink film with improved barrier properties.
- 2022: Berry Global invests in a new recycling facility for PE films.
- 2023: Several major brands commit to using 100% recyclable packaging by 2025.
- 2024: New EU regulations on plastic packaging come into effect.
In-Depth Recyclable PE Heat Shrink Film Market Outlook
The recyclable PE heat shrink film market is poised for significant growth, driven by a confluence of factors including increasing environmental concerns, stringent regulations, and technological advancements. Strategic partnerships, investments in recycling infrastructure, and the continued development of innovative, high-performance recyclable films will be crucial for realizing the market's full potential. Companies focusing on sustainability and product innovation are expected to gain a competitive edge in this dynamic market.
Recyclable PE Heat Shrink Film Segmentation
-
1. Application
- 1.1. Medicine
- 1.2. Food & Beverage
- 1.3. Home Applliances
- 1.4. Transport Packaging
- 1.5. Automotive Parts
- 1.6. Others
-
2. Types
- 2.1. Unidirectional Shrink Film
- 2.2. Bidirectional Shrink Film
Recyclable PE Heat Shrink Film Segmentation By Geography
-
1. North America
- 1.1. United States
- 1.2. Canada
- 1.3. Mexico
-
2. South America
- 2.1. Brazil
- 2.2. Argentina
- 2.3. Rest of South America
-
3. Europe
- 3.1. United Kingdom
- 3.2. Germany
- 3.3. France
- 3.4. Italy
- 3.5. Spain
- 3.6. Russia
- 3.7. Benelux
- 3.8. Nordics
- 3.9. Rest of Europe
-
4. Middle East & Africa
- 4.1. Turkey
- 4.2. Israel
- 4.3. GCC
- 4.4. North Africa
- 4.5. South Africa
- 4.6. Rest of Middle East & Africa
-
5. Asia Pacific
- 5.1. China
- 5.2. India
- 5.3. Japan
- 5.4. South Korea
- 5.5. ASEAN
- 5.6. Oceania
- 5.7. Rest of Asia Pacific

Recyclable PE Heat Shrink Film Regional Market Share
Geographic Coverage of Recyclable PE Heat Shrink Film
Recyclable PE Heat Shrink Film REPORT HIGHLIGHTS
| Aspects | Details |
|---|---|
| Study Period | 2020-2034 |
| Base Year | 2025 |
| Estimated Year | 2026 |
| Forecast Period | 2026-2034 |
| Historical Period | 2020-2025 |
| Growth Rate | CAGR of 5.7% from 2020-2034 |
| Segmentation |
|
Table of Contents
- 1. Introduction
- 1.1. Research Scope
- 1.2. Market Segmentation
- 1.3. Research Methodology
- 1.4. Definitions and Assumptions
- 2. Executive Summary
- 2.1. Introduction
- 3. Market Dynamics
- 3.1. Introduction
- 3.2. Market Drivers
- 3.3. Market Restrains
- 3.4. Market Trends
- 4. Market Factor Analysis
- 4.1. Porters Five Forces
- 4.2. Supply/Value Chain
- 4.3. PESTEL analysis
- 4.4. Market Entropy
- 4.5. Patent/Trademark Analysis
- 5. Global Recyclable PE Heat Shrink Film Analysis, Insights and Forecast, 2020-2032
- 5.1. Market Analysis, Insights and Forecast - by Application
- 5.1.1. Medicine
- 5.1.2. Food & Beverage
- 5.1.3. Home Applliances
- 5.1.4. Transport Packaging
- 5.1.5. Automotive Parts
- 5.1.6. Others
- 5.2. Market Analysis, Insights and Forecast - by Types
- 5.2.1. Unidirectional Shrink Film
- 5.2.2. Bidirectional Shrink Film
- 5.3. Market Analysis, Insights and Forecast - by Region
- 5.3.1. North America
- 5.3.2. South America
- 5.3.3. Europe
- 5.3.4. Middle East & Africa
- 5.3.5. Asia Pacific
- 5.1. Market Analysis, Insights and Forecast - by Application
- 6. North America Recyclable PE Heat Shrink Film Analysis, Insights and Forecast, 2020-2032
- 6.1. Market Analysis, Insights and Forecast - by Application
- 6.1.1. Medicine
- 6.1.2. Food & Beverage
- 6.1.3. Home Applliances
- 6.1.4. Transport Packaging
- 6.1.5. Automotive Parts
- 6.1.6. Others
- 6.2. Market Analysis, Insights and Forecast - by Types
- 6.2.1. Unidirectional Shrink Film
- 6.2.2. Bidirectional Shrink Film
- 6.1. Market Analysis, Insights and Forecast - by Application
- 7. South America Recyclable PE Heat Shrink Film Analysis, Insights and Forecast, 2020-2032
- 7.1. Market Analysis, Insights and Forecast - by Application
- 7.1.1. Medicine
- 7.1.2. Food & Beverage
- 7.1.3. Home Applliances
- 7.1.4. Transport Packaging
- 7.1.5. Automotive Parts
- 7.1.6. Others
- 7.2. Market Analysis, Insights and Forecast - by Types
- 7.2.1. Unidirectional Shrink Film
- 7.2.2. Bidirectional Shrink Film
- 7.1. Market Analysis, Insights and Forecast - by Application
- 8. Europe Recyclable PE Heat Shrink Film Analysis, Insights and Forecast, 2020-2032
- 8.1. Market Analysis, Insights and Forecast - by Application
- 8.1.1. Medicine
- 8.1.2. Food & Beverage
- 8.1.3. Home Applliances
- 8.1.4. Transport Packaging
- 8.1.5. Automotive Parts
- 8.1.6. Others
- 8.2. Market Analysis, Insights and Forecast - by Types
- 8.2.1. Unidirectional Shrink Film
- 8.2.2. Bidirectional Shrink Film
- 8.1. Market Analysis, Insights and Forecast - by Application
- 9. Middle East & Africa Recyclable PE Heat Shrink Film Analysis, Insights and Forecast, 2020-2032
- 9.1. Market Analysis, Insights and Forecast - by Application
- 9.1.1. Medicine
- 9.1.2. Food & Beverage
- 9.1.3. Home Applliances
- 9.1.4. Transport Packaging
- 9.1.5. Automotive Parts
- 9.1.6. Others
- 9.2. Market Analysis, Insights and Forecast - by Types
- 9.2.1. Unidirectional Shrink Film
- 9.2.2. Bidirectional Shrink Film
- 9.1. Market Analysis, Insights and Forecast - by Application
- 10. Asia Pacific Recyclable PE Heat Shrink Film Analysis, Insights and Forecast, 2020-2032
- 10.1. Market Analysis, Insights and Forecast - by Application
- 10.1.1. Medicine
- 10.1.2. Food & Beverage
- 10.1.3. Home Applliances
- 10.1.4. Transport Packaging
- 10.1.5. Automotive Parts
- 10.1.6. Others
- 10.2. Market Analysis, Insights and Forecast - by Types
- 10.2.1. Unidirectional Shrink Film
- 10.2.2. Bidirectional Shrink Film
- 10.1. Market Analysis, Insights and Forecast - by Application
- 11. Competitive Analysis
- 11.1. Global Market Share Analysis 2025
- 11.2. Company Profiles
- 11.2.1 Amcor
- 11.2.1.1. Overview
- 11.2.1.2. Products
- 11.2.1.3. SWOT Analysis
- 11.2.1.4. Recent Developments
- 11.2.1.5. Financials (Based on Availability)
- 11.2.2 Petoskey Plastics
- 11.2.2.1. Overview
- 11.2.2.2. Products
- 11.2.2.3. SWOT Analysis
- 11.2.2.4. Recent Developments
- 11.2.2.5. Financials (Based on Availability)
- 11.2.3 Clysar
- 11.2.3.1. Overview
- 11.2.3.2. Products
- 11.2.3.3. SWOT Analysis
- 11.2.3.4. Recent Developments
- 11.2.3.5. Financials (Based on Availability)
- 11.2.4 Yorkshire Packaging Systems
- 11.2.4.1. Overview
- 11.2.4.2. Products
- 11.2.4.3. SWOT Analysis
- 11.2.4.4. Recent Developments
- 11.2.4.5. Financials (Based on Availability)
- 11.2.5 Shantou Mingca Packing Material Co.
- 11.2.5.1. Overview
- 11.2.5.2. Products
- 11.2.5.3. SWOT Analysis
- 11.2.5.4. Recent Developments
- 11.2.5.5. Financials (Based on Availability)
- 11.2.6 Ltd
- 11.2.6.1. Overview
- 11.2.6.2. Products
- 11.2.6.3. SWOT Analysis
- 11.2.6.4. Recent Developments
- 11.2.6.5. Financials (Based on Availability)
- 11.2.7 TBS-PACK GmbH
- 11.2.7.1. Overview
- 11.2.7.2. Products
- 11.2.7.3. SWOT Analysis
- 11.2.7.4. Recent Developments
- 11.2.7.5. Financials (Based on Availability)
- 11.2.8 Plastic Union
- 11.2.8.1. Overview
- 11.2.8.2. Products
- 11.2.8.3. SWOT Analysis
- 11.2.8.4. Recent Developments
- 11.2.8.5. Financials (Based on Availability)
- 11.2.9 Berry
- 11.2.9.1. Overview
- 11.2.9.2. Products
- 11.2.9.3. SWOT Analysis
- 11.2.9.4. Recent Developments
- 11.2.9.5. Financials (Based on Availability)
- 11.2.10 Trioworld
- 11.2.10.1. Overview
- 11.2.10.2. Products
- 11.2.10.3. SWOT Analysis
- 11.2.10.4. Recent Developments
- 11.2.10.5. Financials (Based on Availability)
- 11.2.11 Bagla Group
- 11.2.11.1. Overview
- 11.2.11.2. Products
- 11.2.11.3. SWOT Analysis
- 11.2.11.4. Recent Developments
- 11.2.11.5. Financials (Based on Availability)
- 11.2.12 KIVO Group
- 11.2.12.1. Overview
- 11.2.12.2. Products
- 11.2.12.3. SWOT Analysis
- 11.2.12.4. Recent Developments
- 11.2.12.5. Financials (Based on Availability)
- 11.2.13 Borealis AG
- 11.2.13.1. Overview
- 11.2.13.2. Products
- 11.2.13.3. SWOT Analysis
- 11.2.13.4. Recent Developments
- 11.2.13.5. Financials (Based on Availability)
- 11.2.14 Polifilm
- 11.2.14.1. Overview
- 11.2.14.2. Products
- 11.2.14.3. SWOT Analysis
- 11.2.14.4. Recent Developments
- 11.2.14.5. Financials (Based on Availability)
- 11.2.15 Coveris
- 11.2.15.1. Overview
- 11.2.15.2. Products
- 11.2.15.3. SWOT Analysis
- 11.2.15.4. Recent Developments
- 11.2.15.5. Financials (Based on Availability)
- 11.2.16 PLASTO
- 11.2.16.1. Overview
- 11.2.16.2. Products
- 11.2.16.3. SWOT Analysis
- 11.2.16.4. Recent Developments
- 11.2.16.5. Financials (Based on Availability)
- 11.2.17 IPG
- 11.2.17.1. Overview
- 11.2.17.2. Products
- 11.2.17.3. SWOT Analysis
- 11.2.17.4. Recent Developments
- 11.2.17.5. Financials (Based on Availability)
- 11.2.18 Cryovac
- 11.2.18.1. Overview
- 11.2.18.2. Products
- 11.2.18.3. SWOT Analysis
- 11.2.18.4. Recent Developments
- 11.2.18.5. Financials (Based on Availability)
- 11.2.19 Syfan
- 11.2.19.1. Overview
- 11.2.19.2. Products
- 11.2.19.3. SWOT Analysis
- 11.2.19.4. Recent Developments
- 11.2.19.5. Financials (Based on Availability)
- 11.2.20 Folene Packaging
- 11.2.20.1. Overview
- 11.2.20.2. Products
- 11.2.20.3. SWOT Analysis
- 11.2.20.4. Recent Developments
- 11.2.20.5. Financials (Based on Availability)
- 11.2.1 Amcor
List of Figures
- Figure 1: Global Recyclable PE Heat Shrink Film Revenue Breakdown (million, %) by Region 2025 & 2033
- Figure 2: Global Recyclable PE Heat Shrink Film Volume Breakdown (K, %) by Region 2025 & 2033
- Figure 3: North America Recyclable PE Heat Shrink Film Revenue (million), by Application 2025 & 2033
- Figure 4: North America Recyclable PE Heat Shrink Film Volume (K), by Application 2025 & 2033
- Figure 5: North America Recyclable PE Heat Shrink Film Revenue Share (%), by Application 2025 & 2033
- Figure 6: North America Recyclable PE Heat Shrink Film Volume Share (%), by Application 2025 & 2033
- Figure 7: North America Recyclable PE Heat Shrink Film Revenue (million), by Types 2025 & 2033
- Figure 8: North America Recyclable PE Heat Shrink Film Volume (K), by Types 2025 & 2033
- Figure 9: North America Recyclable PE Heat Shrink Film Revenue Share (%), by Types 2025 & 2033
- Figure 10: North America Recyclable PE Heat Shrink Film Volume Share (%), by Types 2025 & 2033
- Figure 11: North America Recyclable PE Heat Shrink Film Revenue (million), by Country 2025 & 2033
- Figure 12: North America Recyclable PE Heat Shrink Film Volume (K), by Country 2025 & 2033
- Figure 13: North America Recyclable PE Heat Shrink Film Revenue Share (%), by Country 2025 & 2033
- Figure 14: North America Recyclable PE Heat Shrink Film Volume Share (%), by Country 2025 & 2033
- Figure 15: South America Recyclable PE Heat Shrink Film Revenue (million), by Application 2025 & 2033
- Figure 16: South America Recyclable PE Heat Shrink Film Volume (K), by Application 2025 & 2033
- Figure 17: South America Recyclable PE Heat Shrink Film Revenue Share (%), by Application 2025 & 2033
- Figure 18: South America Recyclable PE Heat Shrink Film Volume Share (%), by Application 2025 & 2033
- Figure 19: South America Recyclable PE Heat Shrink Film Revenue (million), by Types 2025 & 2033
- Figure 20: South America Recyclable PE Heat Shrink Film Volume (K), by Types 2025 & 2033
- Figure 21: South America Recyclable PE Heat Shrink Film Revenue Share (%), by Types 2025 & 2033
- Figure 22: South America Recyclable PE Heat Shrink Film Volume Share (%), by Types 2025 & 2033
- Figure 23: South America Recyclable PE Heat Shrink Film Revenue (million), by Country 2025 & 2033
- Figure 24: South America Recyclable PE Heat Shrink Film Volume (K), by Country 2025 & 2033
- Figure 25: South America Recyclable PE Heat Shrink Film Revenue Share (%), by Country 2025 & 2033
- Figure 26: South America Recyclable PE Heat Shrink Film Volume Share (%), by Country 2025 & 2033
- Figure 27: Europe Recyclable PE Heat Shrink Film Revenue (million), by Application 2025 & 2033
- Figure 28: Europe Recyclable PE Heat Shrink Film Volume (K), by Application 2025 & 2033
- Figure 29: Europe Recyclable PE Heat Shrink Film Revenue Share (%), by Application 2025 & 2033
- Figure 30: Europe Recyclable PE Heat Shrink Film Volume Share (%), by Application 2025 & 2033
- Figure 31: Europe Recyclable PE Heat Shrink Film Revenue (million), by Types 2025 & 2033
- Figure 32: Europe Recyclable PE Heat Shrink Film Volume (K), by Types 2025 & 2033
- Figure 33: Europe Recyclable PE Heat Shrink Film Revenue Share (%), by Types 2025 & 2033
- Figure 34: Europe Recyclable PE Heat Shrink Film Volume Share (%), by Types 2025 & 2033
- Figure 35: Europe Recyclable PE Heat Shrink Film Revenue (million), by Country 2025 & 2033
- Figure 36: Europe Recyclable PE Heat Shrink Film Volume (K), by Country 2025 & 2033
- Figure 37: Europe Recyclable PE Heat Shrink Film Revenue Share (%), by Country 2025 & 2033
- Figure 38: Europe Recyclable PE Heat Shrink Film Volume Share (%), by Country 2025 & 2033
- Figure 39: Middle East & Africa Recyclable PE Heat Shrink Film Revenue (million), by Application 2025 & 2033
- Figure 40: Middle East & Africa Recyclable PE Heat Shrink Film Volume (K), by Application 2025 & 2033
- Figure 41: Middle East & Africa Recyclable PE Heat Shrink Film Revenue Share (%), by Application 2025 & 2033
- Figure 42: Middle East & Africa Recyclable PE Heat Shrink Film Volume Share (%), by Application 2025 & 2033
- Figure 43: Middle East & Africa Recyclable PE Heat Shrink Film Revenue (million), by Types 2025 & 2033
- Figure 44: Middle East & Africa Recyclable PE Heat Shrink Film Volume (K), by Types 2025 & 2033
- Figure 45: Middle East & Africa Recyclable PE Heat Shrink Film Revenue Share (%), by Types 2025 & 2033
- Figure 46: Middle East & Africa Recyclable PE Heat Shrink Film Volume Share (%), by Types 2025 & 2033
- Figure 47: Middle East & Africa Recyclable PE Heat Shrink Film Revenue (million), by Country 2025 & 2033
- Figure 48: Middle East & Africa Recyclable PE Heat Shrink Film Volume (K), by Country 2025 & 2033
- Figure 49: Middle East & Africa Recyclable PE Heat Shrink Film Revenue Share (%), by Country 2025 & 2033
- Figure 50: Middle East & Africa Recyclable PE Heat Shrink Film Volume Share (%), by Country 2025 & 2033
- Figure 51: Asia Pacific Recyclable PE Heat Shrink Film Revenue (million), by Application 2025 & 2033
- Figure 52: Asia Pacific Recyclable PE Heat Shrink Film Volume (K), by Application 2025 & 2033
- Figure 53: Asia Pacific Recyclable PE Heat Shrink Film Revenue Share (%), by Application 2025 & 2033
- Figure 54: Asia Pacific Recyclable PE Heat Shrink Film Volume Share (%), by Application 2025 & 2033
- Figure 55: Asia Pacific Recyclable PE Heat Shrink Film Revenue (million), by Types 2025 & 2033
- Figure 56: Asia Pacific Recyclable PE Heat Shrink Film Volume (K), by Types 2025 & 2033
- Figure 57: Asia Pacific Recyclable PE Heat Shrink Film Revenue Share (%), by Types 2025 & 2033
- Figure 58: Asia Pacific Recyclable PE Heat Shrink Film Volume Share (%), by Types 2025 & 2033
- Figure 59: Asia Pacific Recyclable PE Heat Shrink Film Revenue (million), by Country 2025 & 2033
- Figure 60: Asia Pacific Recyclable PE Heat Shrink Film Volume (K), by Country 2025 & 2033
- Figure 61: Asia Pacific Recyclable PE Heat Shrink Film Revenue Share (%), by Country 2025 & 2033
- Figure 62: Asia Pacific Recyclable PE Heat Shrink Film Volume Share (%), by Country 2025 & 2033
List of Tables
- Table 1: Global Recyclable PE Heat Shrink Film Revenue million Forecast, by Application 2020 & 2033
- Table 2: Global Recyclable PE Heat Shrink Film Volume K Forecast, by Application 2020 & 2033
- Table 3: Global Recyclable PE Heat Shrink Film Revenue million Forecast, by Types 2020 & 2033
- Table 4: Global Recyclable PE Heat Shrink Film Volume K Forecast, by Types 2020 & 2033
- Table 5: Global Recyclable PE Heat Shrink Film Revenue million Forecast, by Region 2020 & 2033
- Table 6: Global Recyclable PE Heat Shrink Film Volume K Forecast, by Region 2020 & 2033
- Table 7: Global Recyclable PE Heat Shrink Film Revenue million Forecast, by Application 2020 & 2033
- Table 8: Global Recyclable PE Heat Shrink Film Volume K Forecast, by Application 2020 & 2033
- Table 9: Global Recyclable PE Heat Shrink Film Revenue million Forecast, by Types 2020 & 2033
- Table 10: Global Recyclable PE Heat Shrink Film Volume K Forecast, by Types 2020 & 2033
- Table 11: Global Recyclable PE Heat Shrink Film Revenue million Forecast, by Country 2020 & 2033
- Table 12: Global Recyclable PE Heat Shrink Film Volume K Forecast, by Country 2020 & 2033
- Table 13: United States Recyclable PE Heat Shrink Film Revenue (million) Forecast, by Application 2020 & 2033
- Table 14: United States Recyclable PE Heat Shrink Film Volume (K) Forecast, by Application 2020 & 2033
- Table 15: Canada Recyclable PE Heat Shrink Film Revenue (million) Forecast, by Application 2020 & 2033
- Table 16: Canada Recyclable PE Heat Shrink Film Volume (K) Forecast, by Application 2020 & 2033
- Table 17: Mexico Recyclable PE Heat Shrink Film Revenue (million) Forecast, by Application 2020 & 2033
- Table 18: Mexico Recyclable PE Heat Shrink Film Volume (K) Forecast, by Application 2020 & 2033
- Table 19: Global Recyclable PE Heat Shrink Film Revenue million Forecast, by Application 2020 & 2033
- Table 20: Global Recyclable PE Heat Shrink Film Volume K Forecast, by Application 2020 & 2033
- Table 21: Global Recyclable PE Heat Shrink Film Revenue million Forecast, by Types 2020 & 2033
- Table 22: Global Recyclable PE Heat Shrink Film Volume K Forecast, by Types 2020 & 2033
- Table 23: Global Recyclable PE Heat Shrink Film Revenue million Forecast, by Country 2020 & 2033
- Table 24: Global Recyclable PE Heat Shrink Film Volume K Forecast, by Country 2020 & 2033
- Table 25: Brazil Recyclable PE Heat Shrink Film Revenue (million) Forecast, by Application 2020 & 2033
- Table 26: Brazil Recyclable PE Heat Shrink Film Volume (K) Forecast, by Application 2020 & 2033
- Table 27: Argentina Recyclable PE Heat Shrink Film Revenue (million) Forecast, by Application 2020 & 2033
- Table 28: Argentina Recyclable PE Heat Shrink Film Volume (K) Forecast, by Application 2020 & 2033
- Table 29: Rest of South America Recyclable PE Heat Shrink Film Revenue (million) Forecast, by Application 2020 & 2033
- Table 30: Rest of South America Recyclable PE Heat Shrink Film Volume (K) Forecast, by Application 2020 & 2033
- Table 31: Global Recyclable PE Heat Shrink Film Revenue million Forecast, by Application 2020 & 2033
- Table 32: Global Recyclable PE Heat Shrink Film Volume K Forecast, by Application 2020 & 2033
- Table 33: Global Recyclable PE Heat Shrink Film Revenue million Forecast, by Types 2020 & 2033
- Table 34: Global Recyclable PE Heat Shrink Film Volume K Forecast, by Types 2020 & 2033
- Table 35: Global Recyclable PE Heat Shrink Film Revenue million Forecast, by Country 2020 & 2033
- Table 36: Global Recyclable PE Heat Shrink Film Volume K Forecast, by Country 2020 & 2033
- Table 37: United Kingdom Recyclable PE Heat Shrink Film Revenue (million) Forecast, by Application 2020 & 2033
- Table 38: United Kingdom Recyclable PE Heat Shrink Film Volume (K) Forecast, by Application 2020 & 2033
- Table 39: Germany Recyclable PE Heat Shrink Film Revenue (million) Forecast, by Application 2020 & 2033
- Table 40: Germany Recyclable PE Heat Shrink Film Volume (K) Forecast, by Application 2020 & 2033
- Table 41: France Recyclable PE Heat Shrink Film Revenue (million) Forecast, by Application 2020 & 2033
- Table 42: France Recyclable PE Heat Shrink Film Volume (K) Forecast, by Application 2020 & 2033
- Table 43: Italy Recyclable PE Heat Shrink Film Revenue (million) Forecast, by Application 2020 & 2033
- Table 44: Italy Recyclable PE Heat Shrink Film Volume (K) Forecast, by Application 2020 & 2033
- Table 45: Spain Recyclable PE Heat Shrink Film Revenue (million) Forecast, by Application 2020 & 2033
- Table 46: Spain Recyclable PE Heat Shrink Film Volume (K) Forecast, by Application 2020 & 2033
- Table 47: Russia Recyclable PE Heat Shrink Film Revenue (million) Forecast, by Application 2020 & 2033
- Table 48: Russia Recyclable PE Heat Shrink Film Volume (K) Forecast, by Application 2020 & 2033
- Table 49: Benelux Recyclable PE Heat Shrink Film Revenue (million) Forecast, by Application 2020 & 2033
- Table 50: Benelux Recyclable PE Heat Shrink Film Volume (K) Forecast, by Application 2020 & 2033
- Table 51: Nordics Recyclable PE Heat Shrink Film Revenue (million) Forecast, by Application 2020 & 2033
- Table 52: Nordics Recyclable PE Heat Shrink Film Volume (K) Forecast, by Application 2020 & 2033
- Table 53: Rest of Europe Recyclable PE Heat Shrink Film Revenue (million) Forecast, by Application 2020 & 2033
- Table 54: Rest of Europe Recyclable PE Heat Shrink Film Volume (K) Forecast, by Application 2020 & 2033
- Table 55: Global Recyclable PE Heat Shrink Film Revenue million Forecast, by Application 2020 & 2033
- Table 56: Global Recyclable PE Heat Shrink Film Volume K Forecast, by Application 2020 & 2033
- Table 57: Global Recyclable PE Heat Shrink Film Revenue million Forecast, by Types 2020 & 2033
- Table 58: Global Recyclable PE Heat Shrink Film Volume K Forecast, by Types 2020 & 2033
- Table 59: Global Recyclable PE Heat Shrink Film Revenue million Forecast, by Country 2020 & 2033
- Table 60: Global Recyclable PE Heat Shrink Film Volume K Forecast, by Country 2020 & 2033
- Table 61: Turkey Recyclable PE Heat Shrink Film Revenue (million) Forecast, by Application 2020 & 2033
- Table 62: Turkey Recyclable PE Heat Shrink Film Volume (K) Forecast, by Application 2020 & 2033
- Table 63: Israel Recyclable PE Heat Shrink Film Revenue (million) Forecast, by Application 2020 & 2033
- Table 64: Israel Recyclable PE Heat Shrink Film Volume (K) Forecast, by Application 2020 & 2033
- Table 65: GCC Recyclable PE Heat Shrink Film Revenue (million) Forecast, by Application 2020 & 2033
- Table 66: GCC Recyclable PE Heat Shrink Film Volume (K) Forecast, by Application 2020 & 2033
- Table 67: North Africa Recyclable PE Heat Shrink Film Revenue (million) Forecast, by Application 2020 & 2033
- Table 68: North Africa Recyclable PE Heat Shrink Film Volume (K) Forecast, by Application 2020 & 2033
- Table 69: South Africa Recyclable PE Heat Shrink Film Revenue (million) Forecast, by Application 2020 & 2033
- Table 70: South Africa Recyclable PE Heat Shrink Film Volume (K) Forecast, by Application 2020 & 2033
- Table 71: Rest of Middle East & Africa Recyclable PE Heat Shrink Film Revenue (million) Forecast, by Application 2020 & 2033
- Table 72: Rest of Middle East & Africa Recyclable PE Heat Shrink Film Volume (K) Forecast, by Application 2020 & 2033
- Table 73: Global Recyclable PE Heat Shrink Film Revenue million Forecast, by Application 2020 & 2033
- Table 74: Global Recyclable PE Heat Shrink Film Volume K Forecast, by Application 2020 & 2033
- Table 75: Global Recyclable PE Heat Shrink Film Revenue million Forecast, by Types 2020 & 2033
- Table 76: Global Recyclable PE Heat Shrink Film Volume K Forecast, by Types 2020 & 2033
- Table 77: Global Recyclable PE Heat Shrink Film Revenue million Forecast, by Country 2020 & 2033
- Table 78: Global Recyclable PE Heat Shrink Film Volume K Forecast, by Country 2020 & 2033
- Table 79: China Recyclable PE Heat Shrink Film Revenue (million) Forecast, by Application 2020 & 2033
- Table 80: China Recyclable PE Heat Shrink Film Volume (K) Forecast, by Application 2020 & 2033
- Table 81: India Recyclable PE Heat Shrink Film Revenue (million) Forecast, by Application 2020 & 2033
- Table 82: India Recyclable PE Heat Shrink Film Volume (K) Forecast, by Application 2020 & 2033
- Table 83: Japan Recyclable PE Heat Shrink Film Revenue (million) Forecast, by Application 2020 & 2033
- Table 84: Japan Recyclable PE Heat Shrink Film Volume (K) Forecast, by Application 2020 & 2033
- Table 85: South Korea Recyclable PE Heat Shrink Film Revenue (million) Forecast, by Application 2020 & 2033
- Table 86: South Korea Recyclable PE Heat Shrink Film Volume (K) Forecast, by Application 2020 & 2033
- Table 87: ASEAN Recyclable PE Heat Shrink Film Revenue (million) Forecast, by Application 2020 & 2033
- Table 88: ASEAN Recyclable PE Heat Shrink Film Volume (K) Forecast, by Application 2020 & 2033
- Table 89: Oceania Recyclable PE Heat Shrink Film Revenue (million) Forecast, by Application 2020 & 2033
- Table 90: Oceania Recyclable PE Heat Shrink Film Volume (K) Forecast, by Application 2020 & 2033
- Table 91: Rest of Asia Pacific Recyclable PE Heat Shrink Film Revenue (million) Forecast, by Application 2020 & 2033
- Table 92: Rest of Asia Pacific Recyclable PE Heat Shrink Film Volume (K) Forecast, by Application 2020 & 2033
Frequently Asked Questions
1. What is the projected Compound Annual Growth Rate (CAGR) of the Recyclable PE Heat Shrink Film?
The projected CAGR is approximately 5.7%.
2. Which companies are prominent players in the Recyclable PE Heat Shrink Film?
Key companies in the market include Amcor, Petoskey Plastics, Clysar, Yorkshire Packaging Systems, Shantou Mingca Packing Material Co., Ltd, TBS-PACK GmbH, Plastic Union, Berry, Trioworld, Bagla Group, KIVO Group, Borealis AG, Polifilm, Coveris, PLASTO, IPG, Cryovac, Syfan, Folene Packaging.
3. What are the main segments of the Recyclable PE Heat Shrink Film?
The market segments include Application, Types.
4. Can you provide details about the market size?
The market size is estimated to be USD 1027 million as of 2022.
5. What are some drivers contributing to market growth?
N/A
6. What are the notable trends driving market growth?
N/A
7. Are there any restraints impacting market growth?
N/A
8. Can you provide examples of recent developments in the market?
N/A
9. What pricing options are available for accessing the report?
Pricing options include single-user, multi-user, and enterprise licenses priced at USD 4350.00, USD 6525.00, and USD 8700.00 respectively.
10. Is the market size provided in terms of value or volume?
The market size is provided in terms of value, measured in million and volume, measured in K.
11. Are there any specific market keywords associated with the report?
Yes, the market keyword associated with the report is "Recyclable PE Heat Shrink Film," which aids in identifying and referencing the specific market segment covered.
12. How do I determine which pricing option suits my needs best?
The pricing options vary based on user requirements and access needs. Individual users may opt for single-user licenses, while businesses requiring broader access may choose multi-user or enterprise licenses for cost-effective access to the report.
13. Are there any additional resources or data provided in the Recyclable PE Heat Shrink Film report?
While the report offers comprehensive insights, it's advisable to review the specific contents or supplementary materials provided to ascertain if additional resources or data are available.
14. How can I stay updated on further developments or reports in the Recyclable PE Heat Shrink Film?
To stay informed about further developments, trends, and reports in the Recyclable PE Heat Shrink Film, consider subscribing to industry newsletters, following relevant companies and organizations, or regularly checking reputable industry news sources and publications.
Methodology
Step 1 - Identification of Relevant Samples Size from Population Database


Step 2 - Approaches for Defining Global Market Size (Value, Volume* & Price*)

Note*: In applicable scenarios
Step 3 - Data Sources
Primary Research
- Web Analytics
- Survey Reports
- Research Institute
- Latest Research Reports
- Opinion Leaders
Secondary Research
- Annual Reports
- White Paper
- Latest Press Release
- Industry Association
- Paid Database
- Investor Presentations

Step 4 - Data Triangulation
Involves using different sources of information in order to increase the validity of a study
These sources are likely to be stakeholders in a program - participants, other researchers, program staff, other community members, and so on.
Then we put all data in single framework & apply various statistical tools to find out the dynamic on the market.
During the analysis stage, feedback from the stakeholder groups would be compared to determine areas of agreement as well as areas of divergence