

Key Insights
The global refrigerated transport container market is poised for significant expansion, fueled by the burgeoning food and beverage sector, escalating demand for temperature-sensitive pharmaceuticals, and the rapid growth of e-commerce in perishables. The market is projected to reach $2.06 billion by 2025, with a Compound Annual Growth Rate (CAGR) of 6.5% from 2025 to 2033. Key growth drivers include the integration of advanced IoT sensors for real-time monitoring and enhanced supply chain visibility, a strong industry push towards sustainable solutions with eco-friendly refrigerants, and the global imperative for efficient cold chain logistics. Industry leaders such as Maersk Container Industry, Wabash National Corporation, and Schmitz Cargobull AG are strategically investing in innovation and market penetration to leverage this growth. However, market expansion may be tempered by volatile fuel costs, geopolitical instabilities, and potential global supply chain disruptions.
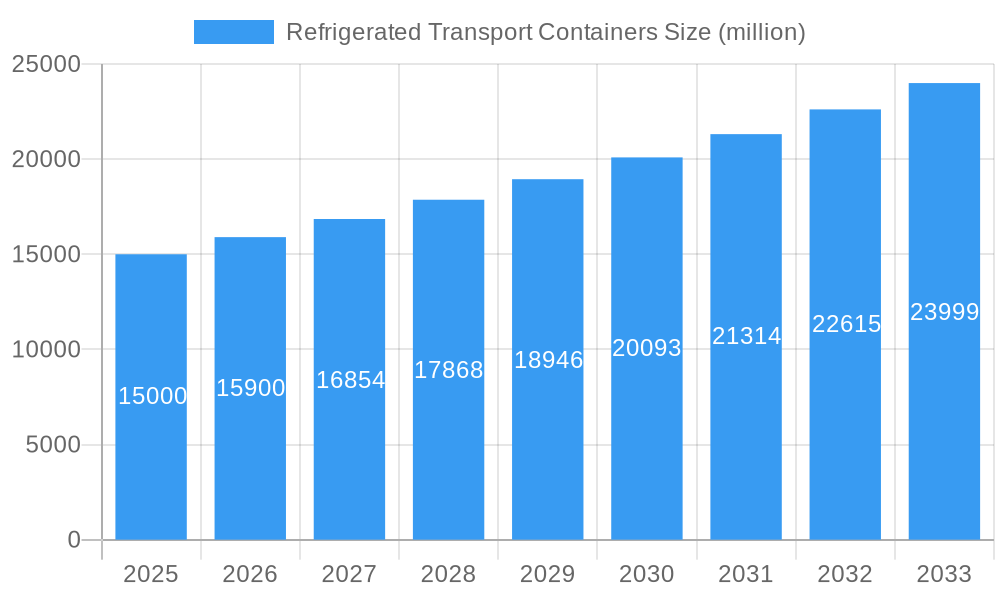
Refrigerated Transport Containers Market Size (In Billion)
Market segmentation covers container types (standard, specialized), applications (food & beverage, pharmaceuticals, chemicals), and regional dynamics (North America, Europe, Asia-Pacific, etc.). The Asia-Pacific region is anticipated to lead growth, driven by its expanding manufacturing and export capabilities. Established market participants are expected to maintain their dominance through strategic collaborations, mergers, and acquisitions. Furthermore, the growing demand for bespoke refrigerated container solutions will spur advancements in design and functionality. Despite existing challenges, the refrigerated transport container market presents a robust growth outlook for the foreseeable future.
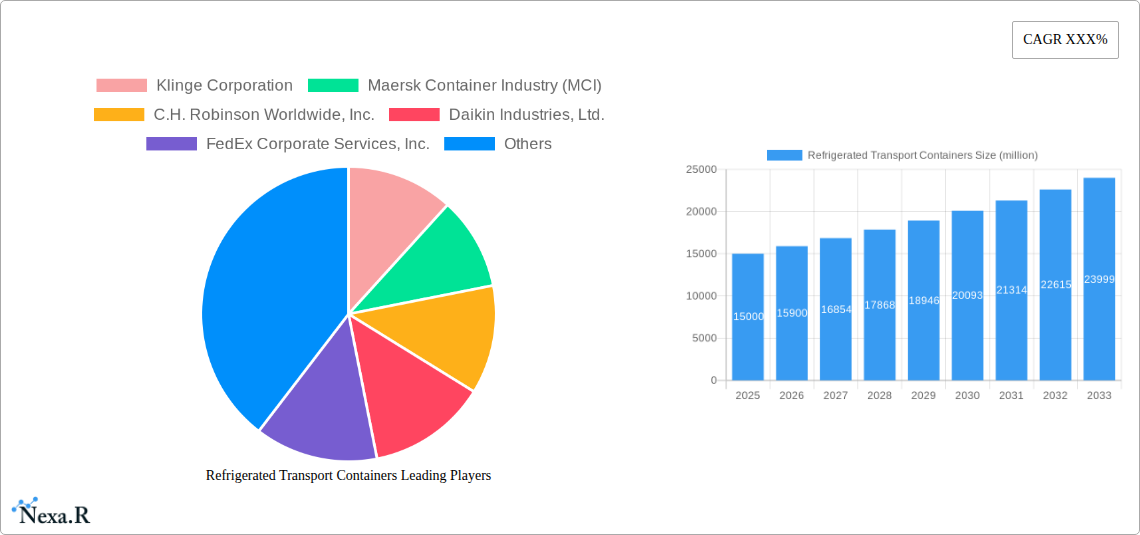
Refrigerated Transport Containers Company Market Share
Refrigerated Transport Containers Market Report: 2019-2033
This comprehensive report provides an in-depth analysis of the global refrigerated transport containers market, encompassing market dynamics, growth trends, regional segmentation, product landscape, key players, and future outlook. The study period covers 2019-2033, with a base year of 2025 and a forecast period of 2025-2033. The report utilizes data from the historical period (2019-2024) and leverages proprietary data analysis (XXX) to provide accurate and insightful projections. The market is segmented by various factors (details within the report), catering to the needs of industry professionals, investors, and researchers. The total market size is projected to reach xx million units by 2033.
Refrigerated Transport Containers Market Dynamics & Structure
This section analyzes the competitive landscape, technological advancements, regulatory influences, and market trends within the refrigerated transport containers market. The analysis covers the parent market of cold chain logistics and the child market of temperature-controlled transportation.
The market exhibits moderate concentration, with key players holding significant shares. Mergers and acquisitions (M&A) activity has been relatively consistent over the past five years, with approximately xx M&A deals recorded between 2019 and 2024. This activity is driven by a desire for companies to expand their market share and geographical reach.
- Market Concentration: The top 5 players account for approximately xx% of the market share (2024).
- Technological Innovation Drivers: Advancements in refrigeration technology (e.g., more energy-efficient systems), IoT integration for real-time monitoring, and sustainable materials are key drivers.
- Regulatory Frameworks: Stringent regulations concerning food safety and temperature control are shaping market dynamics, particularly impacting container design and operational procedures.
- Competitive Product Substitutes: Limited direct substitutes exist, but improvements in other transport methods (e.g., specialized trucking) are posing indirect competition.
- End-User Demographics: The primary end users are food and beverage companies, pharmaceutical manufacturers, and chemical producers. Growth is driven by rising demand for temperature-sensitive goods across various sectors.
- M&A Trends: Consolidation continues to be a prevalent strategy, aimed at leveraging economies of scale and expanding service portfolios. Strategic partnerships are also increasingly important for innovation and market access.
Refrigerated Transport Containers Growth Trends & Insights
The global refrigerated transport containers market experienced significant growth during the historical period (2019-2024), driven by factors such as the expanding global trade in perishable goods and the rising demand for efficient cold chain solutions. The market size increased from xx million units in 2019 to xx million units in 2024, registering a Compound Annual Growth Rate (CAGR) of xx%. This growth is expected to continue during the forecast period (2025-2033), albeit at a slightly moderated pace, with a projected CAGR of xx%. The increasing adoption of reefer containers in emerging economies, alongside technological innovations contributing to improved efficiency and cost-effectiveness, will continue to be primary growth drivers. Consumer behavior shifts towards increased demand for fresh produce and temperature-sensitive pharmaceuticals are further fueling market expansion. Market penetration in developing economies remains relatively low, presenting significant untapped potential for growth.
Dominant Regions, Countries, or Segments in Refrigerated Transport Containers
Asia-Pacific is currently the dominant region in the refrigerated transport containers market, accounting for approximately xx% of the global market share in 2024. This dominance is largely attributed to the region's robust economic growth, burgeoning food and beverage industry, and expanding e-commerce sector.
- Key Drivers in Asia-Pacific:
- Rapid economic growth in several key countries.
- Significant investments in cold chain infrastructure.
- Rising demand for perishable goods, including seafood and produce.
- Increasing adoption of refrigerated transport in the e-commerce sector.
North America and Europe also represent substantial markets, with steady growth driven by technological advancements and stringent regulatory frameworks promoting efficient and safe cold chain management.
Refrigerated Transport Containers Product Landscape
Refrigerated transport containers are evolving rapidly, with advancements in insulation materials, refrigeration systems, and monitoring technologies. Innovations focus on improving energy efficiency, reducing environmental impact, and enhancing temperature control precision. Features such as real-time temperature monitoring, GPS tracking, and improved data logging are becoming standard. The market offers a range of container sizes and specifications to meet diverse needs, from standard containers to specialized units designed for specific cargo types. Unique selling propositions include improved energy efficiency, enhanced temperature control, and advanced monitoring capabilities which provide greater visibility and control throughout the supply chain.
Key Drivers, Barriers & Challenges in Refrigerated Transport Containers
Key Drivers: The rising global demand for temperature-sensitive products, increasing urbanization, and the expanding e-commerce sector are significant drivers. Government initiatives promoting food safety and cold chain infrastructure development also contribute to market growth. Technological advancements, leading to improved efficiency and reduced operational costs, are further accelerating market expansion.
Key Challenges & Restraints: Fluctuations in fuel prices and geopolitical instability present challenges to the cost-effectiveness of refrigerated transport. Supply chain disruptions caused by pandemics or natural disasters can significantly impact market operations. Stringent regulatory compliance and evolving environmental standards also present ongoing challenges. Increased competition, particularly from other transportation modes, further exerts pressure on market players. The estimated impact of supply chain disruptions on the market size is about xx million units.
Emerging Opportunities in Refrigerated Transport Containers
Untapped markets in developing economies, coupled with the growing demand for high-quality perishable goods, present considerable expansion opportunities. The development of innovative container designs tailored to specific cargo types (e.g., pharmaceuticals or specialized food products) offers further scope for growth. The integration of advanced technologies like AI and machine learning for predictive maintenance and route optimization could also unlock substantial efficiency gains.
Growth Accelerators in the Refrigerated Transport Containers Industry
Technological advancements continue to be a key growth accelerator, with innovations in refrigeration systems, monitoring technologies, and container design improving efficiency and reducing costs. Strategic partnerships and collaborations between container manufacturers, logistics providers, and technology companies are also accelerating market growth by enabling access to new technologies and expanding service offerings. Market expansion strategies focusing on emerging markets and untapped customer segments further support long-term growth.
Key Players Shaping the Refrigerated Transport Containers Market
- Klinge Corporation
- Maersk Container Industry (MCI)
- C.H. Robinson Worldwide, Inc.
- Daikin Industries, Ltd.
- FedEx Corporate Services, Inc.
- Schenker AG
- General Mills Inc.
- Hyundai Motor Company
- Ingersoll Rand Inc.
- Krone Commercial Vehicle Group
- LAMBERET SAS
- Raytheon Technologies Corporation
- Utility Trailer Manufacturing Company, LLC
- Schmitz Cargobull AG
- Singamas Container Holdings Limited (Pacific International Lines)
- Wabash National Corporation
Notable Milestones in Refrigerated Transport Containers Sector
- 2020: Increased adoption of IoT-enabled reefer containers for real-time tracking and temperature monitoring.
- 2021: Launch of several new container models featuring improved energy efficiency and reduced emissions.
- 2022: Several key mergers and acquisitions aimed at strengthening market positions and expanding service portfolios.
- 2023: Significant investments in cold chain infrastructure in emerging economies.
- 2024: Increased focus on sustainable and eco-friendly refrigerated transport solutions.
In-Depth Refrigerated Transport Containers Market Outlook
The refrigerated transport containers market is poised for continued growth driven by sustained demand for temperature-sensitive goods, technological innovation, and expansion into emerging markets. Strategic opportunities exist in developing innovative container designs, leveraging advanced technologies for enhanced efficiency, and building strategic partnerships across the cold chain ecosystem. The market is anticipated to reach significant scale by 2033, fueled by consistent technological progress and growing global demand. The long-term outlook remains positive, with significant growth potential across various segments and regions.
Refrigerated Transport Containers Segmentation
-
1. Application
- 1.1. Food Transportation
- 1.2. Drug Transportation
- 1.3. Others
-
2. Type
- 2.1. One-Trip Containers
- 2.2. Reusable Containers
Refrigerated Transport Containers Segmentation By Geography
-
1. North America
- 1.1. United States
- 1.2. Canada
- 1.3. Mexico
-
2. South America
- 2.1. Brazil
- 2.2. Argentina
- 2.3. Rest of South America
-
3. Europe
- 3.1. United Kingdom
- 3.2. Germany
- 3.3. France
- 3.4. Italy
- 3.5. Spain
- 3.6. Russia
- 3.7. Benelux
- 3.8. Nordics
- 3.9. Rest of Europe
-
4. Middle East & Africa
- 4.1. Turkey
- 4.2. Israel
- 4.3. GCC
- 4.4. North Africa
- 4.5. South Africa
- 4.6. Rest of Middle East & Africa
-
5. Asia Pacific
- 5.1. China
- 5.2. India
- 5.3. Japan
- 5.4. South Korea
- 5.5. ASEAN
- 5.6. Oceania
- 5.7. Rest of Asia Pacific
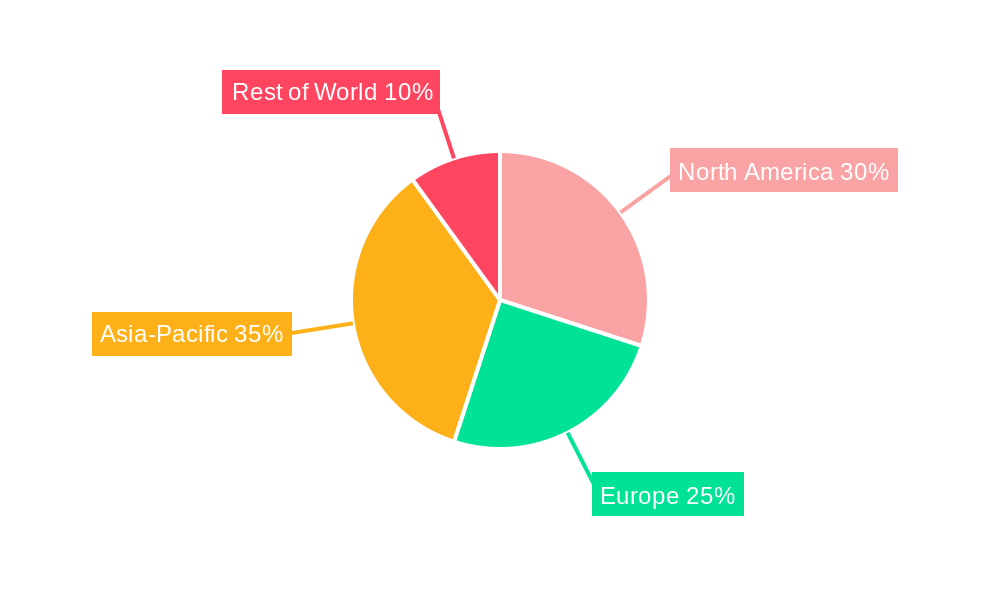
Refrigerated Transport Containers Regional Market Share
Geographic Coverage of Refrigerated Transport Containers
Refrigerated Transport Containers REPORT HIGHLIGHTS
| Aspects | Details |
|---|---|
| Study Period | 2020-2034 |
| Base Year | 2025 |
| Estimated Year | 2026 |
| Forecast Period | 2026-2034 |
| Historical Period | 2020-2025 |
| Growth Rate | CAGR of 6.5% from 2020-2034 |
| Segmentation |
|
Table of Contents
- 1. Introduction
- 1.1. Research Scope
- 1.2. Market Segmentation
- 1.3. Research Methodology
- 1.4. Definitions and Assumptions
- 2. Executive Summary
- 2.1. Introduction
- 3. Market Dynamics
- 3.1. Introduction
- 3.2. Market Drivers
- 3.3. Market Restrains
- 3.4. Market Trends
- 4. Market Factor Analysis
- 4.1. Porters Five Forces
- 4.2. Supply/Value Chain
- 4.3. PESTEL analysis
- 4.4. Market Entropy
- 4.5. Patent/Trademark Analysis
- 5. Global Refrigerated Transport Containers Analysis, Insights and Forecast, 2020-2032
- 5.1. Market Analysis, Insights and Forecast - by Application
- 5.1.1. Food Transportation
- 5.1.2. Drug Transportation
- 5.1.3. Others
- 5.2. Market Analysis, Insights and Forecast - by Type
- 5.2.1. One-Trip Containers
- 5.2.2. Reusable Containers
- 5.3. Market Analysis, Insights and Forecast - by Region
- 5.3.1. North America
- 5.3.2. South America
- 5.3.3. Europe
- 5.3.4. Middle East & Africa
- 5.3.5. Asia Pacific
- 5.1. Market Analysis, Insights and Forecast - by Application
- 6. North America Refrigerated Transport Containers Analysis, Insights and Forecast, 2020-2032
- 6.1. Market Analysis, Insights and Forecast - by Application
- 6.1.1. Food Transportation
- 6.1.2. Drug Transportation
- 6.1.3. Others
- 6.2. Market Analysis, Insights and Forecast - by Type
- 6.2.1. One-Trip Containers
- 6.2.2. Reusable Containers
- 6.1. Market Analysis, Insights and Forecast - by Application
- 7. South America Refrigerated Transport Containers Analysis, Insights and Forecast, 2020-2032
- 7.1. Market Analysis, Insights and Forecast - by Application
- 7.1.1. Food Transportation
- 7.1.2. Drug Transportation
- 7.1.3. Others
- 7.2. Market Analysis, Insights and Forecast - by Type
- 7.2.1. One-Trip Containers
- 7.2.2. Reusable Containers
- 7.1. Market Analysis, Insights and Forecast - by Application
- 8. Europe Refrigerated Transport Containers Analysis, Insights and Forecast, 2020-2032
- 8.1. Market Analysis, Insights and Forecast - by Application
- 8.1.1. Food Transportation
- 8.1.2. Drug Transportation
- 8.1.3. Others
- 8.2. Market Analysis, Insights and Forecast - by Type
- 8.2.1. One-Trip Containers
- 8.2.2. Reusable Containers
- 8.1. Market Analysis, Insights and Forecast - by Application
- 9. Middle East & Africa Refrigerated Transport Containers Analysis, Insights and Forecast, 2020-2032
- 9.1. Market Analysis, Insights and Forecast - by Application
- 9.1.1. Food Transportation
- 9.1.2. Drug Transportation
- 9.1.3. Others
- 9.2. Market Analysis, Insights and Forecast - by Type
- 9.2.1. One-Trip Containers
- 9.2.2. Reusable Containers
- 9.1. Market Analysis, Insights and Forecast - by Application
- 10. Asia Pacific Refrigerated Transport Containers Analysis, Insights and Forecast, 2020-2032
- 10.1. Market Analysis, Insights and Forecast - by Application
- 10.1.1. Food Transportation
- 10.1.2. Drug Transportation
- 10.1.3. Others
- 10.2. Market Analysis, Insights and Forecast - by Type
- 10.2.1. One-Trip Containers
- 10.2.2. Reusable Containers
- 10.1. Market Analysis, Insights and Forecast - by Application
- 11. Competitive Analysis
- 11.1. Global Market Share Analysis 2025
- 11.2. Company Profiles
- 11.2.1 Klinge Corporation
- 11.2.1.1. Overview
- 11.2.1.2. Products
- 11.2.1.3. SWOT Analysis
- 11.2.1.4. Recent Developments
- 11.2.1.5. Financials (Based on Availability)
- 11.2.2 Maersk Container Industry (MCI)
- 11.2.2.1. Overview
- 11.2.2.2. Products
- 11.2.2.3. SWOT Analysis
- 11.2.2.4. Recent Developments
- 11.2.2.5. Financials (Based on Availability)
- 11.2.3 C.H. Robinson Worldwide Inc.
- 11.2.3.1. Overview
- 11.2.3.2. Products
- 11.2.3.3. SWOT Analysis
- 11.2.3.4. Recent Developments
- 11.2.3.5. Financials (Based on Availability)
- 11.2.4 Daikin Industries Ltd.
- 11.2.4.1. Overview
- 11.2.4.2. Products
- 11.2.4.3. SWOT Analysis
- 11.2.4.4. Recent Developments
- 11.2.4.5. Financials (Based on Availability)
- 11.2.5 FedEx Corporate Services Inc.
- 11.2.5.1. Overview
- 11.2.5.2. Products
- 11.2.5.3. SWOT Analysis
- 11.2.5.4. Recent Developments
- 11.2.5.5. Financials (Based on Availability)
- 11.2.6 Schenker AG
- 11.2.6.1. Overview
- 11.2.6.2. Products
- 11.2.6.3. SWOT Analysis
- 11.2.6.4. Recent Developments
- 11.2.6.5. Financials (Based on Availability)
- 11.2.7 General Mills Inc.
- 11.2.7.1. Overview
- 11.2.7.2. Products
- 11.2.7.3. SWOT Analysis
- 11.2.7.4. Recent Developments
- 11.2.7.5. Financials (Based on Availability)
- 11.2.8 Hyundai Motor Company
- 11.2.8.1. Overview
- 11.2.8.2. Products
- 11.2.8.3. SWOT Analysis
- 11.2.8.4. Recent Developments
- 11.2.8.5. Financials (Based on Availability)
- 11.2.9 Ingersoll Rand Inc.
- 11.2.9.1. Overview
- 11.2.9.2. Products
- 11.2.9.3. SWOT Analysis
- 11.2.9.4. Recent Developments
- 11.2.9.5. Financials (Based on Availability)
- 11.2.10 Krone Commercial Vehicle Group
- 11.2.10.1. Overview
- 11.2.10.2. Products
- 11.2.10.3. SWOT Analysis
- 11.2.10.4. Recent Developments
- 11.2.10.5. Financials (Based on Availability)
- 11.2.11 LAMBERET SAS
- 11.2.11.1. Overview
- 11.2.11.2. Products
- 11.2.11.3. SWOT Analysis
- 11.2.11.4. Recent Developments
- 11.2.11.5. Financials (Based on Availability)
- 11.2.12 Raytheon Technologies Corporation
- 11.2.12.1. Overview
- 11.2.12.2. Products
- 11.2.12.3. SWOT Analysis
- 11.2.12.4. Recent Developments
- 11.2.12.5. Financials (Based on Availability)
- 11.2.13 Utility Trailer Manufacturing Company LLC
- 11.2.13.1. Overview
- 11.2.13.2. Products
- 11.2.13.3. SWOT Analysis
- 11.2.13.4. Recent Developments
- 11.2.13.5. Financials (Based on Availability)
- 11.2.14 Schmitz Cargobull AG
- 11.2.14.1. Overview
- 11.2.14.2. Products
- 11.2.14.3. SWOT Analysis
- 11.2.14.4. Recent Developments
- 11.2.14.5. Financials (Based on Availability)
- 11.2.15 Singamas Container Holdings Limited (Pacific International Lines)
- 11.2.15.1. Overview
- 11.2.15.2. Products
- 11.2.15.3. SWOT Analysis
- 11.2.15.4. Recent Developments
- 11.2.15.5. Financials (Based on Availability)
- 11.2.16 Wabash National Corporation
- 11.2.16.1. Overview
- 11.2.16.2. Products
- 11.2.16.3. SWOT Analysis
- 11.2.16.4. Recent Developments
- 11.2.16.5. Financials (Based on Availability)
- 11.2.1 Klinge Corporation
List of Figures
- Figure 1: Global Refrigerated Transport Containers Revenue Breakdown (billion, %) by Region 2025 & 2033
- Figure 2: Global Refrigerated Transport Containers Volume Breakdown (K, %) by Region 2025 & 2033
- Figure 3: North America Refrigerated Transport Containers Revenue (billion), by Application 2025 & 2033
- Figure 4: North America Refrigerated Transport Containers Volume (K), by Application 2025 & 2033
- Figure 5: North America Refrigerated Transport Containers Revenue Share (%), by Application 2025 & 2033
- Figure 6: North America Refrigerated Transport Containers Volume Share (%), by Application 2025 & 2033
- Figure 7: North America Refrigerated Transport Containers Revenue (billion), by Type 2025 & 2033
- Figure 8: North America Refrigerated Transport Containers Volume (K), by Type 2025 & 2033
- Figure 9: North America Refrigerated Transport Containers Revenue Share (%), by Type 2025 & 2033
- Figure 10: North America Refrigerated Transport Containers Volume Share (%), by Type 2025 & 2033
- Figure 11: North America Refrigerated Transport Containers Revenue (billion), by Country 2025 & 2033
- Figure 12: North America Refrigerated Transport Containers Volume (K), by Country 2025 & 2033
- Figure 13: North America Refrigerated Transport Containers Revenue Share (%), by Country 2025 & 2033
- Figure 14: North America Refrigerated Transport Containers Volume Share (%), by Country 2025 & 2033
- Figure 15: South America Refrigerated Transport Containers Revenue (billion), by Application 2025 & 2033
- Figure 16: South America Refrigerated Transport Containers Volume (K), by Application 2025 & 2033
- Figure 17: South America Refrigerated Transport Containers Revenue Share (%), by Application 2025 & 2033
- Figure 18: South America Refrigerated Transport Containers Volume Share (%), by Application 2025 & 2033
- Figure 19: South America Refrigerated Transport Containers Revenue (billion), by Type 2025 & 2033
- Figure 20: South America Refrigerated Transport Containers Volume (K), by Type 2025 & 2033
- Figure 21: South America Refrigerated Transport Containers Revenue Share (%), by Type 2025 & 2033
- Figure 22: South America Refrigerated Transport Containers Volume Share (%), by Type 2025 & 2033
- Figure 23: South America Refrigerated Transport Containers Revenue (billion), by Country 2025 & 2033
- Figure 24: South America Refrigerated Transport Containers Volume (K), by Country 2025 & 2033
- Figure 25: South America Refrigerated Transport Containers Revenue Share (%), by Country 2025 & 2033
- Figure 26: South America Refrigerated Transport Containers Volume Share (%), by Country 2025 & 2033
- Figure 27: Europe Refrigerated Transport Containers Revenue (billion), by Application 2025 & 2033
- Figure 28: Europe Refrigerated Transport Containers Volume (K), by Application 2025 & 2033
- Figure 29: Europe Refrigerated Transport Containers Revenue Share (%), by Application 2025 & 2033
- Figure 30: Europe Refrigerated Transport Containers Volume Share (%), by Application 2025 & 2033
- Figure 31: Europe Refrigerated Transport Containers Revenue (billion), by Type 2025 & 2033
- Figure 32: Europe Refrigerated Transport Containers Volume (K), by Type 2025 & 2033
- Figure 33: Europe Refrigerated Transport Containers Revenue Share (%), by Type 2025 & 2033
- Figure 34: Europe Refrigerated Transport Containers Volume Share (%), by Type 2025 & 2033
- Figure 35: Europe Refrigerated Transport Containers Revenue (billion), by Country 2025 & 2033
- Figure 36: Europe Refrigerated Transport Containers Volume (K), by Country 2025 & 2033
- Figure 37: Europe Refrigerated Transport Containers Revenue Share (%), by Country 2025 & 2033
- Figure 38: Europe Refrigerated Transport Containers Volume Share (%), by Country 2025 & 2033
- Figure 39: Middle East & Africa Refrigerated Transport Containers Revenue (billion), by Application 2025 & 2033
- Figure 40: Middle East & Africa Refrigerated Transport Containers Volume (K), by Application 2025 & 2033
- Figure 41: Middle East & Africa Refrigerated Transport Containers Revenue Share (%), by Application 2025 & 2033
- Figure 42: Middle East & Africa Refrigerated Transport Containers Volume Share (%), by Application 2025 & 2033
- Figure 43: Middle East & Africa Refrigerated Transport Containers Revenue (billion), by Type 2025 & 2033
- Figure 44: Middle East & Africa Refrigerated Transport Containers Volume (K), by Type 2025 & 2033
- Figure 45: Middle East & Africa Refrigerated Transport Containers Revenue Share (%), by Type 2025 & 2033
- Figure 46: Middle East & Africa Refrigerated Transport Containers Volume Share (%), by Type 2025 & 2033
- Figure 47: Middle East & Africa Refrigerated Transport Containers Revenue (billion), by Country 2025 & 2033
- Figure 48: Middle East & Africa Refrigerated Transport Containers Volume (K), by Country 2025 & 2033
- Figure 49: Middle East & Africa Refrigerated Transport Containers Revenue Share (%), by Country 2025 & 2033
- Figure 50: Middle East & Africa Refrigerated Transport Containers Volume Share (%), by Country 2025 & 2033
- Figure 51: Asia Pacific Refrigerated Transport Containers Revenue (billion), by Application 2025 & 2033
- Figure 52: Asia Pacific Refrigerated Transport Containers Volume (K), by Application 2025 & 2033
- Figure 53: Asia Pacific Refrigerated Transport Containers Revenue Share (%), by Application 2025 & 2033
- Figure 54: Asia Pacific Refrigerated Transport Containers Volume Share (%), by Application 2025 & 2033
- Figure 55: Asia Pacific Refrigerated Transport Containers Revenue (billion), by Type 2025 & 2033
- Figure 56: Asia Pacific Refrigerated Transport Containers Volume (K), by Type 2025 & 2033
- Figure 57: Asia Pacific Refrigerated Transport Containers Revenue Share (%), by Type 2025 & 2033
- Figure 58: Asia Pacific Refrigerated Transport Containers Volume Share (%), by Type 2025 & 2033
- Figure 59: Asia Pacific Refrigerated Transport Containers Revenue (billion), by Country 2025 & 2033
- Figure 60: Asia Pacific Refrigerated Transport Containers Volume (K), by Country 2025 & 2033
- Figure 61: Asia Pacific Refrigerated Transport Containers Revenue Share (%), by Country 2025 & 2033
- Figure 62: Asia Pacific Refrigerated Transport Containers Volume Share (%), by Country 2025 & 2033
List of Tables
- Table 1: Global Refrigerated Transport Containers Revenue billion Forecast, by Application 2020 & 2033
- Table 2: Global Refrigerated Transport Containers Volume K Forecast, by Application 2020 & 2033
- Table 3: Global Refrigerated Transport Containers Revenue billion Forecast, by Type 2020 & 2033
- Table 4: Global Refrigerated Transport Containers Volume K Forecast, by Type 2020 & 2033
- Table 5: Global Refrigerated Transport Containers Revenue billion Forecast, by Region 2020 & 2033
- Table 6: Global Refrigerated Transport Containers Volume K Forecast, by Region 2020 & 2033
- Table 7: Global Refrigerated Transport Containers Revenue billion Forecast, by Application 2020 & 2033
- Table 8: Global Refrigerated Transport Containers Volume K Forecast, by Application 2020 & 2033
- Table 9: Global Refrigerated Transport Containers Revenue billion Forecast, by Type 2020 & 2033
- Table 10: Global Refrigerated Transport Containers Volume K Forecast, by Type 2020 & 2033
- Table 11: Global Refrigerated Transport Containers Revenue billion Forecast, by Country 2020 & 2033
- Table 12: Global Refrigerated Transport Containers Volume K Forecast, by Country 2020 & 2033
- Table 13: United States Refrigerated Transport Containers Revenue (billion) Forecast, by Application 2020 & 2033
- Table 14: United States Refrigerated Transport Containers Volume (K) Forecast, by Application 2020 & 2033
- Table 15: Canada Refrigerated Transport Containers Revenue (billion) Forecast, by Application 2020 & 2033
- Table 16: Canada Refrigerated Transport Containers Volume (K) Forecast, by Application 2020 & 2033
- Table 17: Mexico Refrigerated Transport Containers Revenue (billion) Forecast, by Application 2020 & 2033
- Table 18: Mexico Refrigerated Transport Containers Volume (K) Forecast, by Application 2020 & 2033
- Table 19: Global Refrigerated Transport Containers Revenue billion Forecast, by Application 2020 & 2033
- Table 20: Global Refrigerated Transport Containers Volume K Forecast, by Application 2020 & 2033
- Table 21: Global Refrigerated Transport Containers Revenue billion Forecast, by Type 2020 & 2033
- Table 22: Global Refrigerated Transport Containers Volume K Forecast, by Type 2020 & 2033
- Table 23: Global Refrigerated Transport Containers Revenue billion Forecast, by Country 2020 & 2033
- Table 24: Global Refrigerated Transport Containers Volume K Forecast, by Country 2020 & 2033
- Table 25: Brazil Refrigerated Transport Containers Revenue (billion) Forecast, by Application 2020 & 2033
- Table 26: Brazil Refrigerated Transport Containers Volume (K) Forecast, by Application 2020 & 2033
- Table 27: Argentina Refrigerated Transport Containers Revenue (billion) Forecast, by Application 2020 & 2033
- Table 28: Argentina Refrigerated Transport Containers Volume (K) Forecast, by Application 2020 & 2033
- Table 29: Rest of South America Refrigerated Transport Containers Revenue (billion) Forecast, by Application 2020 & 2033
- Table 30: Rest of South America Refrigerated Transport Containers Volume (K) Forecast, by Application 2020 & 2033
- Table 31: Global Refrigerated Transport Containers Revenue billion Forecast, by Application 2020 & 2033
- Table 32: Global Refrigerated Transport Containers Volume K Forecast, by Application 2020 & 2033
- Table 33: Global Refrigerated Transport Containers Revenue billion Forecast, by Type 2020 & 2033
- Table 34: Global Refrigerated Transport Containers Volume K Forecast, by Type 2020 & 2033
- Table 35: Global Refrigerated Transport Containers Revenue billion Forecast, by Country 2020 & 2033
- Table 36: Global Refrigerated Transport Containers Volume K Forecast, by Country 2020 & 2033
- Table 37: United Kingdom Refrigerated Transport Containers Revenue (billion) Forecast, by Application 2020 & 2033
- Table 38: United Kingdom Refrigerated Transport Containers Volume (K) Forecast, by Application 2020 & 2033
- Table 39: Germany Refrigerated Transport Containers Revenue (billion) Forecast, by Application 2020 & 2033
- Table 40: Germany Refrigerated Transport Containers Volume (K) Forecast, by Application 2020 & 2033
- Table 41: France Refrigerated Transport Containers Revenue (billion) Forecast, by Application 2020 & 2033
- Table 42: France Refrigerated Transport Containers Volume (K) Forecast, by Application 2020 & 2033
- Table 43: Italy Refrigerated Transport Containers Revenue (billion) Forecast, by Application 2020 & 2033
- Table 44: Italy Refrigerated Transport Containers Volume (K) Forecast, by Application 2020 & 2033
- Table 45: Spain Refrigerated Transport Containers Revenue (billion) Forecast, by Application 2020 & 2033
- Table 46: Spain Refrigerated Transport Containers Volume (K) Forecast, by Application 2020 & 2033
- Table 47: Russia Refrigerated Transport Containers Revenue (billion) Forecast, by Application 2020 & 2033
- Table 48: Russia Refrigerated Transport Containers Volume (K) Forecast, by Application 2020 & 2033
- Table 49: Benelux Refrigerated Transport Containers Revenue (billion) Forecast, by Application 2020 & 2033
- Table 50: Benelux Refrigerated Transport Containers Volume (K) Forecast, by Application 2020 & 2033
- Table 51: Nordics Refrigerated Transport Containers Revenue (billion) Forecast, by Application 2020 & 2033
- Table 52: Nordics Refrigerated Transport Containers Volume (K) Forecast, by Application 2020 & 2033
- Table 53: Rest of Europe Refrigerated Transport Containers Revenue (billion) Forecast, by Application 2020 & 2033
- Table 54: Rest of Europe Refrigerated Transport Containers Volume (K) Forecast, by Application 2020 & 2033
- Table 55: Global Refrigerated Transport Containers Revenue billion Forecast, by Application 2020 & 2033
- Table 56: Global Refrigerated Transport Containers Volume K Forecast, by Application 2020 & 2033
- Table 57: Global Refrigerated Transport Containers Revenue billion Forecast, by Type 2020 & 2033
- Table 58: Global Refrigerated Transport Containers Volume K Forecast, by Type 2020 & 2033
- Table 59: Global Refrigerated Transport Containers Revenue billion Forecast, by Country 2020 & 2033
- Table 60: Global Refrigerated Transport Containers Volume K Forecast, by Country 2020 & 2033
- Table 61: Turkey Refrigerated Transport Containers Revenue (billion) Forecast, by Application 2020 & 2033
- Table 62: Turkey Refrigerated Transport Containers Volume (K) Forecast, by Application 2020 & 2033
- Table 63: Israel Refrigerated Transport Containers Revenue (billion) Forecast, by Application 2020 & 2033
- Table 64: Israel Refrigerated Transport Containers Volume (K) Forecast, by Application 2020 & 2033
- Table 65: GCC Refrigerated Transport Containers Revenue (billion) Forecast, by Application 2020 & 2033
- Table 66: GCC Refrigerated Transport Containers Volume (K) Forecast, by Application 2020 & 2033
- Table 67: North Africa Refrigerated Transport Containers Revenue (billion) Forecast, by Application 2020 & 2033
- Table 68: North Africa Refrigerated Transport Containers Volume (K) Forecast, by Application 2020 & 2033
- Table 69: South Africa Refrigerated Transport Containers Revenue (billion) Forecast, by Application 2020 & 2033
- Table 70: South Africa Refrigerated Transport Containers Volume (K) Forecast, by Application 2020 & 2033
- Table 71: Rest of Middle East & Africa Refrigerated Transport Containers Revenue (billion) Forecast, by Application 2020 & 2033
- Table 72: Rest of Middle East & Africa Refrigerated Transport Containers Volume (K) Forecast, by Application 2020 & 2033
- Table 73: Global Refrigerated Transport Containers Revenue billion Forecast, by Application 2020 & 2033
- Table 74: Global Refrigerated Transport Containers Volume K Forecast, by Application 2020 & 2033
- Table 75: Global Refrigerated Transport Containers Revenue billion Forecast, by Type 2020 & 2033
- Table 76: Global Refrigerated Transport Containers Volume K Forecast, by Type 2020 & 2033
- Table 77: Global Refrigerated Transport Containers Revenue billion Forecast, by Country 2020 & 2033
- Table 78: Global Refrigerated Transport Containers Volume K Forecast, by Country 2020 & 2033
- Table 79: China Refrigerated Transport Containers Revenue (billion) Forecast, by Application 2020 & 2033
- Table 80: China Refrigerated Transport Containers Volume (K) Forecast, by Application 2020 & 2033
- Table 81: India Refrigerated Transport Containers Revenue (billion) Forecast, by Application 2020 & 2033
- Table 82: India Refrigerated Transport Containers Volume (K) Forecast, by Application 2020 & 2033
- Table 83: Japan Refrigerated Transport Containers Revenue (billion) Forecast, by Application 2020 & 2033
- Table 84: Japan Refrigerated Transport Containers Volume (K) Forecast, by Application 2020 & 2033
- Table 85: South Korea Refrigerated Transport Containers Revenue (billion) Forecast, by Application 2020 & 2033
- Table 86: South Korea Refrigerated Transport Containers Volume (K) Forecast, by Application 2020 & 2033
- Table 87: ASEAN Refrigerated Transport Containers Revenue (billion) Forecast, by Application 2020 & 2033
- Table 88: ASEAN Refrigerated Transport Containers Volume (K) Forecast, by Application 2020 & 2033
- Table 89: Oceania Refrigerated Transport Containers Revenue (billion) Forecast, by Application 2020 & 2033
- Table 90: Oceania Refrigerated Transport Containers Volume (K) Forecast, by Application 2020 & 2033
- Table 91: Rest of Asia Pacific Refrigerated Transport Containers Revenue (billion) Forecast, by Application 2020 & 2033
- Table 92: Rest of Asia Pacific Refrigerated Transport Containers Volume (K) Forecast, by Application 2020 & 2033
Frequently Asked Questions
1. What is the projected Compound Annual Growth Rate (CAGR) of the Refrigerated Transport Containers?
The projected CAGR is approximately 6.5%.
2. Which companies are prominent players in the Refrigerated Transport Containers?
Key companies in the market include Klinge Corporation, Maersk Container Industry (MCI), C.H. Robinson Worldwide, Inc., Daikin Industries, Ltd., FedEx Corporate Services, Inc., Schenker AG, General Mills Inc., Hyundai Motor Company, Ingersoll Rand Inc., Krone Commercial Vehicle Group, LAMBERET SAS, Raytheon Technologies Corporation, Utility Trailer Manufacturing Company, LLC, Schmitz Cargobull AG, Singamas Container Holdings Limited (Pacific International Lines), Wabash National Corporation.
3. What are the main segments of the Refrigerated Transport Containers?
The market segments include Application, Type.
4. Can you provide details about the market size?
The market size is estimated to be USD 2.06 billion as of 2022.
5. What are some drivers contributing to market growth?
N/A
6. What are the notable trends driving market growth?
N/A
7. Are there any restraints impacting market growth?
N/A
8. Can you provide examples of recent developments in the market?
N/A
9. What pricing options are available for accessing the report?
Pricing options include single-user, multi-user, and enterprise licenses priced at USD 3950.00, USD 5925.00, and USD 7900.00 respectively.
10. Is the market size provided in terms of value or volume?
The market size is provided in terms of value, measured in billion and volume, measured in K.
11. Are there any specific market keywords associated with the report?
Yes, the market keyword associated with the report is "Refrigerated Transport Containers," which aids in identifying and referencing the specific market segment covered.
12. How do I determine which pricing option suits my needs best?
The pricing options vary based on user requirements and access needs. Individual users may opt for single-user licenses, while businesses requiring broader access may choose multi-user or enterprise licenses for cost-effective access to the report.
13. Are there any additional resources or data provided in the Refrigerated Transport Containers report?
While the report offers comprehensive insights, it's advisable to review the specific contents or supplementary materials provided to ascertain if additional resources or data are available.
14. How can I stay updated on further developments or reports in the Refrigerated Transport Containers?
To stay informed about further developments, trends, and reports in the Refrigerated Transport Containers, consider subscribing to industry newsletters, following relevant companies and organizations, or regularly checking reputable industry news sources and publications.
Methodology
Step 1 - Identification of Relevant Samples Size from Population Database


Step 2 - Approaches for Defining Global Market Size (Value, Volume* & Price*)

Note*: In applicable scenarios
Step 3 - Data Sources
Primary Research
- Web Analytics
- Survey Reports
- Research Institute
- Latest Research Reports
- Opinion Leaders
Secondary Research
- Annual Reports
- White Paper
- Latest Press Release
- Industry Association
- Paid Database
- Investor Presentations

Step 4 - Data Triangulation
Involves using different sources of information in order to increase the validity of a study
These sources are likely to be stakeholders in a program - participants, other researchers, program staff, other community members, and so on.
Then we put all data in single framework & apply various statistical tools to find out the dynamic on the market.
During the analysis stage, feedback from the stakeholder groups would be compared to determine areas of agreement as well as areas of divergence