

Key Insights
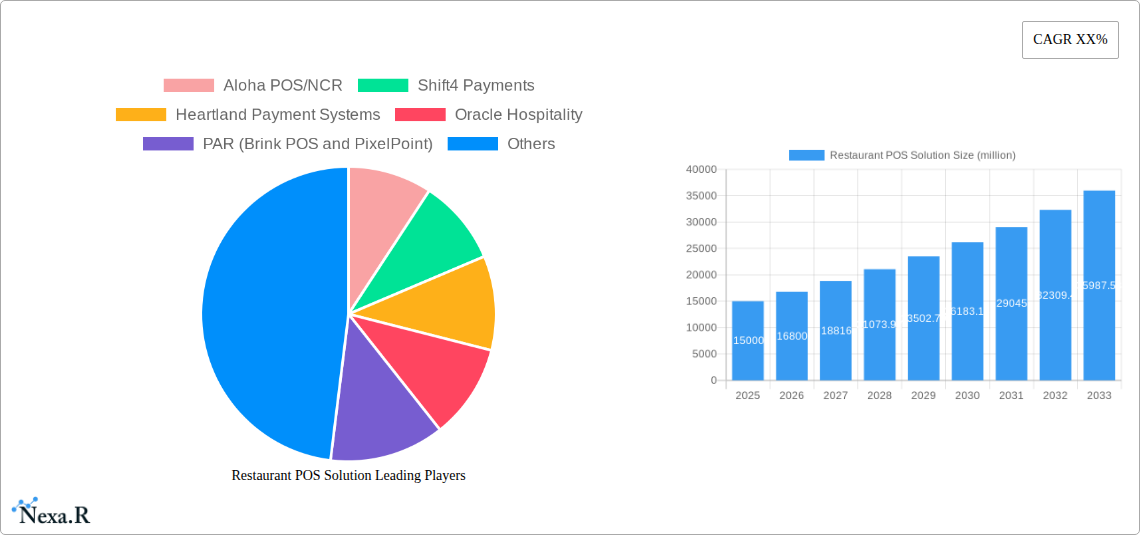
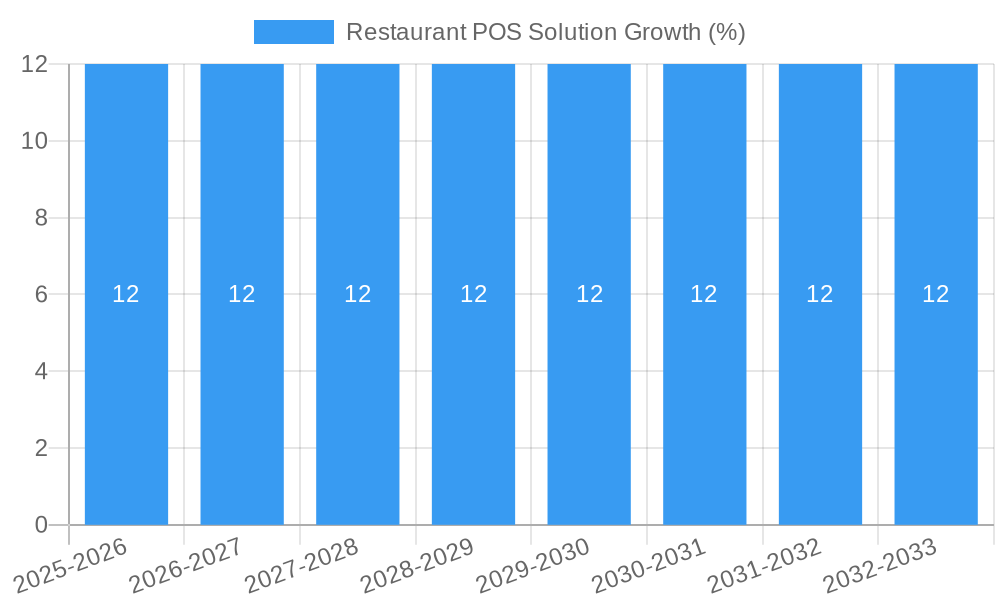
The global Restaurant POS Solution market is experiencing robust expansion, poised for significant growth driven by the increasing adoption of advanced technologies in the foodservice industry. With an estimated market size of approximately USD 15,000 million in 2025 and a projected Compound Annual Growth Rate (CAGR) of around 12% from 2025 to 2033, the market is set to reach an impressive valuation by the end of the forecast period. This growth is primarily fueled by the escalating demand for integrated POS systems that offer enhanced inventory management, customer relationship management (CRM), and streamlined order processing. The shift towards digital transformation, coupled with the need for improved operational efficiency and customer satisfaction, is compelling restaurants of all sizes, from full-service establishments (FSR) to quick-service restaurants (QSR), to invest in modern POS solutions. Cloud-based solutions are emerging as a dominant force due to their scalability, accessibility, and lower upfront costs, though hybrid models are also gaining traction to cater to diverse operational needs.
Key drivers such as the proliferation of mobile ordering, the rise of food delivery services, and the ongoing need for data-driven insights to optimize business strategies are propelling market advancement. These trends are further supported by the increasing internet penetration and smartphone usage globally, enabling seamless integration of POS systems with various digital platforms. However, the market also faces certain restraints, including the initial investment costs associated with sophisticated POS systems, concerns over data security and privacy, and the resistance to change from some traditional establishments. Despite these challenges, the overarching benefits of enhanced efficiency, improved customer experience, and valuable business analytics are expected to outweigh the limitations, ensuring a dynamic and expanding market for restaurant POS solutions in the coming years. The competitive landscape features a mix of established players and innovative startups, all vying to capture market share by offering feature-rich and user-friendly solutions.
Report Description: Restaurant POS Solution Market Dynamics & Outlook 2019-2033
This comprehensive report offers an in-depth analysis of the global Restaurant Point of Sale (POS) Solution market, encompassing its current dynamics, historical performance, and future trajectory. Designed for industry professionals, investors, and market strategists, this report provides actionable insights to navigate the evolving landscape of restaurant technology. The study meticulously covers the period from 2019 to 2033, with a base and estimated year of 2025, and a forecast period from 2025 to 2033, drawing upon historical data from 2019-2024. We integrate high-traffic keywords and analyze parent and child market segments to maximize search engine visibility and cater to a diverse audience seeking detailed restaurant POS system market insights.
Restaurant POS Solution Market Dynamics & Structure
The global Restaurant POS Solution market is characterized by a moderately concentrated competitive landscape, with key players like Aloha POS/NCR, Shift4 Payments, Heartland Payment Systems, Oracle Hospitality, PAR (Brink POS and PixelPoint), and Toast POS holding significant market share. Technological innovation is a primary driver, with advancements in cloud-based solutions, mobile POS, and integrated payment systems continuously reshaping offerings. Regulatory frameworks, particularly concerning data privacy and payment processing, influence market entry and operational strategies.
- Market Concentration: The top 5-7 players account for an estimated 60% of the market share, with increasing consolidation through mergers and acquisitions.
- Technological Innovation Drivers: Demand for enhanced customer experience, operational efficiency, inventory management, and data analytics fuels innovation.
- Regulatory Frameworks: Compliance with PCI DSS, GDPR, and local tax regulations is paramount.
- Competitive Product Substitutes: Traditional cash registers, manual order-taking, and basic billing software represent nascent substitutes, quickly being outpaced by advanced POS functionalities.
- End-User Demographics: A diverse range of restaurant types, from independent eateries to large chains, all seeking scalable and feature-rich POS solutions.
- M&A Trends: Expect approximately 8-12 significant M&A activities annually, driven by the desire for market expansion and technology acquisition.
Restaurant POS Solution Growth Trends & Insights
The global Restaurant POS Solution market is poised for substantial growth, driven by an increasing demand for operational efficiency, enhanced customer experiences, and digital transformation within the food service industry. The market size is projected to expand from approximately \$7.8 billion in 2024 to an estimated \$14.5 billion by 2033, exhibiting a Compound Annual Growth Rate (CAGR) of around 7.5% during the forecast period. This growth is fueled by rising adoption rates of cloud-based POS systems, which offer scalability, accessibility, and lower upfront costs, making them particularly attractive to small and medium-sized enterprises. Technological disruptions, such as the integration of artificial intelligence for predictive analytics, contactless payment solutions, and advanced customer relationship management (CRM) features, are further accelerating market penetration.
Consumer behavior shifts, including a growing preference for online ordering, delivery services, and personalized dining experiences, are compelling restaurants to invest in POS solutions that can seamlessly integrate with these channels. The proliferation of mobile POS devices and the increasing use of tablets for order taking and payment processing are transforming the traditional front-of-house operations. Furthermore, the demand for comprehensive data analytics to understand sales trends, customer preferences, and inventory management is pushing the adoption of sophisticated POS platforms. The QSR segment, in particular, is witnessing rapid adoption due to its high transaction volume and need for speed and efficiency. Meanwhile, the FSR segment is increasingly leveraging POS systems for more complex inventory management, table management, and loyalty programs. The overall market penetration of advanced POS solutions is expected to climb from roughly 65% in 2024 to over 85% by 2033, signifying a significant shift towards digitalized restaurant operations.
Dominant Regions, Countries, or Segments in Restaurant POS Solution
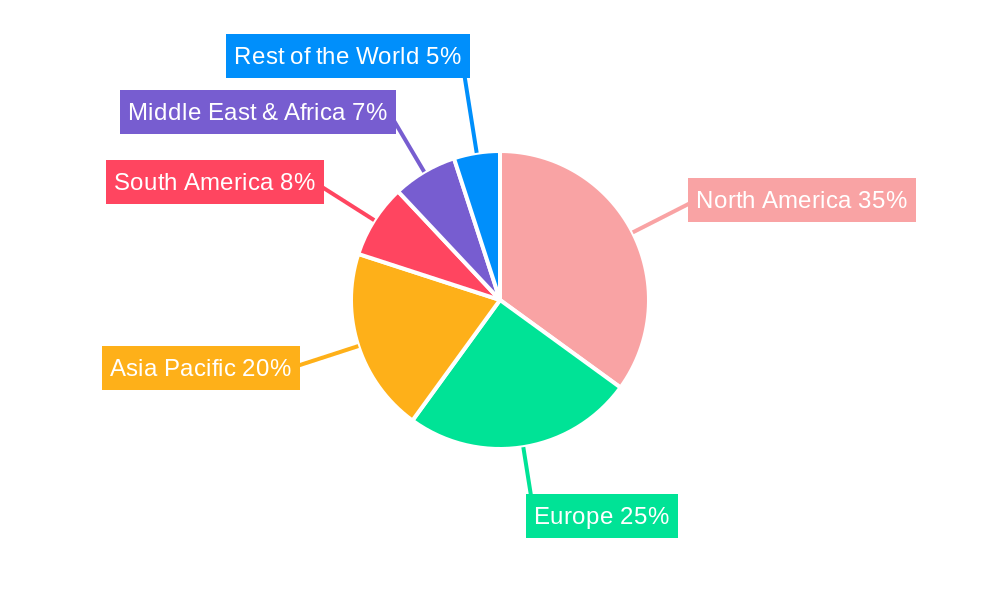
The global Restaurant POS Solution market's dominance is multifaceted, with certain regions and application segments showcasing particularly robust growth and adoption. North America consistently emerges as a leading region, driven by its mature restaurant industry, high disposable income, and early adoption of technological innovations. Within this region, the United States stands out due to its vast number of FSR and QSR establishments and a strong consumer appetite for digital convenience. The country's advanced payment infrastructure and supportive business environment further bolster the adoption of sophisticated POS solutions.
- Application Dominance: The QSR (Quick Service Restaurant) segment is a significant growth engine, projected to account for approximately 45% of the total market by 2033. This dominance is attributed to the high volume of transactions, the critical need for speed and efficiency in order processing and payment, and the widespread adoption of self-service kiosks and mobile ordering platforms. Key drivers in this segment include the demand for streamlined operations, reduced labor costs through automation, and enhanced customer throughput.
- Type Dominance: Cloud-Based POS solutions are experiencing unparalleled growth, expected to capture over 70% of the market share by 2033. Their dominance stems from inherent advantages such as scalability, remote accessibility, automatic updates, and lower initial investment compared to on-premise systems. The flexibility offered by cloud POS empowers businesses of all sizes to adapt to changing demands and integrate with various third-party applications.
- Regional Growth Drivers:
- North America: High disposable income, tech-savvy consumer base, and a competitive restaurant landscape demanding operational efficiency.
- Europe: Increasing adoption of digital payments, growing middle class, and evolving dining habits.
- Asia-Pacific: Rapid urbanization, a burgeoning food service sector, and a growing demand for modern technology solutions, particularly in countries like China, India, and Southeast Asian nations.
- Country-Specific Factors:
- United States: Strong emphasis on customer experience, integration of loyalty programs, and widespread use of mobile payments.
- United Kingdom: Growing adoption of cloud POS and mobile ordering, influenced by a dynamic culinary scene.
- Australia: High penetration of contactless payments and a demand for integrated inventory and sales management.
The combination of a robust restaurant industry, a technologically receptive consumer base, and the inherent benefits of cloud-based and QSR-focused solutions solidifies the dominance of these segments and regions in the global Restaurant POS Solution market.
Restaurant POS Solution Product Landscape
The product landscape of Restaurant POS Solutions is characterized by continuous innovation, focusing on integrated functionalities and enhanced user experiences. Modern POS systems offer a seamless blend of hardware and software, encompassing features like intuitive touch screen interfaces, cloud-based data management, robust inventory tracking, customer relationship management (CRM) tools, and integrated payment processing. Innovations like AI-powered analytics for sales forecasting, personalized customer recommendations, and automated staff scheduling are becoming increasingly prevalent.
The performance metrics that differentiate products include speed of transaction processing, reliability, ease of use for staff, and the breadth of integrations with third-party services such as online ordering platforms, delivery services, and accounting software. Unique selling propositions often revolve around specialized features for specific restaurant types (e.g., table management for FSR, order customization for QSR) and the level of customization and support provided.
Key Drivers, Barriers & Challenges in Restaurant POS Solution
Key Drivers:
The growth of the Restaurant POS Solution market is propelled by several critical drivers. The insatiable demand for enhanced operational efficiency and streamlined workflows within restaurants remains a primary catalyst. Technological advancements, particularly in cloud computing and mobile technology, have made sophisticated POS systems more accessible and affordable. The escalating need for improved customer experience, including faster service, personalized offers, and seamless payment options, further fuels adoption. Furthermore, government initiatives promoting digitalization and the growing trend of data-driven decision-making in the food service industry are significant growth accelerators.
Key Barriers & Challenges:
Despite the promising growth, the market faces notable barriers and challenges. The initial investment cost, although decreasing with cloud-based solutions, can still be a hurdle for smaller, independent restaurants. Concerns around data security and privacy, especially with the increasing volume of sensitive customer information handled by POS systems, pose a significant challenge. The complexity of integrating new POS systems with existing legacy infrastructure and the need for adequate staff training can also impede adoption. Furthermore, intense market competition leads to price pressures, and the constant evolution of technology requires ongoing investment in updates and upgrades.
Emerging Opportunities in Restaurant POS Solution
Emerging opportunities in the Restaurant POS Solution market are primarily centered around niche market segments and advanced functionalities. The "Others" application segment, which includes bars, cafes, food trucks, and catering services, presents a significant untapped market with unique operational needs. The development of specialized POS solutions tailored to these segments, offering simplified inventory, on-the-go payment options, and efficient order management, can unlock substantial growth.
The growing demand for enhanced dine-in experiences is creating opportunities for POS systems that integrate with table reservation apps, offer digital menus, and facilitate table-side ordering and payment. Furthermore, the increasing focus on sustainability and waste reduction presents an opportunity for POS solutions that offer advanced inventory forecasting and management tools to minimize food spoilage. The integration of AI for predictive ordering and personalized marketing campaigns is another area ripe for innovation and expansion.
Growth Accelerators in the Restaurant POS Solution Industry
Several key factors are acting as growth accelerators for the Restaurant POS Solution industry. The relentless pace of technological innovation, especially in areas like AI-driven analytics, contactless payments, and integration with third-party delivery and online ordering platforms, is consistently pushing the boundaries of what POS systems can achieve. Strategic partnerships between POS providers and payment processors, software developers, and hardware manufacturers are creating more comprehensive and valuable ecosystems for restaurateurs.
The ongoing digital transformation across the global food service sector, accelerated by changing consumer preferences for convenience and personalized experiences, is a powerful market expansion driver. As more restaurants recognize the competitive advantage offered by sophisticated POS systems in managing operations, understanding customer behavior, and optimizing sales, the demand for these solutions will continue to surge.
Key Players Shaping the Restaurant POS Solution Market
Aloha POS/NCR Shift4 Payments Heartland Payment Systems Oracle Hospitality PAR (Brink POS and PixelPoint) Toast POS ShopKeep Clover Network, Inc. Focus POS TouchBistro AccuPOS Revel Systems EZee Technosys SilverWare POS BIM POS FoodZaps Technology SoftTouch Squirrel Square
Notable Milestones in Restaurant POS Solution Sector
- 2019: Rise of cloud-native POS platforms and increased adoption of mobile POS for improved flexibility.
- 2020: Surge in demand for contactless payment solutions and integrated online ordering features due to the global pandemic.
- 2021: Significant M&A activity, with larger players acquiring innovative startups to expand their technology portfolios.
- 2022: Enhanced focus on AI and data analytics within POS systems for personalized customer experiences and operational insights.
- 2023: Integration of loyalty programs and customer relationship management (CRM) features becoming standard in mid-to-high-tier POS solutions.
- 2024: Growing emphasis on sustainability features within POS, such as waste reduction analytics and smart inventory management.
In-Depth Restaurant POS Solution Market Outlook
The Restaurant POS Solution market is set for sustained and accelerated growth in the coming years. Key growth accelerators include the continued evolution of cloud-based and hybrid POS models, offering unparalleled scalability and flexibility. The increasing demand for integrated payment solutions, including advanced contactless and mobile payment technologies, will further drive adoption. Furthermore, the ongoing digital transformation of the restaurant industry, coupled with evolving consumer expectations for seamless online ordering, delivery, and personalized dining experiences, will continue to fuel the need for sophisticated POS systems. Strategic partnerships and ongoing innovation in AI and data analytics will empower restaurants with deeper insights, leading to optimized operations and enhanced profitability, solidifying the market's upward trajectory.
Restaurant POS Solution Segmentation
-
1. Application
- 1.1. FSR (Full Service Restaurant)
- 1.2. QSR (Quick Service Restaurant)
- 1.3. Others
-
2. Types
- 2.1. Cloud-Based
- 2.2. On-Premise
- 2.3. Hybrid
Restaurant POS Solution Segmentation By Geography
-
1. North America
- 1.1. United States
- 1.2. Canada
- 1.3. Mexico
-
2. South America
- 2.1. Brazil
- 2.2. Argentina
- 2.3. Rest of South America
-
3. Europe
- 3.1. United Kingdom
- 3.2. Germany
- 3.3. France
- 3.4. Italy
- 3.5. Spain
- 3.6. Russia
- 3.7. Benelux
- 3.8. Nordics
- 3.9. Rest of Europe
-
4. Middle East & Africa
- 4.1. Turkey
- 4.2. Israel
- 4.3. GCC
- 4.4. North Africa
- 4.5. South Africa
- 4.6. Rest of Middle East & Africa
-
5. Asia Pacific
- 5.1. China
- 5.2. India
- 5.3. Japan
- 5.4. South Korea
- 5.5. ASEAN
- 5.6. Oceania
- 5.7. Rest of Asia Pacific
Restaurant POS Solution REPORT HIGHLIGHTS
| Aspects | Details |
|---|---|
| Study Period | 2019-2033 |
| Base Year | 2024 |
| Estimated Year | 2025 |
| Forecast Period | 2025-2033 |
| Historical Period | 2019-2024 |
| Growth Rate | CAGR of XX% from 2019-2033 |
| Segmentation |
|
Table of Contents
- 1. Introduction
- 1.1. Research Scope
- 1.2. Market Segmentation
- 1.3. Research Methodology
- 1.4. Definitions and Assumptions
- 2. Executive Summary
- 2.1. Introduction
- 3. Market Dynamics
- 3.1. Introduction
- 3.2. Market Drivers
- 3.3. Market Restrains
- 3.4. Market Trends
- 4. Market Factor Analysis
- 4.1. Porters Five Forces
- 4.2. Supply/Value Chain
- 4.3. PESTEL analysis
- 4.4. Market Entropy
- 4.5. Patent/Trademark Analysis
- 5. Global Restaurant POS Solution Analysis, Insights and Forecast, 2019-2031
- 5.1. Market Analysis, Insights and Forecast - by Application
- 5.1.1. FSR (Full Service Restaurant)
- 5.1.2. QSR (Quick Service Restaurant)
- 5.1.3. Others
- 5.2. Market Analysis, Insights and Forecast - by Types
- 5.2.1. Cloud-Based
- 5.2.2. On-Premise
- 5.2.3. Hybrid
- 5.3. Market Analysis, Insights and Forecast - by Region
- 5.3.1. North America
- 5.3.2. South America
- 5.3.3. Europe
- 5.3.4. Middle East & Africa
- 5.3.5. Asia Pacific
- 5.1. Market Analysis, Insights and Forecast - by Application
- 6. North America Restaurant POS Solution Analysis, Insights and Forecast, 2019-2031
- 6.1. Market Analysis, Insights and Forecast - by Application
- 6.1.1. FSR (Full Service Restaurant)
- 6.1.2. QSR (Quick Service Restaurant)
- 6.1.3. Others
- 6.2. Market Analysis, Insights and Forecast - by Types
- 6.2.1. Cloud-Based
- 6.2.2. On-Premise
- 6.2.3. Hybrid
- 6.1. Market Analysis, Insights and Forecast - by Application
- 7. South America Restaurant POS Solution Analysis, Insights and Forecast, 2019-2031
- 7.1. Market Analysis, Insights and Forecast - by Application
- 7.1.1. FSR (Full Service Restaurant)
- 7.1.2. QSR (Quick Service Restaurant)
- 7.1.3. Others
- 7.2. Market Analysis, Insights and Forecast - by Types
- 7.2.1. Cloud-Based
- 7.2.2. On-Premise
- 7.2.3. Hybrid
- 7.1. Market Analysis, Insights and Forecast - by Application
- 8. Europe Restaurant POS Solution Analysis, Insights and Forecast, 2019-2031
- 8.1. Market Analysis, Insights and Forecast - by Application
- 8.1.1. FSR (Full Service Restaurant)
- 8.1.2. QSR (Quick Service Restaurant)
- 8.1.3. Others
- 8.2. Market Analysis, Insights and Forecast - by Types
- 8.2.1. Cloud-Based
- 8.2.2. On-Premise
- 8.2.3. Hybrid
- 8.1. Market Analysis, Insights and Forecast - by Application
- 9. Middle East & Africa Restaurant POS Solution Analysis, Insights and Forecast, 2019-2031
- 9.1. Market Analysis, Insights and Forecast - by Application
- 9.1.1. FSR (Full Service Restaurant)
- 9.1.2. QSR (Quick Service Restaurant)
- 9.1.3. Others
- 9.2. Market Analysis, Insights and Forecast - by Types
- 9.2.1. Cloud-Based
- 9.2.2. On-Premise
- 9.2.3. Hybrid
- 9.1. Market Analysis, Insights and Forecast - by Application
- 10. Asia Pacific Restaurant POS Solution Analysis, Insights and Forecast, 2019-2031
- 10.1. Market Analysis, Insights and Forecast - by Application
- 10.1.1. FSR (Full Service Restaurant)
- 10.1.2. QSR (Quick Service Restaurant)
- 10.1.3. Others
- 10.2. Market Analysis, Insights and Forecast - by Types
- 10.2.1. Cloud-Based
- 10.2.2. On-Premise
- 10.2.3. Hybrid
- 10.1. Market Analysis, Insights and Forecast - by Application
- 11. Competitive Analysis
- 11.1. Global Market Share Analysis 2024
- 11.2. Company Profiles
- 11.2.1 Aloha POS/NCR
- 11.2.1.1. Overview
- 11.2.1.2. Products
- 11.2.1.3. SWOT Analysis
- 11.2.1.4. Recent Developments
- 11.2.1.5. Financials (Based on Availability)
- 11.2.2 Shift4 Payments
- 11.2.2.1. Overview
- 11.2.2.2. Products
- 11.2.2.3. SWOT Analysis
- 11.2.2.4. Recent Developments
- 11.2.2.5. Financials (Based on Availability)
- 11.2.3 Heartland Payment Systems
- 11.2.3.1. Overview
- 11.2.3.2. Products
- 11.2.3.3. SWOT Analysis
- 11.2.3.4. Recent Developments
- 11.2.3.5. Financials (Based on Availability)
- 11.2.4 Oracle Hospitality
- 11.2.4.1. Overview
- 11.2.4.2. Products
- 11.2.4.3. SWOT Analysis
- 11.2.4.4. Recent Developments
- 11.2.4.5. Financials (Based on Availability)
- 11.2.5 PAR (Brink POS and PixelPoint)
- 11.2.5.1. Overview
- 11.2.5.2. Products
- 11.2.5.3. SWOT Analysis
- 11.2.5.4. Recent Developments
- 11.2.5.5. Financials (Based on Availability)
- 11.2.6 Toast POS
- 11.2.6.1. Overview
- 11.2.6.2. Products
- 11.2.6.3. SWOT Analysis
- 11.2.6.4. Recent Developments
- 11.2.6.5. Financials (Based on Availability)
- 11.2.7 ShopKeep
- 11.2.7.1. Overview
- 11.2.7.2. Products
- 11.2.7.3. SWOT Analysis
- 11.2.7.4. Recent Developments
- 11.2.7.5. Financials (Based on Availability)
- 11.2.8 Clover Network
- 11.2.8.1. Overview
- 11.2.8.2. Products
- 11.2.8.3. SWOT Analysis
- 11.2.8.4. Recent Developments
- 11.2.8.5. Financials (Based on Availability)
- 11.2.9 Inc.
- 11.2.9.1. Overview
- 11.2.9.2. Products
- 11.2.9.3. SWOT Analysis
- 11.2.9.4. Recent Developments
- 11.2.9.5. Financials (Based on Availability)
- 11.2.10 Focus POS
- 11.2.10.1. Overview
- 11.2.10.2. Products
- 11.2.10.3. SWOT Analysis
- 11.2.10.4. Recent Developments
- 11.2.10.5. Financials (Based on Availability)
- 11.2.11 TouchBistro
- 11.2.11.1. Overview
- 11.2.11.2. Products
- 11.2.11.3. SWOT Analysis
- 11.2.11.4. Recent Developments
- 11.2.11.5. Financials (Based on Availability)
- 11.2.12 AccuPOS
- 11.2.12.1. Overview
- 11.2.12.2. Products
- 11.2.12.3. SWOT Analysis
- 11.2.12.4. Recent Developments
- 11.2.12.5. Financials (Based on Availability)
- 11.2.13 Revel Systems
- 11.2.13.1. Overview
- 11.2.13.2. Products
- 11.2.13.3. SWOT Analysis
- 11.2.13.4. Recent Developments
- 11.2.13.5. Financials (Based on Availability)
- 11.2.14 EZee Technosys
- 11.2.14.1. Overview
- 11.2.14.2. Products
- 11.2.14.3. SWOT Analysis
- 11.2.14.4. Recent Developments
- 11.2.14.5. Financials (Based on Availability)
- 11.2.15 SilverWare POS
- 11.2.15.1. Overview
- 11.2.15.2. Products
- 11.2.15.3. SWOT Analysis
- 11.2.15.4. Recent Developments
- 11.2.15.5. Financials (Based on Availability)
- 11.2.16 BIM POS
- 11.2.16.1. Overview
- 11.2.16.2. Products
- 11.2.16.3. SWOT Analysis
- 11.2.16.4. Recent Developments
- 11.2.16.5. Financials (Based on Availability)
- 11.2.17 FoodZaps Technology
- 11.2.17.1. Overview
- 11.2.17.2. Products
- 11.2.17.3. SWOT Analysis
- 11.2.17.4. Recent Developments
- 11.2.17.5. Financials (Based on Availability)
- 11.2.18 SoftTouch
- 11.2.18.1. Overview
- 11.2.18.2. Products
- 11.2.18.3. SWOT Analysis
- 11.2.18.4. Recent Developments
- 11.2.18.5. Financials (Based on Availability)
- 11.2.19 Squirrel
- 11.2.19.1. Overview
- 11.2.19.2. Products
- 11.2.19.3. SWOT Analysis
- 11.2.19.4. Recent Developments
- 11.2.19.5. Financials (Based on Availability)
- 11.2.20 Square
- 11.2.20.1. Overview
- 11.2.20.2. Products
- 11.2.20.3. SWOT Analysis
- 11.2.20.4. Recent Developments
- 11.2.20.5. Financials (Based on Availability)
- 11.2.1 Aloha POS/NCR
List of Figures
- Figure 1: Global Restaurant POS Solution Revenue Breakdown (million, %) by Region 2024 & 2032
- Figure 2: North America Restaurant POS Solution Revenue (million), by Application 2024 & 2032
- Figure 3: North America Restaurant POS Solution Revenue Share (%), by Application 2024 & 2032
- Figure 4: North America Restaurant POS Solution Revenue (million), by Types 2024 & 2032
- Figure 5: North America Restaurant POS Solution Revenue Share (%), by Types 2024 & 2032
- Figure 6: North America Restaurant POS Solution Revenue (million), by Country 2024 & 2032
- Figure 7: North America Restaurant POS Solution Revenue Share (%), by Country 2024 & 2032
- Figure 8: South America Restaurant POS Solution Revenue (million), by Application 2024 & 2032
- Figure 9: South America Restaurant POS Solution Revenue Share (%), by Application 2024 & 2032
- Figure 10: South America Restaurant POS Solution Revenue (million), by Types 2024 & 2032
- Figure 11: South America Restaurant POS Solution Revenue Share (%), by Types 2024 & 2032
- Figure 12: South America Restaurant POS Solution Revenue (million), by Country 2024 & 2032
- Figure 13: South America Restaurant POS Solution Revenue Share (%), by Country 2024 & 2032
- Figure 14: Europe Restaurant POS Solution Revenue (million), by Application 2024 & 2032
- Figure 15: Europe Restaurant POS Solution Revenue Share (%), by Application 2024 & 2032
- Figure 16: Europe Restaurant POS Solution Revenue (million), by Types 2024 & 2032
- Figure 17: Europe Restaurant POS Solution Revenue Share (%), by Types 2024 & 2032
- Figure 18: Europe Restaurant POS Solution Revenue (million), by Country 2024 & 2032
- Figure 19: Europe Restaurant POS Solution Revenue Share (%), by Country 2024 & 2032
- Figure 20: Middle East & Africa Restaurant POS Solution Revenue (million), by Application 2024 & 2032
- Figure 21: Middle East & Africa Restaurant POS Solution Revenue Share (%), by Application 2024 & 2032
- Figure 22: Middle East & Africa Restaurant POS Solution Revenue (million), by Types 2024 & 2032
- Figure 23: Middle East & Africa Restaurant POS Solution Revenue Share (%), by Types 2024 & 2032
- Figure 24: Middle East & Africa Restaurant POS Solution Revenue (million), by Country 2024 & 2032
- Figure 25: Middle East & Africa Restaurant POS Solution Revenue Share (%), by Country 2024 & 2032
- Figure 26: Asia Pacific Restaurant POS Solution Revenue (million), by Application 2024 & 2032
- Figure 27: Asia Pacific Restaurant POS Solution Revenue Share (%), by Application 2024 & 2032
- Figure 28: Asia Pacific Restaurant POS Solution Revenue (million), by Types 2024 & 2032
- Figure 29: Asia Pacific Restaurant POS Solution Revenue Share (%), by Types 2024 & 2032
- Figure 30: Asia Pacific Restaurant POS Solution Revenue (million), by Country 2024 & 2032
- Figure 31: Asia Pacific Restaurant POS Solution Revenue Share (%), by Country 2024 & 2032
List of Tables
- Table 1: Global Restaurant POS Solution Revenue million Forecast, by Region 2019 & 2032
- Table 2: Global Restaurant POS Solution Revenue million Forecast, by Application 2019 & 2032
- Table 3: Global Restaurant POS Solution Revenue million Forecast, by Types 2019 & 2032
- Table 4: Global Restaurant POS Solution Revenue million Forecast, by Region 2019 & 2032
- Table 5: Global Restaurant POS Solution Revenue million Forecast, by Application 2019 & 2032
- Table 6: Global Restaurant POS Solution Revenue million Forecast, by Types 2019 & 2032
- Table 7: Global Restaurant POS Solution Revenue million Forecast, by Country 2019 & 2032
- Table 8: United States Restaurant POS Solution Revenue (million) Forecast, by Application 2019 & 2032
- Table 9: Canada Restaurant POS Solution Revenue (million) Forecast, by Application 2019 & 2032
- Table 10: Mexico Restaurant POS Solution Revenue (million) Forecast, by Application 2019 & 2032
- Table 11: Global Restaurant POS Solution Revenue million Forecast, by Application 2019 & 2032
- Table 12: Global Restaurant POS Solution Revenue million Forecast, by Types 2019 & 2032
- Table 13: Global Restaurant POS Solution Revenue million Forecast, by Country 2019 & 2032
- Table 14: Brazil Restaurant POS Solution Revenue (million) Forecast, by Application 2019 & 2032
- Table 15: Argentina Restaurant POS Solution Revenue (million) Forecast, by Application 2019 & 2032
- Table 16: Rest of South America Restaurant POS Solution Revenue (million) Forecast, by Application 2019 & 2032
- Table 17: Global Restaurant POS Solution Revenue million Forecast, by Application 2019 & 2032
- Table 18: Global Restaurant POS Solution Revenue million Forecast, by Types 2019 & 2032
- Table 19: Global Restaurant POS Solution Revenue million Forecast, by Country 2019 & 2032
- Table 20: United Kingdom Restaurant POS Solution Revenue (million) Forecast, by Application 2019 & 2032
- Table 21: Germany Restaurant POS Solution Revenue (million) Forecast, by Application 2019 & 2032
- Table 22: France Restaurant POS Solution Revenue (million) Forecast, by Application 2019 & 2032
- Table 23: Italy Restaurant POS Solution Revenue (million) Forecast, by Application 2019 & 2032
- Table 24: Spain Restaurant POS Solution Revenue (million) Forecast, by Application 2019 & 2032
- Table 25: Russia Restaurant POS Solution Revenue (million) Forecast, by Application 2019 & 2032
- Table 26: Benelux Restaurant POS Solution Revenue (million) Forecast, by Application 2019 & 2032
- Table 27: Nordics Restaurant POS Solution Revenue (million) Forecast, by Application 2019 & 2032
- Table 28: Rest of Europe Restaurant POS Solution Revenue (million) Forecast, by Application 2019 & 2032
- Table 29: Global Restaurant POS Solution Revenue million Forecast, by Application 2019 & 2032
- Table 30: Global Restaurant POS Solution Revenue million Forecast, by Types 2019 & 2032
- Table 31: Global Restaurant POS Solution Revenue million Forecast, by Country 2019 & 2032
- Table 32: Turkey Restaurant POS Solution Revenue (million) Forecast, by Application 2019 & 2032
- Table 33: Israel Restaurant POS Solution Revenue (million) Forecast, by Application 2019 & 2032
- Table 34: GCC Restaurant POS Solution Revenue (million) Forecast, by Application 2019 & 2032
- Table 35: North Africa Restaurant POS Solution Revenue (million) Forecast, by Application 2019 & 2032
- Table 36: South Africa Restaurant POS Solution Revenue (million) Forecast, by Application 2019 & 2032
- Table 37: Rest of Middle East & Africa Restaurant POS Solution Revenue (million) Forecast, by Application 2019 & 2032
- Table 38: Global Restaurant POS Solution Revenue million Forecast, by Application 2019 & 2032
- Table 39: Global Restaurant POS Solution Revenue million Forecast, by Types 2019 & 2032
- Table 40: Global Restaurant POS Solution Revenue million Forecast, by Country 2019 & 2032
- Table 41: China Restaurant POS Solution Revenue (million) Forecast, by Application 2019 & 2032
- Table 42: India Restaurant POS Solution Revenue (million) Forecast, by Application 2019 & 2032
- Table 43: Japan Restaurant POS Solution Revenue (million) Forecast, by Application 2019 & 2032
- Table 44: South Korea Restaurant POS Solution Revenue (million) Forecast, by Application 2019 & 2032
- Table 45: ASEAN Restaurant POS Solution Revenue (million) Forecast, by Application 2019 & 2032
- Table 46: Oceania Restaurant POS Solution Revenue (million) Forecast, by Application 2019 & 2032
- Table 47: Rest of Asia Pacific Restaurant POS Solution Revenue (million) Forecast, by Application 2019 & 2032
Frequently Asked Questions
1. What is the projected Compound Annual Growth Rate (CAGR) of the Restaurant POS Solution?
The projected CAGR is approximately XX%.
2. Which companies are prominent players in the Restaurant POS Solution?
Key companies in the market include Aloha POS/NCR, Shift4 Payments, Heartland Payment Systems, Oracle Hospitality, PAR (Brink POS and PixelPoint), Toast POS, ShopKeep, Clover Network, Inc., Focus POS, TouchBistro, AccuPOS, Revel Systems, EZee Technosys, SilverWare POS, BIM POS, FoodZaps Technology, SoftTouch, Squirrel, Square.
3. What are the main segments of the Restaurant POS Solution?
The market segments include Application, Types.
4. Can you provide details about the market size?
The market size is estimated to be USD XXX million as of 2022.
5. What are some drivers contributing to market growth?
N/A
6. What are the notable trends driving market growth?
N/A
7. Are there any restraints impacting market growth?
N/A
8. Can you provide examples of recent developments in the market?
N/A
9. What pricing options are available for accessing the report?
Pricing options include single-user, multi-user, and enterprise licenses priced at USD 2900.00, USD 4350.00, and USD 5800.00 respectively.
10. Is the market size provided in terms of value or volume?
The market size is provided in terms of value, measured in million.
11. Are there any specific market keywords associated with the report?
Yes, the market keyword associated with the report is "Restaurant POS Solution," which aids in identifying and referencing the specific market segment covered.
12. How do I determine which pricing option suits my needs best?
The pricing options vary based on user requirements and access needs. Individual users may opt for single-user licenses, while businesses requiring broader access may choose multi-user or enterprise licenses for cost-effective access to the report.
13. Are there any additional resources or data provided in the Restaurant POS Solution report?
While the report offers comprehensive insights, it's advisable to review the specific contents or supplementary materials provided to ascertain if additional resources or data are available.
14. How can I stay updated on further developments or reports in the Restaurant POS Solution?
To stay informed about further developments, trends, and reports in the Restaurant POS Solution, consider subscribing to industry newsletters, following relevant companies and organizations, or regularly checking reputable industry news sources and publications.
Methodology
Step 1 - Identification of Relevant Samples Size from Population Database


Step 2 - Approaches for Defining Global Market Size (Value, Volume* & Price*)

Note*: In applicable scenarios
Step 3 - Data Sources
Primary Research
- Web Analytics
- Survey Reports
- Research Institute
- Latest Research Reports
- Opinion Leaders
Secondary Research
- Annual Reports
- White Paper
- Latest Press Release
- Industry Association
- Paid Database
- Investor Presentations

Step 4 - Data Triangulation
Involves using different sources of information in order to increase the validity of a study
These sources are likely to be stakeholders in a program - participants, other researchers, program staff, other community members, and so on.
Then we put all data in single framework & apply various statistical tools to find out the dynamic on the market.
During the analysis stage, feedback from the stakeholder groups would be compared to determine areas of agreement as well as areas of divergence
