

Key Insights
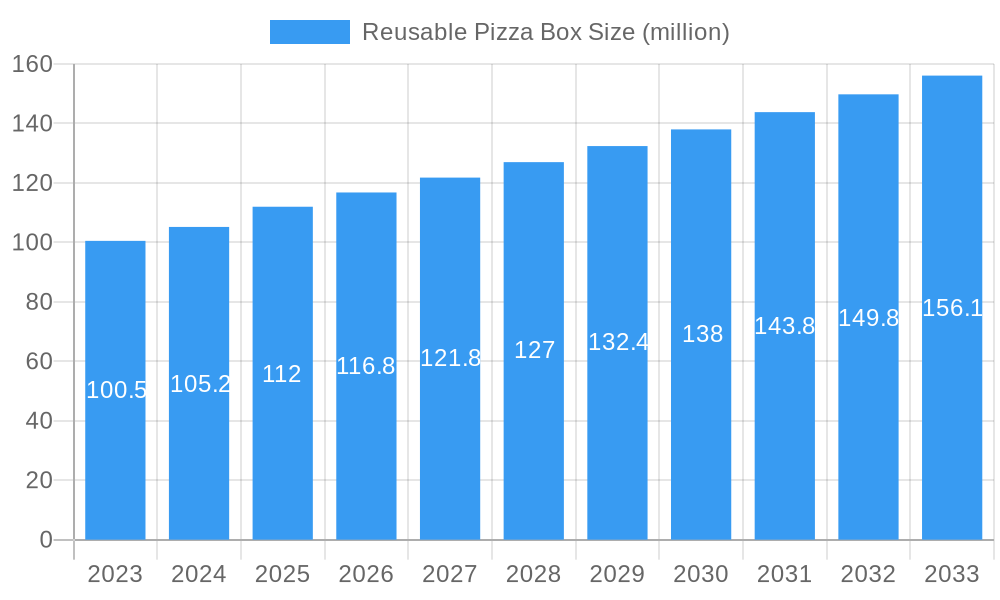
The global reusable pizza box market is poised for significant expansion, projected to reach $112 million by 2025, with a robust Compound Annual Growth Rate (CAGR) of 3.9% expected to drive its trajectory through 2033. This growth is primarily fueled by a rising consumer consciousness regarding environmental sustainability and a growing demand for eco-friendly packaging solutions within the food service industry. As regulatory pressures intensify to reduce single-use plastics and other disposable materials, the adoption of reusable pizza boxes by pizza shops and fast-food establishments is becoming increasingly strategic. Innovations in material science, particularly advancements in durable, food-safe plastics and advanced paper-based solutions, are enhancing the appeal and practicality of these alternatives, addressing concerns related to hygiene, durability, and ease of cleaning. The market's expansion is further bolstered by the increasing prevalence of subscription-based food delivery services and meal kit companies that are actively seeking sustainable packaging to align with their brand ethos and customer expectations.
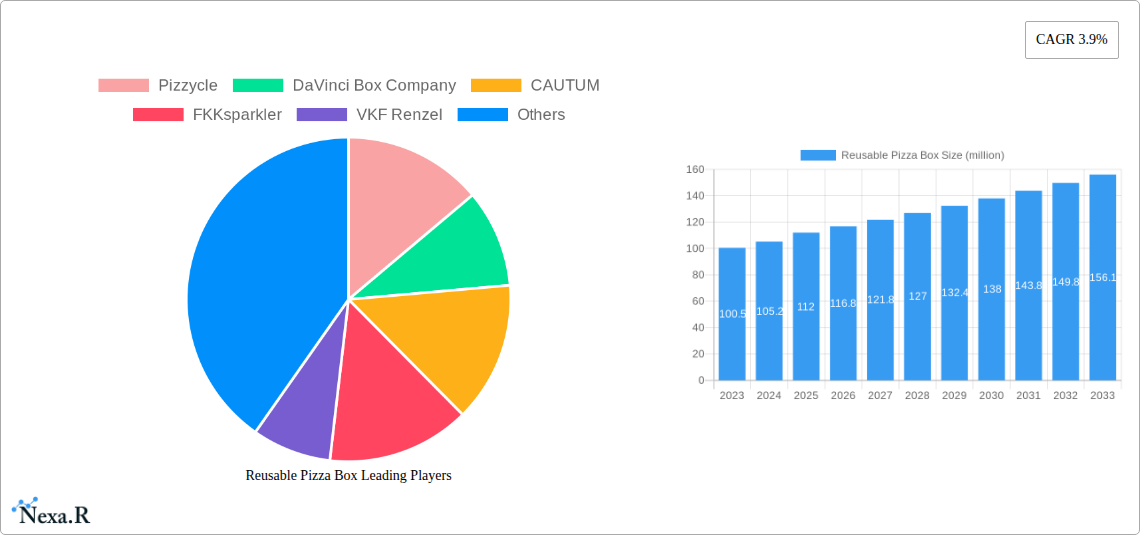
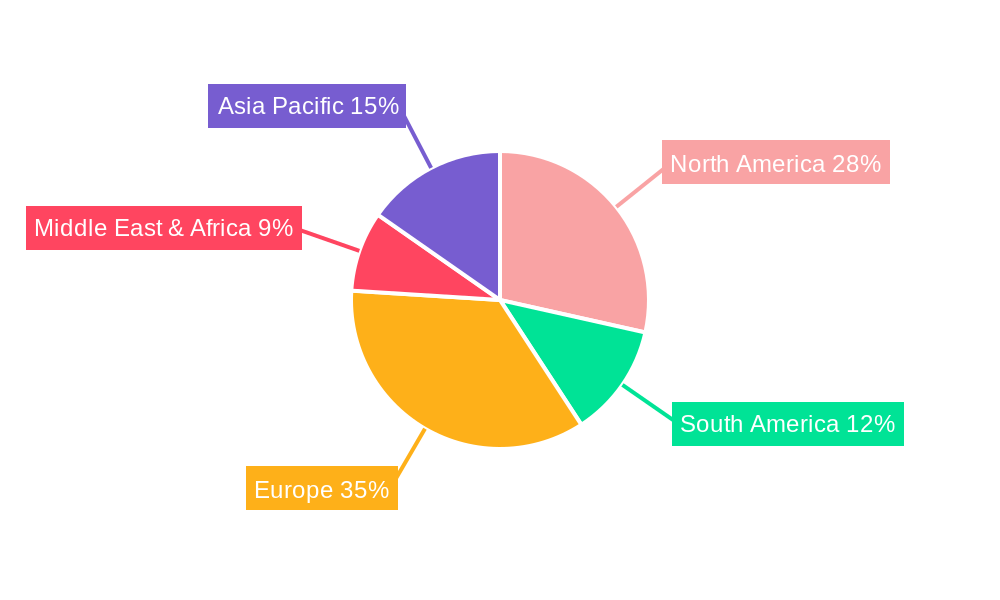
Reusable Pizza Box Market Size (In Million)
The market is segmented by application, with "Pizza Shops" and "Fast Food Shops" emerging as the dominant segments due to the high volume of pizza and takeout orders. However, the "Others" segment, encompassing a variety of food service providers and potentially home use, is also anticipated to witness steady growth as awareness and availability of reusable options increase. In terms of types, "Plastic" reusable pizza boxes are likely to lead the market due to their inherent durability, ease of cleaning, and cost-effectiveness over their lifecycle, while "Paper" and "Silica Gel" alternatives will cater to specific niches demanding different properties or perceived environmental benefits. Geographically, the Asia Pacific region, driven by the large populations and burgeoning food delivery culture in countries like China and India, is expected to emerge as a key growth engine, alongside established markets in North America and Europe, which benefit from strong environmental regulations and consumer demand for sustainable products. Companies like Pizzycle, DaVinci Box Company, CAUTUM, FKKsparkler, and VKF Renzel are at the forefront, innovating and expanding their offerings to capture this dynamic market.
Reusable Pizza Box Company Market Share
Reusable Pizza Box Market Report: Sustainable Solutions for a Growing Industry
This comprehensive report delves into the dynamic reusable pizza box market, analyzing its structure, growth trajectories, regional dominance, product innovations, and the intricate interplay of drivers, barriers, and emerging opportunities. With a focus on sustainable packaging solutions, this study examines the landscape from 2019 to 2033, providing actionable insights for industry stakeholders. The report leverages extensive data and expert analysis to forecast market evolution, CAGR, and penetration rates, offering a clear roadmap for navigating the future of pizza packaging.
Reusable Pizza Box Market Dynamics & Structure
The global reusable pizza box market is characterized by a moderate level of concentration, with key players like Pizzycle, DaVinci Box Company, CAUTUM, FKKsparkler, and VKF Renzel actively driving innovation and market penetration. Technological advancements in material science and design are the primary innovation drivers, focusing on durability, hygiene, and cost-effectiveness. Regulatory frameworks are increasingly favoring sustainable packaging options, pushing businesses towards eco-friendly alternatives to traditional disposable pizza boxes. Competitive product substitutes, primarily improved single-use paper and cardboard boxes, pose a challenge, but the long-term environmental and cost-saving benefits of reusable solutions are gaining traction. End-user demographics are shifting, with a growing segment of environmentally conscious consumers and businesses seeking to reduce their carbon footprint. Mergers and acquisitions (M&A) trends are observed as larger packaging firms acquire or partner with innovative reusable packaging startups to gain a competitive edge and expand their product portfolios. The market is poised for significant transformation as sustainability becomes a core operational imperative across the food service industry.
- Market Concentration: Moderate, with a few key innovators and a growing number of niche players.
- Technological Innovation Drivers: Advanced polymers, biodegradable materials, smart tracking features, and improved cleaning technologies.
- Regulatory Frameworks: Growing government mandates and incentives for waste reduction and circular economy models.
- Competitive Product Substitutes: Enhanced biodegradable single-use boxes, but limited long-term cost-efficiency.
- End-User Demographics: Increasing adoption by environmentally conscious pizza shops, fast food chains, and corporate catering services.
- M&A Trends: Strategic acquisitions of reusable packaging specialists by established players to gain market share and technological expertise.
Reusable Pizza Box Growth Trends & Insights
The reusable pizza box market is experiencing robust growth, driven by a confluence of environmental consciousness, economic advantages, and technological advancements. The market size evolution from a nascent stage in the historical period (2019-2024) to a projected significant expansion during the forecast period (2025-2033) signifies a major shift in packaging preferences. The adoption rates are steadily increasing as businesses recognize the long-term cost savings associated with reduced disposable box expenditure and waste management fees. Technological disruptions are at the forefront, with innovations in materials like advanced plastics and bio-composites offering enhanced durability, insulation, and ease of cleaning. Furthermore, the development of smart tracking systems embedded within reusable boxes allows for efficient inventory management and reduces the risk of loss. Consumer behavior shifts are a pivotal factor, with an increasing demand for sustainable practices from food service providers. This pressure from the consumer base compels businesses to invest in eco-friendly packaging solutions like reusable pizza boxes. The CAGR is projected to be substantial, reflecting the market's transition from niche adoption to mainstream acceptance. Market penetration is expected to rise significantly as more pizza shops and fast-food establishments integrate reusable boxes into their operational models, driven by both regulatory push and market pull. The estimated market size in 2025 is projected to reach xx million units, with a projected growth to xx million units by 2033.
Dominant Regions, Countries, or Segments in Reusable Pizza Box
The Pizza Shop segment, within the Application category, is currently the dominant force driving growth in the reusable pizza box market. This is largely attributed to the high volume of pizza consumption and the direct interaction pizza shops have with their end customers, creating a strong feedback loop for adopting sustainable practices. Geographically, North America is emerging as a leading region, propelled by robust environmental regulations, increasing consumer awareness, and a well-established fast-food culture. Countries like the United States and Canada are at the forefront, with a growing number of pizza chains actively piloting and implementing reusable packaging solutions.
- Dominant Application Segment: Pizza Shop
- Market Share: Anticipated to hold over 60% of the market share by 2028.
- Key Drivers: High volume of pizza sales, direct customer interaction for feedback and adoption, and the clear visibility of environmental impact.
- Growth Potential: Significant, as more independent and chain pizza businesses recognize the long-term cost savings and brand enhancement from sustainable packaging.
- Dominant Region: North America
- Market Share: Expected to command approximately 40% of the global reusable pizza box market by 2027.
- Key Drivers: Stringent waste reduction policies, proactive government initiatives supporting circular economy models, and a strong consumer preference for eco-friendly products.
- Infrastructure: Well-developed logistics for collection, cleaning, and redistribution of reusable packaging.
- Dominant Type: Plastic
- Market Share: Likely to account for over 55% of the market by 2029.
- Advantages: Durability, ease of cleaning, water resistance, and cost-effectiveness over multiple uses.
- Innovation Focus: Development of recycled and bio-based plastics to further enhance sustainability credentials.
Reusable Pizza Box Product Landscape
The reusable pizza box market is witnessing a wave of product innovation focused on enhancing user experience and environmental impact. Key advancements include the development of durable, food-grade plastic boxes with improved insulation properties to maintain pizza temperature and freshness during delivery. Innovations in materials such as polypropylene and polyethylene are common, offering a balance of resilience and recyclability. Some manufacturers are exploring hybrid models, incorporating biodegradable or compostable components alongside reusable structures. Performance metrics are centered on the number of wash cycles, resistance to stains and odors, and ease of cleaning, with leading products achieving hundreds of wash cycles. Unique selling propositions often lie in stackable designs for efficient storage, integrated locking mechanisms for secure transport, and aesthetic appeal that complements a restaurant's brand.
Key Drivers, Barriers & Challenges in Reusable Pizza Box
Key Drivers:
The reusable pizza box market is propelled by a powerful synergy of factors. Growing environmental concerns and increasing consumer demand for sustainable practices are primary catalysts. Regulatory pressures from governments worldwide, mandating waste reduction and promoting circular economy models, are further accelerating adoption. The long-term economic benefits, including reduced spending on disposable packaging and waste disposal fees, present a compelling case for businesses. Technological advancements in material science, leading to more durable, hygienic, and cost-effective reusable options, also play a crucial role.
Barriers & Challenges:
Despite the positive trajectory, the market faces significant hurdles. Initial investment costs for reusable boxes and the necessary cleaning infrastructure can be a barrier for smaller businesses. Maintaining strict hygiene standards and ensuring efficient collection, washing, and redistribution logistics present operational challenges. Consumer perception and behavioral inertia, accustomed to disposable packaging, require education and incentivization. Supply chain complexities in sourcing and managing reusable packaging fleets, coupled with potential damage or loss of boxes, also need to be addressed. Competition from highly efficient and increasingly sustainable single-use packaging alternatives remains a constant pressure. The estimated market size in 2025 is xx million units.
Emerging Opportunities in Reusable Pizza Box
Emerging opportunities in the reusable pizza box sector lie in catering to niche markets and embracing innovative applications. The expansion into corporate catering, event venues, and institutional food services presents untapped potential. Developing smart reusable boxes with integrated QR codes or RFID tags for enhanced tracking and inventory management can offer significant value-added services. Furthermore, collaborations with food delivery platforms to streamline the return and exchange process of reusable packaging can foster wider adoption. The growing trend of subscription-based models for reusable packaging services also offers a promising avenue for recurring revenue and customer loyalty. The market is projected to reach xx million units by 2033.
Growth Accelerators in the Reusable Pizza Box Industry
Several catalysts are poised to accelerate long-term growth in the reusable pizza box industry. Continued technological breakthroughs in material science, focusing on lighter, stronger, and more easily sanitized materials, will drive down costs and improve performance. Strategic partnerships between reusable packaging providers, pizza chains, and waste management companies will create robust ecosystems for efficient deployment and management. Government incentives, such as tax breaks for businesses adopting reusable packaging or subsidies for cleaning infrastructure, will significantly bolster market penetration. The increasing focus on corporate social responsibility (CSR) by major food service companies will also act as a powerful growth accelerator as they integrate reusable packaging into their sustainability goals.
Key Players Shaping the Reusable Pizza Box Market
- Pizzycle
- DaVinci Box Company
- CAUTUM
- FKKsparkler
- VKF Renzel
Notable Milestones in Reusable Pizza Box Sector
- 2020: Launch of advanced, stackable plastic reusable pizza box designs with improved insulation.
- 2021: Major fast-food chains begin pilot programs for reusable pizza box delivery in select urban areas.
- 2022: Development of specialized cleaning and sanitization protocols for food-grade reusable packaging.
- 2023: Increased regulatory focus on reducing single-use packaging waste by local governments.
- 2024: Introduction of bio-based plastic alternatives for reusable pizza boxes.
In-Depth Reusable Pizza Box Market Outlook
The reusable pizza box market is set for significant expansion, driven by a strong confluence of environmental imperatives and economic advantages. Growth accelerators, including ongoing material science innovations and strategic industry collaborations, will pave the way for widespread adoption. As regulatory frameworks evolve and consumer demand for sustainable solutions intensifies, businesses are increasingly recognizing the long-term value proposition of reusable packaging. The projected market size of xx million units by 2033 underscores the substantial growth potential, making it a critical sector for investment and strategic planning within the food service and packaging industries. The market is expected to reach xx million units by 2033.
Reusable Pizza Box Segmentation
-
1. Application
- 1.1. Pizza Shop
- 1.2. Fast Food Shop
- 1.3. Others
-
2. Types
- 2.1. Plastic
- 2.2. Paper
- 2.3. Silica Gel
Reusable Pizza Box Segmentation By Geography
-
1. North America
- 1.1. United States
- 1.2. Canada
- 1.3. Mexico
-
2. South America
- 2.1. Brazil
- 2.2. Argentina
- 2.3. Rest of South America
-
3. Europe
- 3.1. United Kingdom
- 3.2. Germany
- 3.3. France
- 3.4. Italy
- 3.5. Spain
- 3.6. Russia
- 3.7. Benelux
- 3.8. Nordics
- 3.9. Rest of Europe
-
4. Middle East & Africa
- 4.1. Turkey
- 4.2. Israel
- 4.3. GCC
- 4.4. North Africa
- 4.5. South Africa
- 4.6. Rest of Middle East & Africa
-
5. Asia Pacific
- 5.1. China
- 5.2. India
- 5.3. Japan
- 5.4. South Korea
- 5.5. ASEAN
- 5.6. Oceania
- 5.7. Rest of Asia Pacific
Reusable Pizza Box Regional Market Share
Geographic Coverage of Reusable Pizza Box
Reusable Pizza Box REPORT HIGHLIGHTS
| Aspects | Details |
|---|---|
| Study Period | 2020-2034 |
| Base Year | 2025 |
| Estimated Year | 2026 |
| Forecast Period | 2026-2034 |
| Historical Period | 2020-2025 |
| Growth Rate | CAGR of 3.9% from 2020-2034 |
| Segmentation |
|
Table of Contents
- 1. Introduction
- 1.1. Research Scope
- 1.2. Market Segmentation
- 1.3. Research Methodology
- 1.4. Definitions and Assumptions
- 2. Executive Summary
- 2.1. Introduction
- 3. Market Dynamics
- 3.1. Introduction
- 3.2. Market Drivers
- 3.3. Market Restrains
- 3.4. Market Trends
- 4. Market Factor Analysis
- 4.1. Porters Five Forces
- 4.2. Supply/Value Chain
- 4.3. PESTEL analysis
- 4.4. Market Entropy
- 4.5. Patent/Trademark Analysis
- 5. Global Reusable Pizza Box Analysis, Insights and Forecast, 2020-2032
- 5.1. Market Analysis, Insights and Forecast - by Application
- 5.1.1. Pizza Shop
- 5.1.2. Fast Food Shop
- 5.1.3. Others
- 5.2. Market Analysis, Insights and Forecast - by Types
- 5.2.1. Plastic
- 5.2.2. Paper
- 5.2.3. Silica Gel
- 5.3. Market Analysis, Insights and Forecast - by Region
- 5.3.1. North America
- 5.3.2. South America
- 5.3.3. Europe
- 5.3.4. Middle East & Africa
- 5.3.5. Asia Pacific
- 5.1. Market Analysis, Insights and Forecast - by Application
- 6. North America Reusable Pizza Box Analysis, Insights and Forecast, 2020-2032
- 6.1. Market Analysis, Insights and Forecast - by Application
- 6.1.1. Pizza Shop
- 6.1.2. Fast Food Shop
- 6.1.3. Others
- 6.2. Market Analysis, Insights and Forecast - by Types
- 6.2.1. Plastic
- 6.2.2. Paper
- 6.2.3. Silica Gel
- 6.1. Market Analysis, Insights and Forecast - by Application
- 7. South America Reusable Pizza Box Analysis, Insights and Forecast, 2020-2032
- 7.1. Market Analysis, Insights and Forecast - by Application
- 7.1.1. Pizza Shop
- 7.1.2. Fast Food Shop
- 7.1.3. Others
- 7.2. Market Analysis, Insights and Forecast - by Types
- 7.2.1. Plastic
- 7.2.2. Paper
- 7.2.3. Silica Gel
- 7.1. Market Analysis, Insights and Forecast - by Application
- 8. Europe Reusable Pizza Box Analysis, Insights and Forecast, 2020-2032
- 8.1. Market Analysis, Insights and Forecast - by Application
- 8.1.1. Pizza Shop
- 8.1.2. Fast Food Shop
- 8.1.3. Others
- 8.2. Market Analysis, Insights and Forecast - by Types
- 8.2.1. Plastic
- 8.2.2. Paper
- 8.2.3. Silica Gel
- 8.1. Market Analysis, Insights and Forecast - by Application
- 9. Middle East & Africa Reusable Pizza Box Analysis, Insights and Forecast, 2020-2032
- 9.1. Market Analysis, Insights and Forecast - by Application
- 9.1.1. Pizza Shop
- 9.1.2. Fast Food Shop
- 9.1.3. Others
- 9.2. Market Analysis, Insights and Forecast - by Types
- 9.2.1. Plastic
- 9.2.2. Paper
- 9.2.3. Silica Gel
- 9.1. Market Analysis, Insights and Forecast - by Application
- 10. Asia Pacific Reusable Pizza Box Analysis, Insights and Forecast, 2020-2032
- 10.1. Market Analysis, Insights and Forecast - by Application
- 10.1.1. Pizza Shop
- 10.1.2. Fast Food Shop
- 10.1.3. Others
- 10.2. Market Analysis, Insights and Forecast - by Types
- 10.2.1. Plastic
- 10.2.2. Paper
- 10.2.3. Silica Gel
- 10.1. Market Analysis, Insights and Forecast - by Application
- 11. Competitive Analysis
- 11.1. Global Market Share Analysis 2025
- 11.2. Company Profiles
- 11.2.1 Pizzycle
- 11.2.1.1. Overview
- 11.2.1.2. Products
- 11.2.1.3. SWOT Analysis
- 11.2.1.4. Recent Developments
- 11.2.1.5. Financials (Based on Availability)
- 11.2.2 DaVinci Box Company
- 11.2.2.1. Overview
- 11.2.2.2. Products
- 11.2.2.3. SWOT Analysis
- 11.2.2.4. Recent Developments
- 11.2.2.5. Financials (Based on Availability)
- 11.2.3 CAUTUM
- 11.2.3.1. Overview
- 11.2.3.2. Products
- 11.2.3.3. SWOT Analysis
- 11.2.3.4. Recent Developments
- 11.2.3.5. Financials (Based on Availability)
- 11.2.4 FKKsparkler
- 11.2.4.1. Overview
- 11.2.4.2. Products
- 11.2.4.3. SWOT Analysis
- 11.2.4.4. Recent Developments
- 11.2.4.5. Financials (Based on Availability)
- 11.2.5 VKF Renzel
- 11.2.5.1. Overview
- 11.2.5.2. Products
- 11.2.5.3. SWOT Analysis
- 11.2.5.4. Recent Developments
- 11.2.5.5. Financials (Based on Availability)
- 11.2.1 Pizzycle
List of Figures
- Figure 1: Global Reusable Pizza Box Revenue Breakdown (million, %) by Region 2025 & 2033
- Figure 2: Global Reusable Pizza Box Volume Breakdown (K, %) by Region 2025 & 2033
- Figure 3: North America Reusable Pizza Box Revenue (million), by Application 2025 & 2033
- Figure 4: North America Reusable Pizza Box Volume (K), by Application 2025 & 2033
- Figure 5: North America Reusable Pizza Box Revenue Share (%), by Application 2025 & 2033
- Figure 6: North America Reusable Pizza Box Volume Share (%), by Application 2025 & 2033
- Figure 7: North America Reusable Pizza Box Revenue (million), by Types 2025 & 2033
- Figure 8: North America Reusable Pizza Box Volume (K), by Types 2025 & 2033
- Figure 9: North America Reusable Pizza Box Revenue Share (%), by Types 2025 & 2033
- Figure 10: North America Reusable Pizza Box Volume Share (%), by Types 2025 & 2033
- Figure 11: North America Reusable Pizza Box Revenue (million), by Country 2025 & 2033
- Figure 12: North America Reusable Pizza Box Volume (K), by Country 2025 & 2033
- Figure 13: North America Reusable Pizza Box Revenue Share (%), by Country 2025 & 2033
- Figure 14: North America Reusable Pizza Box Volume Share (%), by Country 2025 & 2033
- Figure 15: South America Reusable Pizza Box Revenue (million), by Application 2025 & 2033
- Figure 16: South America Reusable Pizza Box Volume (K), by Application 2025 & 2033
- Figure 17: South America Reusable Pizza Box Revenue Share (%), by Application 2025 & 2033
- Figure 18: South America Reusable Pizza Box Volume Share (%), by Application 2025 & 2033
- Figure 19: South America Reusable Pizza Box Revenue (million), by Types 2025 & 2033
- Figure 20: South America Reusable Pizza Box Volume (K), by Types 2025 & 2033
- Figure 21: South America Reusable Pizza Box Revenue Share (%), by Types 2025 & 2033
- Figure 22: South America Reusable Pizza Box Volume Share (%), by Types 2025 & 2033
- Figure 23: South America Reusable Pizza Box Revenue (million), by Country 2025 & 2033
- Figure 24: South America Reusable Pizza Box Volume (K), by Country 2025 & 2033
- Figure 25: South America Reusable Pizza Box Revenue Share (%), by Country 2025 & 2033
- Figure 26: South America Reusable Pizza Box Volume Share (%), by Country 2025 & 2033
- Figure 27: Europe Reusable Pizza Box Revenue (million), by Application 2025 & 2033
- Figure 28: Europe Reusable Pizza Box Volume (K), by Application 2025 & 2033
- Figure 29: Europe Reusable Pizza Box Revenue Share (%), by Application 2025 & 2033
- Figure 30: Europe Reusable Pizza Box Volume Share (%), by Application 2025 & 2033
- Figure 31: Europe Reusable Pizza Box Revenue (million), by Types 2025 & 2033
- Figure 32: Europe Reusable Pizza Box Volume (K), by Types 2025 & 2033
- Figure 33: Europe Reusable Pizza Box Revenue Share (%), by Types 2025 & 2033
- Figure 34: Europe Reusable Pizza Box Volume Share (%), by Types 2025 & 2033
- Figure 35: Europe Reusable Pizza Box Revenue (million), by Country 2025 & 2033
- Figure 36: Europe Reusable Pizza Box Volume (K), by Country 2025 & 2033
- Figure 37: Europe Reusable Pizza Box Revenue Share (%), by Country 2025 & 2033
- Figure 38: Europe Reusable Pizza Box Volume Share (%), by Country 2025 & 2033
- Figure 39: Middle East & Africa Reusable Pizza Box Revenue (million), by Application 2025 & 2033
- Figure 40: Middle East & Africa Reusable Pizza Box Volume (K), by Application 2025 & 2033
- Figure 41: Middle East & Africa Reusable Pizza Box Revenue Share (%), by Application 2025 & 2033
- Figure 42: Middle East & Africa Reusable Pizza Box Volume Share (%), by Application 2025 & 2033
- Figure 43: Middle East & Africa Reusable Pizza Box Revenue (million), by Types 2025 & 2033
- Figure 44: Middle East & Africa Reusable Pizza Box Volume (K), by Types 2025 & 2033
- Figure 45: Middle East & Africa Reusable Pizza Box Revenue Share (%), by Types 2025 & 2033
- Figure 46: Middle East & Africa Reusable Pizza Box Volume Share (%), by Types 2025 & 2033
- Figure 47: Middle East & Africa Reusable Pizza Box Revenue (million), by Country 2025 & 2033
- Figure 48: Middle East & Africa Reusable Pizza Box Volume (K), by Country 2025 & 2033
- Figure 49: Middle East & Africa Reusable Pizza Box Revenue Share (%), by Country 2025 & 2033
- Figure 50: Middle East & Africa Reusable Pizza Box Volume Share (%), by Country 2025 & 2033
- Figure 51: Asia Pacific Reusable Pizza Box Revenue (million), by Application 2025 & 2033
- Figure 52: Asia Pacific Reusable Pizza Box Volume (K), by Application 2025 & 2033
- Figure 53: Asia Pacific Reusable Pizza Box Revenue Share (%), by Application 2025 & 2033
- Figure 54: Asia Pacific Reusable Pizza Box Volume Share (%), by Application 2025 & 2033
- Figure 55: Asia Pacific Reusable Pizza Box Revenue (million), by Types 2025 & 2033
- Figure 56: Asia Pacific Reusable Pizza Box Volume (K), by Types 2025 & 2033
- Figure 57: Asia Pacific Reusable Pizza Box Revenue Share (%), by Types 2025 & 2033
- Figure 58: Asia Pacific Reusable Pizza Box Volume Share (%), by Types 2025 & 2033
- Figure 59: Asia Pacific Reusable Pizza Box Revenue (million), by Country 2025 & 2033
- Figure 60: Asia Pacific Reusable Pizza Box Volume (K), by Country 2025 & 2033
- Figure 61: Asia Pacific Reusable Pizza Box Revenue Share (%), by Country 2025 & 2033
- Figure 62: Asia Pacific Reusable Pizza Box Volume Share (%), by Country 2025 & 2033
List of Tables
- Table 1: Global Reusable Pizza Box Revenue million Forecast, by Application 2020 & 2033
- Table 2: Global Reusable Pizza Box Volume K Forecast, by Application 2020 & 2033
- Table 3: Global Reusable Pizza Box Revenue million Forecast, by Types 2020 & 2033
- Table 4: Global Reusable Pizza Box Volume K Forecast, by Types 2020 & 2033
- Table 5: Global Reusable Pizza Box Revenue million Forecast, by Region 2020 & 2033
- Table 6: Global Reusable Pizza Box Volume K Forecast, by Region 2020 & 2033
- Table 7: Global Reusable Pizza Box Revenue million Forecast, by Application 2020 & 2033
- Table 8: Global Reusable Pizza Box Volume K Forecast, by Application 2020 & 2033
- Table 9: Global Reusable Pizza Box Revenue million Forecast, by Types 2020 & 2033
- Table 10: Global Reusable Pizza Box Volume K Forecast, by Types 2020 & 2033
- Table 11: Global Reusable Pizza Box Revenue million Forecast, by Country 2020 & 2033
- Table 12: Global Reusable Pizza Box Volume K Forecast, by Country 2020 & 2033
- Table 13: United States Reusable Pizza Box Revenue (million) Forecast, by Application 2020 & 2033
- Table 14: United States Reusable Pizza Box Volume (K) Forecast, by Application 2020 & 2033
- Table 15: Canada Reusable Pizza Box Revenue (million) Forecast, by Application 2020 & 2033
- Table 16: Canada Reusable Pizza Box Volume (K) Forecast, by Application 2020 & 2033
- Table 17: Mexico Reusable Pizza Box Revenue (million) Forecast, by Application 2020 & 2033
- Table 18: Mexico Reusable Pizza Box Volume (K) Forecast, by Application 2020 & 2033
- Table 19: Global Reusable Pizza Box Revenue million Forecast, by Application 2020 & 2033
- Table 20: Global Reusable Pizza Box Volume K Forecast, by Application 2020 & 2033
- Table 21: Global Reusable Pizza Box Revenue million Forecast, by Types 2020 & 2033
- Table 22: Global Reusable Pizza Box Volume K Forecast, by Types 2020 & 2033
- Table 23: Global Reusable Pizza Box Revenue million Forecast, by Country 2020 & 2033
- Table 24: Global Reusable Pizza Box Volume K Forecast, by Country 2020 & 2033
- Table 25: Brazil Reusable Pizza Box Revenue (million) Forecast, by Application 2020 & 2033
- Table 26: Brazil Reusable Pizza Box Volume (K) Forecast, by Application 2020 & 2033
- Table 27: Argentina Reusable Pizza Box Revenue (million) Forecast, by Application 2020 & 2033
- Table 28: Argentina Reusable Pizza Box Volume (K) Forecast, by Application 2020 & 2033
- Table 29: Rest of South America Reusable Pizza Box Revenue (million) Forecast, by Application 2020 & 2033
- Table 30: Rest of South America Reusable Pizza Box Volume (K) Forecast, by Application 2020 & 2033
- Table 31: Global Reusable Pizza Box Revenue million Forecast, by Application 2020 & 2033
- Table 32: Global Reusable Pizza Box Volume K Forecast, by Application 2020 & 2033
- Table 33: Global Reusable Pizza Box Revenue million Forecast, by Types 2020 & 2033
- Table 34: Global Reusable Pizza Box Volume K Forecast, by Types 2020 & 2033
- Table 35: Global Reusable Pizza Box Revenue million Forecast, by Country 2020 & 2033
- Table 36: Global Reusable Pizza Box Volume K Forecast, by Country 2020 & 2033
- Table 37: United Kingdom Reusable Pizza Box Revenue (million) Forecast, by Application 2020 & 2033
- Table 38: United Kingdom Reusable Pizza Box Volume (K) Forecast, by Application 2020 & 2033
- Table 39: Germany Reusable Pizza Box Revenue (million) Forecast, by Application 2020 & 2033
- Table 40: Germany Reusable Pizza Box Volume (K) Forecast, by Application 2020 & 2033
- Table 41: France Reusable Pizza Box Revenue (million) Forecast, by Application 2020 & 2033
- Table 42: France Reusable Pizza Box Volume (K) Forecast, by Application 2020 & 2033
- Table 43: Italy Reusable Pizza Box Revenue (million) Forecast, by Application 2020 & 2033
- Table 44: Italy Reusable Pizza Box Volume (K) Forecast, by Application 2020 & 2033
- Table 45: Spain Reusable Pizza Box Revenue (million) Forecast, by Application 2020 & 2033
- Table 46: Spain Reusable Pizza Box Volume (K) Forecast, by Application 2020 & 2033
- Table 47: Russia Reusable Pizza Box Revenue (million) Forecast, by Application 2020 & 2033
- Table 48: Russia Reusable Pizza Box Volume (K) Forecast, by Application 2020 & 2033
- Table 49: Benelux Reusable Pizza Box Revenue (million) Forecast, by Application 2020 & 2033
- Table 50: Benelux Reusable Pizza Box Volume (K) Forecast, by Application 2020 & 2033
- Table 51: Nordics Reusable Pizza Box Revenue (million) Forecast, by Application 2020 & 2033
- Table 52: Nordics Reusable Pizza Box Volume (K) Forecast, by Application 2020 & 2033
- Table 53: Rest of Europe Reusable Pizza Box Revenue (million) Forecast, by Application 2020 & 2033
- Table 54: Rest of Europe Reusable Pizza Box Volume (K) Forecast, by Application 2020 & 2033
- Table 55: Global Reusable Pizza Box Revenue million Forecast, by Application 2020 & 2033
- Table 56: Global Reusable Pizza Box Volume K Forecast, by Application 2020 & 2033
- Table 57: Global Reusable Pizza Box Revenue million Forecast, by Types 2020 & 2033
- Table 58: Global Reusable Pizza Box Volume K Forecast, by Types 2020 & 2033
- Table 59: Global Reusable Pizza Box Revenue million Forecast, by Country 2020 & 2033
- Table 60: Global Reusable Pizza Box Volume K Forecast, by Country 2020 & 2033
- Table 61: Turkey Reusable Pizza Box Revenue (million) Forecast, by Application 2020 & 2033
- Table 62: Turkey Reusable Pizza Box Volume (K) Forecast, by Application 2020 & 2033
- Table 63: Israel Reusable Pizza Box Revenue (million) Forecast, by Application 2020 & 2033
- Table 64: Israel Reusable Pizza Box Volume (K) Forecast, by Application 2020 & 2033
- Table 65: GCC Reusable Pizza Box Revenue (million) Forecast, by Application 2020 & 2033
- Table 66: GCC Reusable Pizza Box Volume (K) Forecast, by Application 2020 & 2033
- Table 67: North Africa Reusable Pizza Box Revenue (million) Forecast, by Application 2020 & 2033
- Table 68: North Africa Reusable Pizza Box Volume (K) Forecast, by Application 2020 & 2033
- Table 69: South Africa Reusable Pizza Box Revenue (million) Forecast, by Application 2020 & 2033
- Table 70: South Africa Reusable Pizza Box Volume (K) Forecast, by Application 2020 & 2033
- Table 71: Rest of Middle East & Africa Reusable Pizza Box Revenue (million) Forecast, by Application 2020 & 2033
- Table 72: Rest of Middle East & Africa Reusable Pizza Box Volume (K) Forecast, by Application 2020 & 2033
- Table 73: Global Reusable Pizza Box Revenue million Forecast, by Application 2020 & 2033
- Table 74: Global Reusable Pizza Box Volume K Forecast, by Application 2020 & 2033
- Table 75: Global Reusable Pizza Box Revenue million Forecast, by Types 2020 & 2033
- Table 76: Global Reusable Pizza Box Volume K Forecast, by Types 2020 & 2033
- Table 77: Global Reusable Pizza Box Revenue million Forecast, by Country 2020 & 2033
- Table 78: Global Reusable Pizza Box Volume K Forecast, by Country 2020 & 2033
- Table 79: China Reusable Pizza Box Revenue (million) Forecast, by Application 2020 & 2033
- Table 80: China Reusable Pizza Box Volume (K) Forecast, by Application 2020 & 2033
- Table 81: India Reusable Pizza Box Revenue (million) Forecast, by Application 2020 & 2033
- Table 82: India Reusable Pizza Box Volume (K) Forecast, by Application 2020 & 2033
- Table 83: Japan Reusable Pizza Box Revenue (million) Forecast, by Application 2020 & 2033
- Table 84: Japan Reusable Pizza Box Volume (K) Forecast, by Application 2020 & 2033
- Table 85: South Korea Reusable Pizza Box Revenue (million) Forecast, by Application 2020 & 2033
- Table 86: South Korea Reusable Pizza Box Volume (K) Forecast, by Application 2020 & 2033
- Table 87: ASEAN Reusable Pizza Box Revenue (million) Forecast, by Application 2020 & 2033
- Table 88: ASEAN Reusable Pizza Box Volume (K) Forecast, by Application 2020 & 2033
- Table 89: Oceania Reusable Pizza Box Revenue (million) Forecast, by Application 2020 & 2033
- Table 90: Oceania Reusable Pizza Box Volume (K) Forecast, by Application 2020 & 2033
- Table 91: Rest of Asia Pacific Reusable Pizza Box Revenue (million) Forecast, by Application 2020 & 2033
- Table 92: Rest of Asia Pacific Reusable Pizza Box Volume (K) Forecast, by Application 2020 & 2033
Frequently Asked Questions
1. What is the projected Compound Annual Growth Rate (CAGR) of the Reusable Pizza Box?
The projected CAGR is approximately 3.9%.
2. Which companies are prominent players in the Reusable Pizza Box?
Key companies in the market include Pizzycle, DaVinci Box Company, CAUTUM, FKKsparkler, VKF Renzel.
3. What are the main segments of the Reusable Pizza Box?
The market segments include Application, Types.
4. Can you provide details about the market size?
The market size is estimated to be USD 112 million as of 2022.
5. What are some drivers contributing to market growth?
N/A
6. What are the notable trends driving market growth?
N/A
7. Are there any restraints impacting market growth?
N/A
8. Can you provide examples of recent developments in the market?
N/A
9. What pricing options are available for accessing the report?
Pricing options include single-user, multi-user, and enterprise licenses priced at USD 4350.00, USD 6525.00, and USD 8700.00 respectively.
10. Is the market size provided in terms of value or volume?
The market size is provided in terms of value, measured in million and volume, measured in K.
11. Are there any specific market keywords associated with the report?
Yes, the market keyword associated with the report is "Reusable Pizza Box," which aids in identifying and referencing the specific market segment covered.
12. How do I determine which pricing option suits my needs best?
The pricing options vary based on user requirements and access needs. Individual users may opt for single-user licenses, while businesses requiring broader access may choose multi-user or enterprise licenses for cost-effective access to the report.
13. Are there any additional resources or data provided in the Reusable Pizza Box report?
While the report offers comprehensive insights, it's advisable to review the specific contents or supplementary materials provided to ascertain if additional resources or data are available.
14. How can I stay updated on further developments or reports in the Reusable Pizza Box?
To stay informed about further developments, trends, and reports in the Reusable Pizza Box, consider subscribing to industry newsletters, following relevant companies and organizations, or regularly checking reputable industry news sources and publications.
Methodology
Step 1 - Identification of Relevant Samples Size from Population Database


Step 2 - Approaches for Defining Global Market Size (Value, Volume* & Price*)

Note*: In applicable scenarios
Step 3 - Data Sources
Primary Research
- Web Analytics
- Survey Reports
- Research Institute
- Latest Research Reports
- Opinion Leaders
Secondary Research
- Annual Reports
- White Paper
- Latest Press Release
- Industry Association
- Paid Database
- Investor Presentations

Step 4 - Data Triangulation
Involves using different sources of information in order to increase the validity of a study
These sources are likely to be stakeholders in a program - participants, other researchers, program staff, other community members, and so on.
Then we put all data in single framework & apply various statistical tools to find out the dynamic on the market.
During the analysis stage, feedback from the stakeholder groups would be compared to determine areas of agreement as well as areas of divergence