

Key Insights
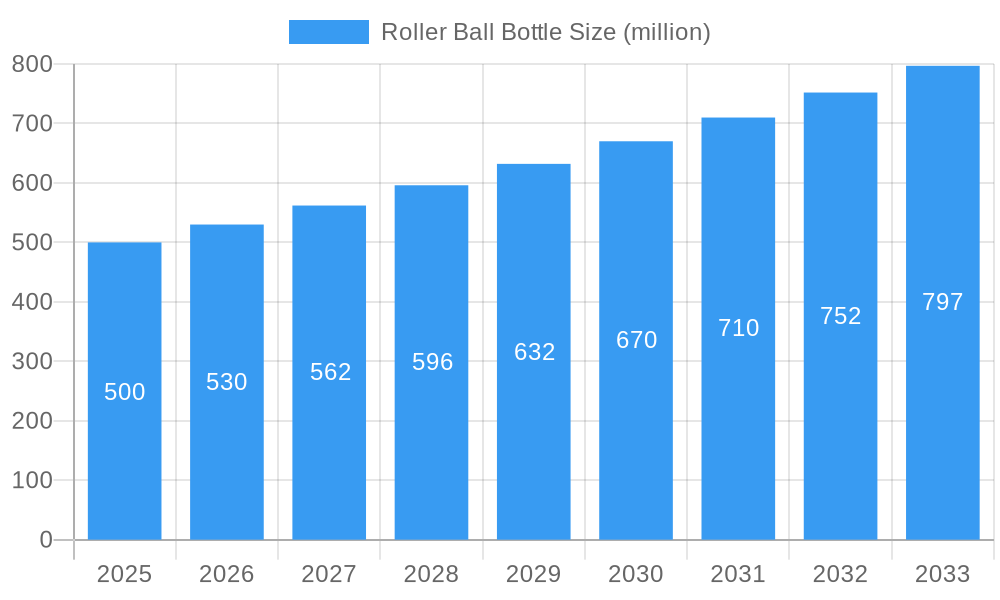
The global roller ball bottle market is experiencing robust growth, driven by the increasing popularity of essential oils, perfumes, and roll-on cosmetics. The market's expansion is fueled by several key factors, including the convenience and portability of roller ball applicators, the growing demand for natural and organic products packaged in sustainable materials, and the rising preference for personalized beauty and self-care routines. Furthermore, the innovative designs and functionalities offered by roller ball bottles are attracting consumers seeking unique and aesthetically pleasing packaging solutions. This market segment is projected to maintain a healthy Compound Annual Growth Rate (CAGR) of approximately 6% between 2025 and 2033, building upon a 2025 market size estimated at $500 million. This growth is expected to be significantly influenced by increasing consumer spending on premium personal care products, coupled with strategic product innovations in packaging materials and designs.
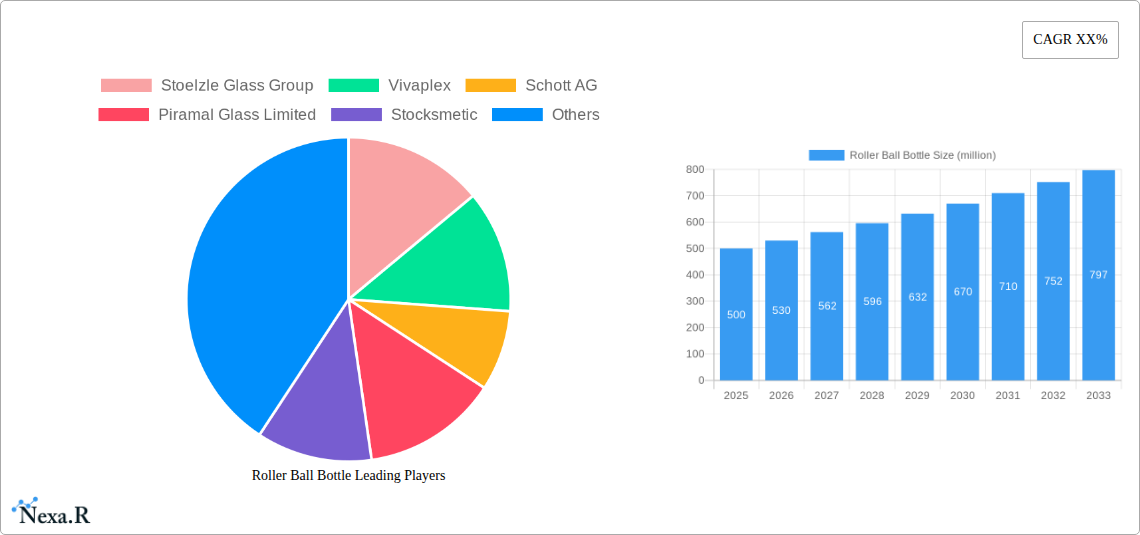
Roller Ball Bottle Market Size (In Million)
Key restraints include fluctuating raw material prices, particularly for glass and plastic, as well as the increasing competition from alternative packaging formats. However, market players are proactively addressing these challenges through strategic partnerships, technological advancements, and the exploration of eco-friendly packaging materials, such as recycled glass and bioplastics. Major market segments include glass, plastic, and other materials, further differentiated by application (cosmetics, pharmaceuticals, essential oils), and geographic region. Leading companies, such as Stoelzle Glass Group, Schott AG, and Amcor, are leveraging their established expertise and market presence to capitalize on this growth opportunity, constantly innovating and expanding their product portfolios to meet evolving consumer preferences and demands. The increasing use of roller ball bottles in niche applications like aromatherapy and CBD products presents exciting opportunities for future expansion.
Roller Ball Bottle Company Market Share
This comprehensive report provides a detailed analysis of the global roller ball bottle market, encompassing market dynamics, growth trends, regional insights, product landscape, and key player strategies. The study period covers 2019-2033, with 2025 as the base and estimated year. This report is invaluable for industry professionals, investors, and market entrants seeking to understand and capitalize on opportunities within this dynamic sector. The market is segmented by material type (glass, plastic), application (cosmetics, pharmaceuticals, essential oils), and distribution channel (online, offline).
Roller Ball Bottle Market Dynamics & Structure
The global roller ball bottle market, valued at xx million units in 2024, is characterized by moderate concentration, with key players holding significant market share. The market is driven by technological innovations in materials science and manufacturing processes, leading to lighter, more durable, and aesthetically pleasing bottles. Regulatory frameworks concerning packaging safety and sustainability significantly impact market dynamics, driving the adoption of eco-friendly materials and sustainable manufacturing practices. Competitive substitutes, such as spray bottles and pump dispensers, exert pressure on market growth, necessitating continuous product innovation and differentiation. The end-user demographic is diverse, encompassing cosmetics, pharmaceuticals, and essential oils industries, with growing demand driven by increasing consumer preference for convenient and portable packaging. M&A activity within the industry remains relatively low, with xx major deals recorded between 2019 and 2024, primarily focused on consolidation and expansion into new markets.
- Market Concentration: Moderately concentrated, with top 5 players holding approximately xx% market share in 2024.
- Technological Innovation: Focus on lightweighting, improved barrier properties, and sustainable materials.
- Regulatory Framework: Stringent regulations regarding material safety and recyclability are driving innovation.
- Competitive Substitutes: Spray bottles and pump dispensers pose a competitive threat.
- End-User Demographics: Cosmetics, pharmaceuticals, and essential oils are major end-use segments.
- M&A Trends: Limited M&A activity, primarily focused on strategic acquisitions and expansion.
Roller Ball Bottle Growth Trends & Insights
The roller ball bottle market witnessed a CAGR of xx% during the historical period (2019-2024) and is projected to grow at a CAGR of xx% during the forecast period (2025-2033), reaching xx million units by 2033. This growth is fueled by several factors, including the rising popularity of essential oils and aromatherapy products, the growing demand for convenient and portable packaging in the cosmetics and personal care industry, and the increasing adoption of roller ball bottles for pharmaceutical applications. Technological advancements, such as the development of innovative materials and improved manufacturing processes, are further driving market growth. Consumer behavior shifts towards sustainable and eco-friendly packaging options are also contributing to market expansion. Market penetration is expected to increase from xx% in 2024 to xx% by 2033.
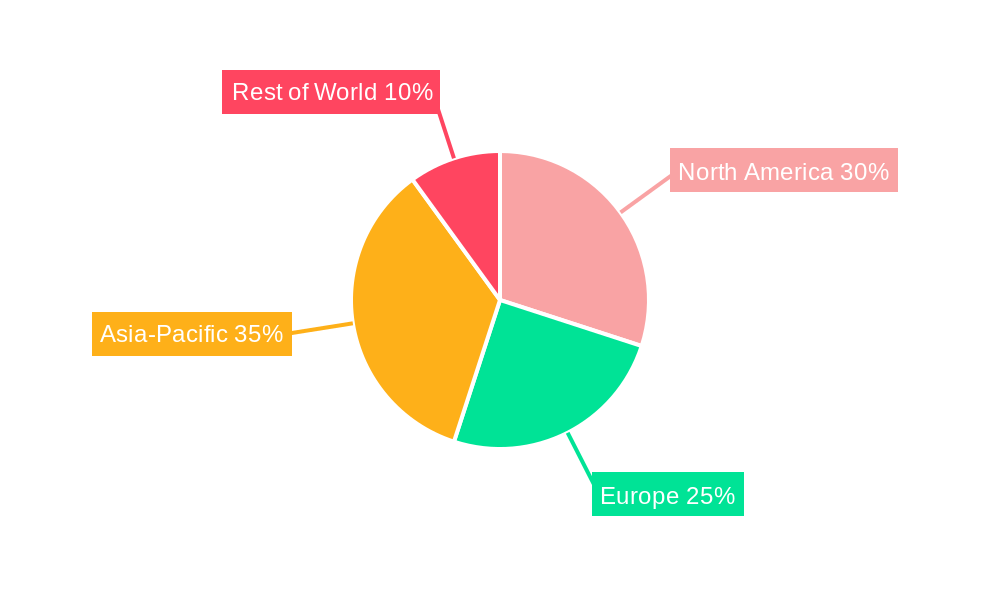
Dominant Regions, Countries, or Segments in Roller Ball Bottle
North America currently dominates the roller ball bottle market, accounting for approximately xx% of the global market share in 2024. This dominance is attributed to factors such as high consumer spending on personal care and cosmetic products, established manufacturing infrastructure, and strong regulatory frameworks supporting sustainable packaging solutions. Europe follows closely, with xx% market share driven by a similar consumer base and a strong focus on eco-friendly packaging materials. Asia-Pacific is expected to exhibit the highest growth rate during the forecast period, fueled by rapid economic growth, increasing disposable incomes, and expanding consumer base in emerging markets.
- North America: Strong consumer spending, robust infrastructure, and supportive regulatory environment.
- Europe: High demand for sustainable packaging and established manufacturing base.
- Asia-Pacific: High growth potential driven by economic growth and expanding consumer base.
Roller Ball Bottle Product Landscape
Roller ball bottles are primarily made from glass and plastic, each offering unique advantages. Glass offers superior barrier properties, preserving the integrity of sensitive contents, while plastic provides lightweighting, cost-effectiveness, and design flexibility. Recent innovations focus on improving the functionality and aesthetics of roller ball bottles, with features like improved dispensing mechanisms, ergonomic designs, and sustainable materials gaining popularity. Unique selling propositions include enhanced convenience, portability, precise application, and eco-friendly designs.
Key Drivers, Barriers & Challenges in Roller Ball Bottle
Key Drivers:
- Increasing demand for convenient and portable packaging in the cosmetics and personal care industry.
- Growing popularity of essential oils and aromatherapy.
- Technological advancements in materials science and manufacturing processes.
- Rising consumer preference for sustainable and eco-friendly packaging.
Challenges:
- Competition from alternative packaging formats like spray bottles and pump dispensers.
- Fluctuations in raw material prices.
- Regulatory complexities and compliance requirements for packaging materials.
- Supply chain disruptions impacting production and distribution.
Emerging Opportunities in Roller Ball Bottle
Untapped markets in developing economies represent significant opportunities for growth. Innovative applications, such as in the pharmaceutical and industrial sectors, are opening new avenues. Evolving consumer preferences towards customized and personalized packaging are creating niche market opportunities for premium and specialized roller ball bottles.
Growth Accelerators in the Roller Ball Bottle Industry
Technological breakthroughs in material science, leading to lighter, stronger, and more sustainable bottles, are significant growth drivers. Strategic partnerships between manufacturers and brand owners facilitate product innovation and market penetration. Market expansion into new geographic regions and product diversification into adjacent markets further accelerate growth.
Key Players Shaping the Roller Ball Bottle Market
- Stoelzle Glass Group
- Vivaplex
- Schott AG
- Piramal Glass Limited
- Stocksmetic
- SGB Packaging
- Owens-Illinois Inc.
- Amcor
- Gerresheimer
- Hindustan National Glass & Industries
- Ardagh Group
- HEINZ-GLAS GmbH & Co. KGaA
Notable Milestones in Roller Ball Bottle Sector
- 2020: Introduction of recyclable plastic roller ball bottles by Stocksmetic.
- 2021: Partnership between Amcor and a major cosmetic brand to develop sustainable packaging solutions.
- 2022: Launch of a new lightweight glass roller ball bottle by Stoelzle Glass Group.
- 2023: Acquisition of a small packaging company specializing in roller ball bottles by Owens-Illinois Inc.
In-Depth Roller Ball Bottle Market Outlook
The roller ball bottle market is poised for continued growth, driven by ongoing innovations in materials and design, coupled with increasing demand from key end-use sectors. Strategic partnerships and market expansion will further fuel market growth, presenting attractive opportunities for existing and new players. The focus on sustainable and eco-friendly packaging will shape future market dynamics, driving demand for recyclable and biodegradable materials.
Roller Ball Bottle Segmentation
-
1. Application
- 1.1. Personal Care
- 1.2. Healthcare
- 1.3. Others
-
2. Types
- 2.1. Amber
- 2.2. Rainbow
- 2.3. Transparent
Roller Ball Bottle Segmentation By Geography
-
1. North America
- 1.1. United States
- 1.2. Canada
- 1.3. Mexico
-
2. South America
- 2.1. Brazil
- 2.2. Argentina
- 2.3. Rest of South America
-
3. Europe
- 3.1. United Kingdom
- 3.2. Germany
- 3.3. France
- 3.4. Italy
- 3.5. Spain
- 3.6. Russia
- 3.7. Benelux
- 3.8. Nordics
- 3.9. Rest of Europe
-
4. Middle East & Africa
- 4.1. Turkey
- 4.2. Israel
- 4.3. GCC
- 4.4. North Africa
- 4.5. South Africa
- 4.6. Rest of Middle East & Africa
-
5. Asia Pacific
- 5.1. China
- 5.2. India
- 5.3. Japan
- 5.4. South Korea
- 5.5. ASEAN
- 5.6. Oceania
- 5.7. Rest of Asia Pacific
Roller Ball Bottle Regional Market Share
Geographic Coverage of Roller Ball Bottle
Roller Ball Bottle REPORT HIGHLIGHTS
| Aspects | Details |
|---|---|
| Study Period | 2020-2034 |
| Base Year | 2025 |
| Estimated Year | 2026 |
| Forecast Period | 2026-2034 |
| Historical Period | 2020-2025 |
| Growth Rate | CAGR of 10.41% from 2020-2034 |
| Segmentation |
|
Table of Contents
- 1. Introduction
- 1.1. Research Scope
- 1.2. Market Segmentation
- 1.3. Research Methodology
- 1.4. Definitions and Assumptions
- 2. Executive Summary
- 2.1. Introduction
- 3. Market Dynamics
- 3.1. Introduction
- 3.2. Market Drivers
- 3.3. Market Restrains
- 3.4. Market Trends
- 4. Market Factor Analysis
- 4.1. Porters Five Forces
- 4.2. Supply/Value Chain
- 4.3. PESTEL analysis
- 4.4. Market Entropy
- 4.5. Patent/Trademark Analysis
- 5. Global Roller Ball Bottle Analysis, Insights and Forecast, 2020-2032
- 5.1. Market Analysis, Insights and Forecast - by Application
- 5.1.1. Personal Care
- 5.1.2. Healthcare
- 5.1.3. Others
- 5.2. Market Analysis, Insights and Forecast - by Types
- 5.2.1. Amber
- 5.2.2. Rainbow
- 5.2.3. Transparent
- 5.3. Market Analysis, Insights and Forecast - by Region
- 5.3.1. North America
- 5.3.2. South America
- 5.3.3. Europe
- 5.3.4. Middle East & Africa
- 5.3.5. Asia Pacific
- 5.1. Market Analysis, Insights and Forecast - by Application
- 6. North America Roller Ball Bottle Analysis, Insights and Forecast, 2020-2032
- 6.1. Market Analysis, Insights and Forecast - by Application
- 6.1.1. Personal Care
- 6.1.2. Healthcare
- 6.1.3. Others
- 6.2. Market Analysis, Insights and Forecast - by Types
- 6.2.1. Amber
- 6.2.2. Rainbow
- 6.2.3. Transparent
- 6.1. Market Analysis, Insights and Forecast - by Application
- 7. South America Roller Ball Bottle Analysis, Insights and Forecast, 2020-2032
- 7.1. Market Analysis, Insights and Forecast - by Application
- 7.1.1. Personal Care
- 7.1.2. Healthcare
- 7.1.3. Others
- 7.2. Market Analysis, Insights and Forecast - by Types
- 7.2.1. Amber
- 7.2.2. Rainbow
- 7.2.3. Transparent
- 7.1. Market Analysis, Insights and Forecast - by Application
- 8. Europe Roller Ball Bottle Analysis, Insights and Forecast, 2020-2032
- 8.1. Market Analysis, Insights and Forecast - by Application
- 8.1.1. Personal Care
- 8.1.2. Healthcare
- 8.1.3. Others
- 8.2. Market Analysis, Insights and Forecast - by Types
- 8.2.1. Amber
- 8.2.2. Rainbow
- 8.2.3. Transparent
- 8.1. Market Analysis, Insights and Forecast - by Application
- 9. Middle East & Africa Roller Ball Bottle Analysis, Insights and Forecast, 2020-2032
- 9.1. Market Analysis, Insights and Forecast - by Application
- 9.1.1. Personal Care
- 9.1.2. Healthcare
- 9.1.3. Others
- 9.2. Market Analysis, Insights and Forecast - by Types
- 9.2.1. Amber
- 9.2.2. Rainbow
- 9.2.3. Transparent
- 9.1. Market Analysis, Insights and Forecast - by Application
- 10. Asia Pacific Roller Ball Bottle Analysis, Insights and Forecast, 2020-2032
- 10.1. Market Analysis, Insights and Forecast - by Application
- 10.1.1. Personal Care
- 10.1.2. Healthcare
- 10.1.3. Others
- 10.2. Market Analysis, Insights and Forecast - by Types
- 10.2.1. Amber
- 10.2.2. Rainbow
- 10.2.3. Transparent
- 10.1. Market Analysis, Insights and Forecast - by Application
- 11. Competitive Analysis
- 11.1. Global Market Share Analysis 2025
- 11.2. Company Profiles
- 11.2.1 Stoelzle Glass Group
- 11.2.1.1. Overview
- 11.2.1.2. Products
- 11.2.1.3. SWOT Analysis
- 11.2.1.4. Recent Developments
- 11.2.1.5. Financials (Based on Availability)
- 11.2.2 Vivaplex
- 11.2.2.1. Overview
- 11.2.2.2. Products
- 11.2.2.3. SWOT Analysis
- 11.2.2.4. Recent Developments
- 11.2.2.5. Financials (Based on Availability)
- 11.2.3 Schott AG
- 11.2.3.1. Overview
- 11.2.3.2. Products
- 11.2.3.3. SWOT Analysis
- 11.2.3.4. Recent Developments
- 11.2.3.5. Financials (Based on Availability)
- 11.2.4 Piramal Glass Limited
- 11.2.4.1. Overview
- 11.2.4.2. Products
- 11.2.4.3. SWOT Analysis
- 11.2.4.4. Recent Developments
- 11.2.4.5. Financials (Based on Availability)
- 11.2.5 Stocksmetic
- 11.2.5.1. Overview
- 11.2.5.2. Products
- 11.2.5.3. SWOT Analysis
- 11.2.5.4. Recent Developments
- 11.2.5.5. Financials (Based on Availability)
- 11.2.6 SGB Packaging
- 11.2.6.1. Overview
- 11.2.6.2. Products
- 11.2.6.3. SWOT Analysis
- 11.2.6.4. Recent Developments
- 11.2.6.5. Financials (Based on Availability)
- 11.2.7 Owens-Illinois Inc.
- 11.2.7.1. Overview
- 11.2.7.2. Products
- 11.2.7.3. SWOT Analysis
- 11.2.7.4. Recent Developments
- 11.2.7.5. Financials (Based on Availability)
- 11.2.8 Amcor
- 11.2.8.1. Overview
- 11.2.8.2. Products
- 11.2.8.3. SWOT Analysis
- 11.2.8.4. Recent Developments
- 11.2.8.5. Financials (Based on Availability)
- 11.2.9 Gerresheimer
- 11.2.9.1. Overview
- 11.2.9.2. Products
- 11.2.9.3. SWOT Analysis
- 11.2.9.4. Recent Developments
- 11.2.9.5. Financials (Based on Availability)
- 11.2.10 Hindustan National Glass & Industries
- 11.2.10.1. Overview
- 11.2.10.2. Products
- 11.2.10.3. SWOT Analysis
- 11.2.10.4. Recent Developments
- 11.2.10.5. Financials (Based on Availability)
- 11.2.11 Ardagh Group
- 11.2.11.1. Overview
- 11.2.11.2. Products
- 11.2.11.3. SWOT Analysis
- 11.2.11.4. Recent Developments
- 11.2.11.5. Financials (Based on Availability)
- 11.2.12 HEINZ-GLAS GmbH & Co. KGaA
- 11.2.12.1. Overview
- 11.2.12.2. Products
- 11.2.12.3. SWOT Analysis
- 11.2.12.4. Recent Developments
- 11.2.12.5. Financials (Based on Availability)
- 11.2.1 Stoelzle Glass Group
List of Figures
- Figure 1: Global Roller Ball Bottle Revenue Breakdown (undefined, %) by Region 2025 & 2033
- Figure 2: Global Roller Ball Bottle Volume Breakdown (K, %) by Region 2025 & 2033
- Figure 3: North America Roller Ball Bottle Revenue (undefined), by Application 2025 & 2033
- Figure 4: North America Roller Ball Bottle Volume (K), by Application 2025 & 2033
- Figure 5: North America Roller Ball Bottle Revenue Share (%), by Application 2025 & 2033
- Figure 6: North America Roller Ball Bottle Volume Share (%), by Application 2025 & 2033
- Figure 7: North America Roller Ball Bottle Revenue (undefined), by Types 2025 & 2033
- Figure 8: North America Roller Ball Bottle Volume (K), by Types 2025 & 2033
- Figure 9: North America Roller Ball Bottle Revenue Share (%), by Types 2025 & 2033
- Figure 10: North America Roller Ball Bottle Volume Share (%), by Types 2025 & 2033
- Figure 11: North America Roller Ball Bottle Revenue (undefined), by Country 2025 & 2033
- Figure 12: North America Roller Ball Bottle Volume (K), by Country 2025 & 2033
- Figure 13: North America Roller Ball Bottle Revenue Share (%), by Country 2025 & 2033
- Figure 14: North America Roller Ball Bottle Volume Share (%), by Country 2025 & 2033
- Figure 15: South America Roller Ball Bottle Revenue (undefined), by Application 2025 & 2033
- Figure 16: South America Roller Ball Bottle Volume (K), by Application 2025 & 2033
- Figure 17: South America Roller Ball Bottle Revenue Share (%), by Application 2025 & 2033
- Figure 18: South America Roller Ball Bottle Volume Share (%), by Application 2025 & 2033
- Figure 19: South America Roller Ball Bottle Revenue (undefined), by Types 2025 & 2033
- Figure 20: South America Roller Ball Bottle Volume (K), by Types 2025 & 2033
- Figure 21: South America Roller Ball Bottle Revenue Share (%), by Types 2025 & 2033
- Figure 22: South America Roller Ball Bottle Volume Share (%), by Types 2025 & 2033
- Figure 23: South America Roller Ball Bottle Revenue (undefined), by Country 2025 & 2033
- Figure 24: South America Roller Ball Bottle Volume (K), by Country 2025 & 2033
- Figure 25: South America Roller Ball Bottle Revenue Share (%), by Country 2025 & 2033
- Figure 26: South America Roller Ball Bottle Volume Share (%), by Country 2025 & 2033
- Figure 27: Europe Roller Ball Bottle Revenue (undefined), by Application 2025 & 2033
- Figure 28: Europe Roller Ball Bottle Volume (K), by Application 2025 & 2033
- Figure 29: Europe Roller Ball Bottle Revenue Share (%), by Application 2025 & 2033
- Figure 30: Europe Roller Ball Bottle Volume Share (%), by Application 2025 & 2033
- Figure 31: Europe Roller Ball Bottle Revenue (undefined), by Types 2025 & 2033
- Figure 32: Europe Roller Ball Bottle Volume (K), by Types 2025 & 2033
- Figure 33: Europe Roller Ball Bottle Revenue Share (%), by Types 2025 & 2033
- Figure 34: Europe Roller Ball Bottle Volume Share (%), by Types 2025 & 2033
- Figure 35: Europe Roller Ball Bottle Revenue (undefined), by Country 2025 & 2033
- Figure 36: Europe Roller Ball Bottle Volume (K), by Country 2025 & 2033
- Figure 37: Europe Roller Ball Bottle Revenue Share (%), by Country 2025 & 2033
- Figure 38: Europe Roller Ball Bottle Volume Share (%), by Country 2025 & 2033
- Figure 39: Middle East & Africa Roller Ball Bottle Revenue (undefined), by Application 2025 & 2033
- Figure 40: Middle East & Africa Roller Ball Bottle Volume (K), by Application 2025 & 2033
- Figure 41: Middle East & Africa Roller Ball Bottle Revenue Share (%), by Application 2025 & 2033
- Figure 42: Middle East & Africa Roller Ball Bottle Volume Share (%), by Application 2025 & 2033
- Figure 43: Middle East & Africa Roller Ball Bottle Revenue (undefined), by Types 2025 & 2033
- Figure 44: Middle East & Africa Roller Ball Bottle Volume (K), by Types 2025 & 2033
- Figure 45: Middle East & Africa Roller Ball Bottle Revenue Share (%), by Types 2025 & 2033
- Figure 46: Middle East & Africa Roller Ball Bottle Volume Share (%), by Types 2025 & 2033
- Figure 47: Middle East & Africa Roller Ball Bottle Revenue (undefined), by Country 2025 & 2033
- Figure 48: Middle East & Africa Roller Ball Bottle Volume (K), by Country 2025 & 2033
- Figure 49: Middle East & Africa Roller Ball Bottle Revenue Share (%), by Country 2025 & 2033
- Figure 50: Middle East & Africa Roller Ball Bottle Volume Share (%), by Country 2025 & 2033
- Figure 51: Asia Pacific Roller Ball Bottle Revenue (undefined), by Application 2025 & 2033
- Figure 52: Asia Pacific Roller Ball Bottle Volume (K), by Application 2025 & 2033
- Figure 53: Asia Pacific Roller Ball Bottle Revenue Share (%), by Application 2025 & 2033
- Figure 54: Asia Pacific Roller Ball Bottle Volume Share (%), by Application 2025 & 2033
- Figure 55: Asia Pacific Roller Ball Bottle Revenue (undefined), by Types 2025 & 2033
- Figure 56: Asia Pacific Roller Ball Bottle Volume (K), by Types 2025 & 2033
- Figure 57: Asia Pacific Roller Ball Bottle Revenue Share (%), by Types 2025 & 2033
- Figure 58: Asia Pacific Roller Ball Bottle Volume Share (%), by Types 2025 & 2033
- Figure 59: Asia Pacific Roller Ball Bottle Revenue (undefined), by Country 2025 & 2033
- Figure 60: Asia Pacific Roller Ball Bottle Volume (K), by Country 2025 & 2033
- Figure 61: Asia Pacific Roller Ball Bottle Revenue Share (%), by Country 2025 & 2033
- Figure 62: Asia Pacific Roller Ball Bottle Volume Share (%), by Country 2025 & 2033
List of Tables
- Table 1: Global Roller Ball Bottle Revenue undefined Forecast, by Application 2020 & 2033
- Table 2: Global Roller Ball Bottle Volume K Forecast, by Application 2020 & 2033
- Table 3: Global Roller Ball Bottle Revenue undefined Forecast, by Types 2020 & 2033
- Table 4: Global Roller Ball Bottle Volume K Forecast, by Types 2020 & 2033
- Table 5: Global Roller Ball Bottle Revenue undefined Forecast, by Region 2020 & 2033
- Table 6: Global Roller Ball Bottle Volume K Forecast, by Region 2020 & 2033
- Table 7: Global Roller Ball Bottle Revenue undefined Forecast, by Application 2020 & 2033
- Table 8: Global Roller Ball Bottle Volume K Forecast, by Application 2020 & 2033
- Table 9: Global Roller Ball Bottle Revenue undefined Forecast, by Types 2020 & 2033
- Table 10: Global Roller Ball Bottle Volume K Forecast, by Types 2020 & 2033
- Table 11: Global Roller Ball Bottle Revenue undefined Forecast, by Country 2020 & 2033
- Table 12: Global Roller Ball Bottle Volume K Forecast, by Country 2020 & 2033
- Table 13: United States Roller Ball Bottle Revenue (undefined) Forecast, by Application 2020 & 2033
- Table 14: United States Roller Ball Bottle Volume (K) Forecast, by Application 2020 & 2033
- Table 15: Canada Roller Ball Bottle Revenue (undefined) Forecast, by Application 2020 & 2033
- Table 16: Canada Roller Ball Bottle Volume (K) Forecast, by Application 2020 & 2033
- Table 17: Mexico Roller Ball Bottle Revenue (undefined) Forecast, by Application 2020 & 2033
- Table 18: Mexico Roller Ball Bottle Volume (K) Forecast, by Application 2020 & 2033
- Table 19: Global Roller Ball Bottle Revenue undefined Forecast, by Application 2020 & 2033
- Table 20: Global Roller Ball Bottle Volume K Forecast, by Application 2020 & 2033
- Table 21: Global Roller Ball Bottle Revenue undefined Forecast, by Types 2020 & 2033
- Table 22: Global Roller Ball Bottle Volume K Forecast, by Types 2020 & 2033
- Table 23: Global Roller Ball Bottle Revenue undefined Forecast, by Country 2020 & 2033
- Table 24: Global Roller Ball Bottle Volume K Forecast, by Country 2020 & 2033
- Table 25: Brazil Roller Ball Bottle Revenue (undefined) Forecast, by Application 2020 & 2033
- Table 26: Brazil Roller Ball Bottle Volume (K) Forecast, by Application 2020 & 2033
- Table 27: Argentina Roller Ball Bottle Revenue (undefined) Forecast, by Application 2020 & 2033
- Table 28: Argentina Roller Ball Bottle Volume (K) Forecast, by Application 2020 & 2033
- Table 29: Rest of South America Roller Ball Bottle Revenue (undefined) Forecast, by Application 2020 & 2033
- Table 30: Rest of South America Roller Ball Bottle Volume (K) Forecast, by Application 2020 & 2033
- Table 31: Global Roller Ball Bottle Revenue undefined Forecast, by Application 2020 & 2033
- Table 32: Global Roller Ball Bottle Volume K Forecast, by Application 2020 & 2033
- Table 33: Global Roller Ball Bottle Revenue undefined Forecast, by Types 2020 & 2033
- Table 34: Global Roller Ball Bottle Volume K Forecast, by Types 2020 & 2033
- Table 35: Global Roller Ball Bottle Revenue undefined Forecast, by Country 2020 & 2033
- Table 36: Global Roller Ball Bottle Volume K Forecast, by Country 2020 & 2033
- Table 37: United Kingdom Roller Ball Bottle Revenue (undefined) Forecast, by Application 2020 & 2033
- Table 38: United Kingdom Roller Ball Bottle Volume (K) Forecast, by Application 2020 & 2033
- Table 39: Germany Roller Ball Bottle Revenue (undefined) Forecast, by Application 2020 & 2033
- Table 40: Germany Roller Ball Bottle Volume (K) Forecast, by Application 2020 & 2033
- Table 41: France Roller Ball Bottle Revenue (undefined) Forecast, by Application 2020 & 2033
- Table 42: France Roller Ball Bottle Volume (K) Forecast, by Application 2020 & 2033
- Table 43: Italy Roller Ball Bottle Revenue (undefined) Forecast, by Application 2020 & 2033
- Table 44: Italy Roller Ball Bottle Volume (K) Forecast, by Application 2020 & 2033
- Table 45: Spain Roller Ball Bottle Revenue (undefined) Forecast, by Application 2020 & 2033
- Table 46: Spain Roller Ball Bottle Volume (K) Forecast, by Application 2020 & 2033
- Table 47: Russia Roller Ball Bottle Revenue (undefined) Forecast, by Application 2020 & 2033
- Table 48: Russia Roller Ball Bottle Volume (K) Forecast, by Application 2020 & 2033
- Table 49: Benelux Roller Ball Bottle Revenue (undefined) Forecast, by Application 2020 & 2033
- Table 50: Benelux Roller Ball Bottle Volume (K) Forecast, by Application 2020 & 2033
- Table 51: Nordics Roller Ball Bottle Revenue (undefined) Forecast, by Application 2020 & 2033
- Table 52: Nordics Roller Ball Bottle Volume (K) Forecast, by Application 2020 & 2033
- Table 53: Rest of Europe Roller Ball Bottle Revenue (undefined) Forecast, by Application 2020 & 2033
- Table 54: Rest of Europe Roller Ball Bottle Volume (K) Forecast, by Application 2020 & 2033
- Table 55: Global Roller Ball Bottle Revenue undefined Forecast, by Application 2020 & 2033
- Table 56: Global Roller Ball Bottle Volume K Forecast, by Application 2020 & 2033
- Table 57: Global Roller Ball Bottle Revenue undefined Forecast, by Types 2020 & 2033
- Table 58: Global Roller Ball Bottle Volume K Forecast, by Types 2020 & 2033
- Table 59: Global Roller Ball Bottle Revenue undefined Forecast, by Country 2020 & 2033
- Table 60: Global Roller Ball Bottle Volume K Forecast, by Country 2020 & 2033
- Table 61: Turkey Roller Ball Bottle Revenue (undefined) Forecast, by Application 2020 & 2033
- Table 62: Turkey Roller Ball Bottle Volume (K) Forecast, by Application 2020 & 2033
- Table 63: Israel Roller Ball Bottle Revenue (undefined) Forecast, by Application 2020 & 2033
- Table 64: Israel Roller Ball Bottle Volume (K) Forecast, by Application 2020 & 2033
- Table 65: GCC Roller Ball Bottle Revenue (undefined) Forecast, by Application 2020 & 2033
- Table 66: GCC Roller Ball Bottle Volume (K) Forecast, by Application 2020 & 2033
- Table 67: North Africa Roller Ball Bottle Revenue (undefined) Forecast, by Application 2020 & 2033
- Table 68: North Africa Roller Ball Bottle Volume (K) Forecast, by Application 2020 & 2033
- Table 69: South Africa Roller Ball Bottle Revenue (undefined) Forecast, by Application 2020 & 2033
- Table 70: South Africa Roller Ball Bottle Volume (K) Forecast, by Application 2020 & 2033
- Table 71: Rest of Middle East & Africa Roller Ball Bottle Revenue (undefined) Forecast, by Application 2020 & 2033
- Table 72: Rest of Middle East & Africa Roller Ball Bottle Volume (K) Forecast, by Application 2020 & 2033
- Table 73: Global Roller Ball Bottle Revenue undefined Forecast, by Application 2020 & 2033
- Table 74: Global Roller Ball Bottle Volume K Forecast, by Application 2020 & 2033
- Table 75: Global Roller Ball Bottle Revenue undefined Forecast, by Types 2020 & 2033
- Table 76: Global Roller Ball Bottle Volume K Forecast, by Types 2020 & 2033
- Table 77: Global Roller Ball Bottle Revenue undefined Forecast, by Country 2020 & 2033
- Table 78: Global Roller Ball Bottle Volume K Forecast, by Country 2020 & 2033
- Table 79: China Roller Ball Bottle Revenue (undefined) Forecast, by Application 2020 & 2033
- Table 80: China Roller Ball Bottle Volume (K) Forecast, by Application 2020 & 2033
- Table 81: India Roller Ball Bottle Revenue (undefined) Forecast, by Application 2020 & 2033
- Table 82: India Roller Ball Bottle Volume (K) Forecast, by Application 2020 & 2033
- Table 83: Japan Roller Ball Bottle Revenue (undefined) Forecast, by Application 2020 & 2033
- Table 84: Japan Roller Ball Bottle Volume (K) Forecast, by Application 2020 & 2033
- Table 85: South Korea Roller Ball Bottle Revenue (undefined) Forecast, by Application 2020 & 2033
- Table 86: South Korea Roller Ball Bottle Volume (K) Forecast, by Application 2020 & 2033
- Table 87: ASEAN Roller Ball Bottle Revenue (undefined) Forecast, by Application 2020 & 2033
- Table 88: ASEAN Roller Ball Bottle Volume (K) Forecast, by Application 2020 & 2033
- Table 89: Oceania Roller Ball Bottle Revenue (undefined) Forecast, by Application 2020 & 2033
- Table 90: Oceania Roller Ball Bottle Volume (K) Forecast, by Application 2020 & 2033
- Table 91: Rest of Asia Pacific Roller Ball Bottle Revenue (undefined) Forecast, by Application 2020 & 2033
- Table 92: Rest of Asia Pacific Roller Ball Bottle Volume (K) Forecast, by Application 2020 & 2033
Frequently Asked Questions
1. What is the projected Compound Annual Growth Rate (CAGR) of the Roller Ball Bottle?
The projected CAGR is approximately 10.41%.
2. Which companies are prominent players in the Roller Ball Bottle?
Key companies in the market include Stoelzle Glass Group, Vivaplex, Schott AG, Piramal Glass Limited, Stocksmetic, SGB Packaging, Owens-Illinois Inc., Amcor, Gerresheimer, Hindustan National Glass & Industries, Ardagh Group, HEINZ-GLAS GmbH & Co. KGaA.
3. What are the main segments of the Roller Ball Bottle?
The market segments include Application, Types.
4. Can you provide details about the market size?
The market size is estimated to be USD XXX N/A as of 2022.
5. What are some drivers contributing to market growth?
N/A
6. What are the notable trends driving market growth?
N/A
7. Are there any restraints impacting market growth?
N/A
8. Can you provide examples of recent developments in the market?
N/A
9. What pricing options are available for accessing the report?
Pricing options include single-user, multi-user, and enterprise licenses priced at USD 3350.00, USD 5025.00, and USD 6700.00 respectively.
10. Is the market size provided in terms of value or volume?
The market size is provided in terms of value, measured in N/A and volume, measured in K.
11. Are there any specific market keywords associated with the report?
Yes, the market keyword associated with the report is "Roller Ball Bottle," which aids in identifying and referencing the specific market segment covered.
12. How do I determine which pricing option suits my needs best?
The pricing options vary based on user requirements and access needs. Individual users may opt for single-user licenses, while businesses requiring broader access may choose multi-user or enterprise licenses for cost-effective access to the report.
13. Are there any additional resources or data provided in the Roller Ball Bottle report?
While the report offers comprehensive insights, it's advisable to review the specific contents or supplementary materials provided to ascertain if additional resources or data are available.
14. How can I stay updated on further developments or reports in the Roller Ball Bottle?
To stay informed about further developments, trends, and reports in the Roller Ball Bottle, consider subscribing to industry newsletters, following relevant companies and organizations, or regularly checking reputable industry news sources and publications.
Methodology
Step 1 - Identification of Relevant Samples Size from Population Database


Step 2 - Approaches for Defining Global Market Size (Value, Volume* & Price*)

Note*: In applicable scenarios
Step 3 - Data Sources
Primary Research
- Web Analytics
- Survey Reports
- Research Institute
- Latest Research Reports
- Opinion Leaders
Secondary Research
- Annual Reports
- White Paper
- Latest Press Release
- Industry Association
- Paid Database
- Investor Presentations

Step 4 - Data Triangulation
Involves using different sources of information in order to increase the validity of a study
These sources are likely to be stakeholders in a program - participants, other researchers, program staff, other community members, and so on.
Then we put all data in single framework & apply various statistical tools to find out the dynamic on the market.
During the analysis stage, feedback from the stakeholder groups would be compared to determine areas of agreement as well as areas of divergence