

Key Insights
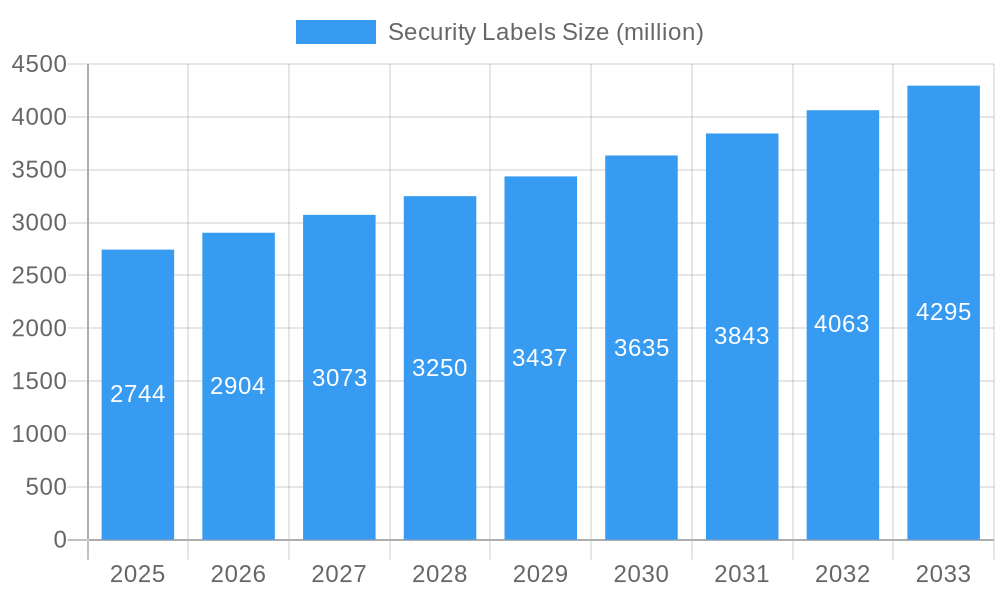
The global security labels market is poised for substantial growth, projected to reach an estimated USD 2744 million by 2025, with a robust Compound Annual Growth Rate (CAGR) of 5.7% expected to extend through the forecast period ending in 2033. This expansion is driven by an escalating demand for product authenticity and brand protection across a multitude of industries. The increasing sophistication of counterfeiters and the growing awareness among consumers regarding the risks associated with fake products are significant catalysts. Industries like Food & Beverage, Healthcare & Pharmaceutical, and Personal Care & Cosmetics are leading this charge, actively investing in advanced security labeling solutions to safeguard their products and consumer trust. Emerging economies, particularly in the Asia Pacific region, are anticipated to contribute significantly to this growth trajectory, owing to rapid industrialization and a burgeoning middle class with greater purchasing power and awareness of branded goods. The market's evolution is characterized by innovation in material science and printing technologies, leading to more sophisticated and difficult-to-replicate security features.
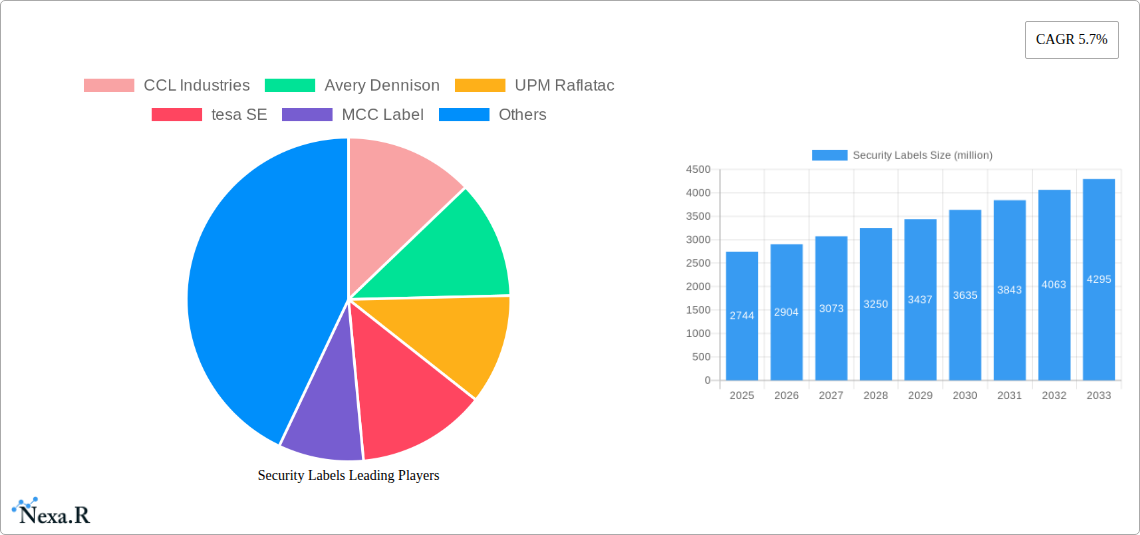
Security Labels Market Size (In Billion)
Further analysis reveals that the security labels market is segmented into distinct types, including Non-Residue Security Labels and Dual Layer Security Labels, each catering to specific application needs and security requirements. The Non-Residue variant is crucial for applications where the label needs to be removed without leaving any trace, vital for reusable packaging or sensitive electronic components. Dual Layer Security Labels offer enhanced tamper-evidence, providing an additional layer of security against unauthorized access. Key players such as CCL Industries, Avery Dennison, and UPM Raflatac are at the forefront of this innovation, investing heavily in research and development to offer cutting-edge solutions. Geographically, North America and Europe currently hold substantial market shares due to stringent regulatory frameworks and a mature market for high-value goods. However, the Asia Pacific region is expected to witness the fastest growth, driven by the expanding manufacturing base and the increasing need for brand protection in e-commerce and retail sectors. The primary restraint for the market, while not explicitly stated, is likely the cost associated with implementing advanced security labeling solutions, which may pose a challenge for smaller businesses or those operating in price-sensitive markets.
Security Labels Company Market Share
Comprehensive Security Labels Market Report: Trends, Opportunities, and Future Outlook (2019-2033)
Unlock the strategic insights shaping the global security labels market. This in-depth report provides a critical analysis of market dynamics, growth trends, regional dominance, and technological advancements within the security labels industry. Essential for stakeholders in packaging, supply chain management, brand protection, and product authentication, this report offers a forward-looking perspective on a rapidly evolving sector.
Target audience: Brand owners, manufacturers, packaging converters, regulatory bodies, investment firms, and technology providers.
Study Period: 2019–2033 | Base Year: 2025 | Estimated Year: 2025 | Forecast Period: 2025–2033 | Historical Period: 2019–2024
Security Labels Market Dynamics & Structure
The global security labels market is characterized by a moderate to high concentration, with leading players like CCL Industries, Avery Dennison, and UPM Raflatac holding significant market shares. Technological innovation is a primary driver, fueled by the escalating need for anti-counterfeiting solutions and enhanced supply chain integrity across various industries. Regulatory frameworks, particularly in pharmaceuticals and food & beverage, are increasingly mandating stringent product authentication measures, further bolstering market demand. Competitive product substitutes, while present, are often outpaced by the advanced features offered by specialized security labels, such as tamper-evident mechanisms, RFID integration, and covert authentication technologies. End-user demographics are broad, encompassing businesses seeking to protect brand reputation and prevent product diversion, alongside consumers demanding assurance of product authenticity. Mergers and acquisitions (M&A) remain a strategic avenue for market expansion and technology acquisition, with notable deal volumes observed in recent years as larger entities consolidate their positions and smaller innovators seek strategic partnerships. Barriers to innovation include the high cost of R&D for sophisticated security features and the challenge of widespread adoption of new technologies across diverse supply chains.
- Market Concentration: Moderate to high, dominated by key global players.
- Technological Innovation Drivers: Anti-counterfeiting, supply chain traceability, brand protection.
- Regulatory Frameworks: Stringent mandates in healthcare, pharmaceuticals, and food & beverage sectors.
- Competitive Product Substitutes: Limited effectiveness against advanced security label solutions.
- End-User Demographics: Brand owners, manufacturers, retailers, government agencies.
- M&A Trends: Active consolidation, strategic acquisitions for technological advancement.
- Innovation Barriers: High R&D costs, adoption challenges across varied industries.
Security Labels Growth Trends & Insights
The security labels market is experiencing robust and sustained growth, projected to expand significantly over the forecast period. This expansion is intrinsically linked to the escalating global threat of counterfeiting and product diversion, which cost industries billions of dollars annually. The market size is estimated to reach $18,500 million in 2025, with a projected Compound Annual Growth Rate (CAGR) of 7.8% from 2025 to 2033, reaching approximately $32,500 million by 2033. Adoption rates for advanced security labeling solutions are on an upward trajectory, driven by both proactive brand protection strategies and reactive responses to incidents of fraud and counterfeiting.
Technological disruptions are profoundly shaping market evolution. The integration of overt, covert, and forensic security features, such as holograms, micro-text, UV-reactive inks, and serialized unique identifiers, is becoming standard practice. Furthermore, the convergence of security labels with digital technologies, including QR codes, NFC, and RFID, is enabling enhanced track-and-trace capabilities and direct consumer engagement, thereby adding significant value beyond simple tamper-evidence. This digital integration facilitates seamless integration with blockchain technologies for immutable record-keeping, further strengthening supply chain transparency and authenticity verification.
Consumer behavior shifts are also playing a pivotal role. Consumers are increasingly aware of and concerned about product authenticity, particularly in sensitive sectors like pharmaceuticals and food. This heightened awareness translates into a preference for products that offer demonstrable security features, pushing brands to invest in reliable authentication solutions. The demand for ethical sourcing and supply chain transparency further amplifies the need for robust security labeling, providing consumers with the confidence they seek in their purchasing decisions. The market penetration of advanced security labels is expected to deepen, moving from niche applications to mainstream adoption across a wider spectrum of consumer goods.
- Market Size Evolution: Growing from an estimated $18,500 million in 2025 to over $32,500 million by 2033.
- CAGR: 7.8% during the forecast period (2025-2033).
- Adoption Rates: Steadily increasing, driven by anti-counterfeiting imperatives.
- Technological Disruptions: Integration of overt, covert, forensic features, RFID, NFC, and digital links.
- Consumer Behavior Shifts: Growing demand for product authenticity assurance and supply chain transparency.
- Market Penetration: Deepening across various consumer goods sectors.
Dominant Regions, Countries, or Segments in Security Labels
The Healthcare & Pharmaceutical segment is poised to be the dominant force driving growth in the global security labels market. This dominance stems from the critical need to safeguard the integrity of high-value, life-saving medications and healthcare products against counterfeiting and diversion, which can have severe public health consequences. Stringent regulatory requirements, such as the Drug Supply Chain Security Act (DSCSA) in the United States and similar mandates in Europe and Asia, mandate serialization and track-and-trace capabilities, directly fueling the demand for advanced security labels. The estimated market share for the healthcare and pharmaceutical application is projected to be around 35% in 2025, with a forecast CAGR of 8.2% during the forecast period.
North America, particularly the United States, is identified as a leading country due to its robust regulatory environment, high healthcare spending, and significant presence of pharmaceutical giants and contract manufacturing organizations. The region's proactive stance on drug diversion and counterfeiting, coupled with advanced technological adoption, positions it at the forefront of security label innovation and demand. The market share of North America in the security labels sector is estimated to be 30% in 2025, with a projected CAGR of 7.5%.
Among the types of security labels, Non-Residue Security Labels are experiencing significant demand due to their ability to provide clear evidence of tampering without leaving adhesive residue on the product or packaging. This is crucial for maintaining product aesthetics and preventing damage to high-value goods. The market share for Non-Residue Security Labels is estimated at 40% in 2025, with a forecasted CAGR of 8.0%.
- Dominant Application: Healthcare & Pharmaceutical (estimated 35% market share in 2025, 8.2% CAGR).
- Key Drivers: Strict regulations, high-value products, severe public health risks associated with counterfeiting.
- Market Share Growth: Expected to outpace other applications due to unwavering demand for product integrity.
- Dominant Region: North America (estimated 30% market share in 2025, 7.5% CAGR).
- Key Drivers: Advanced regulatory frameworks (e.g., DSCSA), high healthcare expenditure, strong emphasis on brand protection.
- Economic Policies: Government initiatives promoting supply chain security and anti-counterfeiting measures.
- Dominant Type: Non-Residue Security Labels (estimated 40% market share in 2025, 8.0% CAGR).
- Key Drivers: Superior tamper-evidence without damaging product aesthetics.
- Technological Advancements: Innovations in adhesive technology and substrate materials enhancing performance.
Security Labels Product Landscape
The security labels product landscape is characterized by a dynamic array of innovations focused on enhanced tamper-evidence, brand protection, and supply chain traceability. Product advancements include the integration of micro-taggants for forensic authentication, holographic overlays that are difficult to replicate, and variable data printing for serialization and track-and-trace capabilities. Unique selling propositions revolve around the layered security approach, combining overt visual indicators with covert features accessible only with specialized equipment. Technological advancements are also seen in smart labels that incorporate RFID or NFC technology, enabling seamless integration with digital platforms for real-time authentication and inventory management. Performance metrics emphasize durability, resistance to tampering, and the ability to withstand various environmental conditions across diverse supply chains.
Key Drivers, Barriers & Challenges in Security Labels
Key Drivers:
The security labels market is propelled by several critical factors. The escalating global threat of counterfeit goods, estimated to cost the global economy trillions of dollars annually, is the foremost driver. Increasing regulatory pressure, particularly in the pharmaceutical, food and beverage, and luxury goods sectors, mandates robust product authentication and track-and-trace capabilities. Technological advancements in printing and material science enable the development of more sophisticated and cost-effective security features. Furthermore, growing consumer demand for authentic products and concerns about health and safety are pushing brands to adopt advanced labeling solutions. The need to protect brand reputation and prevent product diversion also plays a significant role.
Key Barriers & Challenges:
Despite robust growth, the industry faces several hurdles. High initial investment costs for implementing advanced security labeling technologies can be a significant barrier for small and medium-sized enterprises (SMEs). The complexity of supply chains and the need for standardization across different regions and industries present integration challenges. Rapid technological evolution necessitates continuous investment in R&D and infrastructure upgrades. Furthermore, competition from lower-cost, less secure labeling solutions can pose a challenge in price-sensitive markets. Supply chain disruptions, as seen in recent global events, can impact the availability of raw materials and increase production costs. The ongoing battle against sophisticated counterfeiters who constantly adapt their methods also presents a persistent challenge.
Emerging Opportunities in Security Labels
Emerging opportunities in the security labels market are centered around the integration of digital technologies and the expansion into new application areas. The growth of the Internet of Things (IoT) presents a significant opportunity for smart security labels that incorporate RFID or NFC tags, enabling seamless data exchange for enhanced inventory management, authentication, and consumer engagement. Untapped markets in emerging economies with growing middle classes and increasing consumption of branded goods offer substantial growth potential. Innovative applications in sectors like electric vehicle battery tracking, high-value asset protection, and secure document management are also emerging. Evolving consumer preferences for sustainable and secure packaging are creating demand for eco-friendly security label solutions.
Growth Accelerators in the Security Labels Industry
Several catalysts are accelerating long-term growth in the security labels industry. Technological breakthroughs, such as the development of more sophisticated covert security features and advanced anti-counterfeiting inks, are continuously enhancing label efficacy. Strategic partnerships between security label manufacturers, technology providers, and brand owners are fostering collaborative innovation and wider adoption of integrated solutions. Market expansion strategies, including penetration into underdeveloped regions and diversification into new product categories and industries, are also driving growth. The increasing adoption of serialization and track-and-trace mandates globally acts as a powerful accelerator, compelling businesses to invest in secure labeling.
Key Players Shaping the Security Labels Market
- CCL Industries
- Avery Dennison
- UPM Raflatac
- tesa SE
- MCC Label
- Honeywell
- Mercian Labels
- Brady
- CILS International
- Autajon Group
- orfix International
- Securikett
- KURZ
- Seiko Instruments
- Groupdc
Notable Milestones in Security Labels Sector
- 2020: Introduction of advanced overt and covert security features by leading manufacturers, enhancing tamper-evidence capabilities.
- 2021: Increased adoption of RFID and NFC-enabled security labels for enhanced supply chain visibility and authentication.
- 2022: Significant surge in M&A activities as major players aim to consolidate market share and acquire innovative technologies.
- 2023: Growing emphasis on serialization and unique identifiers due to stricter pharmaceutical track-and-trace regulations globally.
- 2024: Development of sustainable security label solutions addressing environmental concerns alongside brand protection needs.
In-Depth Security Labels Market Outlook
The future outlook for the security labels market remains exceptionally strong, driven by an unwavering global commitment to combating counterfeiting and ensuring product integrity. Growth accelerators, including ongoing technological innovation in authentication features and the pervasive integration of digital technologies like RFID and NFC, will continue to expand market horizons. Strategic partnerships and collaborations will foster ecosystem development, leading to more comprehensive and effective security solutions. The continuous evolution of regulatory landscapes worldwide will further solidify the demand for advanced security labeling. Emerging opportunities in untapped geographical markets and nascent application areas, coupled with a growing consumer consciousness regarding product authenticity, position the security labels industry for sustained and accelerated growth throughout the forecast period.
Security Labels Segmentation
-
1. Application
- 1.1. Food and Beverage
- 1.2. Healthcare & Pharmaceutical
- 1.3. Personal Care and Cosmetics
- 1.4. Consumer Durables
- 1.5. Industrial
- 1.6. Others
-
2. Type
- 2.1. Non-Residue Security Labels
- 2.2. Dual Layer Security Labels
- 2.3. Security Tape
Security Labels Segmentation By Geography
-
1. North America
- 1.1. United States
- 1.2. Canada
- 1.3. Mexico
-
2. South America
- 2.1. Brazil
- 2.2. Argentina
- 2.3. Rest of South America
-
3. Europe
- 3.1. United Kingdom
- 3.2. Germany
- 3.3. France
- 3.4. Italy
- 3.5. Spain
- 3.6. Russia
- 3.7. Benelux
- 3.8. Nordics
- 3.9. Rest of Europe
-
4. Middle East & Africa
- 4.1. Turkey
- 4.2. Israel
- 4.3. GCC
- 4.4. North Africa
- 4.5. South Africa
- 4.6. Rest of Middle East & Africa
-
5. Asia Pacific
- 5.1. China
- 5.2. India
- 5.3. Japan
- 5.4. South Korea
- 5.5. ASEAN
- 5.6. Oceania
- 5.7. Rest of Asia Pacific
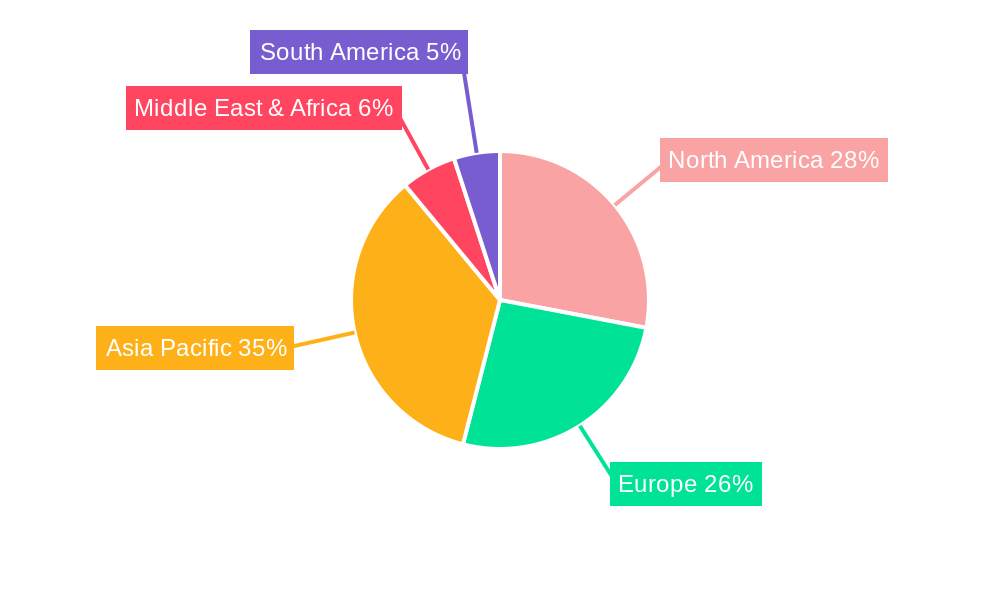
Security Labels Regional Market Share
Geographic Coverage of Security Labels
Security Labels REPORT HIGHLIGHTS
| Aspects | Details |
|---|---|
| Study Period | 2020-2034 |
| Base Year | 2025 |
| Estimated Year | 2026 |
| Forecast Period | 2026-2034 |
| Historical Period | 2020-2025 |
| Growth Rate | CAGR of 10.14% from 2020-2034 |
| Segmentation |
|
Table of Contents
- 1. Introduction
- 1.1. Research Scope
- 1.2. Market Segmentation
- 1.3. Research Methodology
- 1.4. Definitions and Assumptions
- 2. Executive Summary
- 2.1. Introduction
- 3. Market Dynamics
- 3.1. Introduction
- 3.2. Market Drivers
- 3.3. Market Restrains
- 3.4. Market Trends
- 4. Market Factor Analysis
- 4.1. Porters Five Forces
- 4.2. Supply/Value Chain
- 4.3. PESTEL analysis
- 4.4. Market Entropy
- 4.5. Patent/Trademark Analysis
- 5. Global Security Labels Analysis, Insights and Forecast, 2020-2032
- 5.1. Market Analysis, Insights and Forecast - by Application
- 5.1.1. Food and Beverage
- 5.1.2. Healthcare & Pharmaceutical
- 5.1.3. Personal Care and Cosmetics
- 5.1.4. Consumer Durables
- 5.1.5. Industrial
- 5.1.6. Others
- 5.2. Market Analysis, Insights and Forecast - by Type
- 5.2.1. Non-Residue Security Labels
- 5.2.2. Dual Layer Security Labels
- 5.2.3. Security Tape
- 5.3. Market Analysis, Insights and Forecast - by Region
- 5.3.1. North America
- 5.3.2. South America
- 5.3.3. Europe
- 5.3.4. Middle East & Africa
- 5.3.5. Asia Pacific
- 5.1. Market Analysis, Insights and Forecast - by Application
- 6. North America Security Labels Analysis, Insights and Forecast, 2020-2032
- 6.1. Market Analysis, Insights and Forecast - by Application
- 6.1.1. Food and Beverage
- 6.1.2. Healthcare & Pharmaceutical
- 6.1.3. Personal Care and Cosmetics
- 6.1.4. Consumer Durables
- 6.1.5. Industrial
- 6.1.6. Others
- 6.2. Market Analysis, Insights and Forecast - by Type
- 6.2.1. Non-Residue Security Labels
- 6.2.2. Dual Layer Security Labels
- 6.2.3. Security Tape
- 6.1. Market Analysis, Insights and Forecast - by Application
- 7. South America Security Labels Analysis, Insights and Forecast, 2020-2032
- 7.1. Market Analysis, Insights and Forecast - by Application
- 7.1.1. Food and Beverage
- 7.1.2. Healthcare & Pharmaceutical
- 7.1.3. Personal Care and Cosmetics
- 7.1.4. Consumer Durables
- 7.1.5. Industrial
- 7.1.6. Others
- 7.2. Market Analysis, Insights and Forecast - by Type
- 7.2.1. Non-Residue Security Labels
- 7.2.2. Dual Layer Security Labels
- 7.2.3. Security Tape
- 7.1. Market Analysis, Insights and Forecast - by Application
- 8. Europe Security Labels Analysis, Insights and Forecast, 2020-2032
- 8.1. Market Analysis, Insights and Forecast - by Application
- 8.1.1. Food and Beverage
- 8.1.2. Healthcare & Pharmaceutical
- 8.1.3. Personal Care and Cosmetics
- 8.1.4. Consumer Durables
- 8.1.5. Industrial
- 8.1.6. Others
- 8.2. Market Analysis, Insights and Forecast - by Type
- 8.2.1. Non-Residue Security Labels
- 8.2.2. Dual Layer Security Labels
- 8.2.3. Security Tape
- 8.1. Market Analysis, Insights and Forecast - by Application
- 9. Middle East & Africa Security Labels Analysis, Insights and Forecast, 2020-2032
- 9.1. Market Analysis, Insights and Forecast - by Application
- 9.1.1. Food and Beverage
- 9.1.2. Healthcare & Pharmaceutical
- 9.1.3. Personal Care and Cosmetics
- 9.1.4. Consumer Durables
- 9.1.5. Industrial
- 9.1.6. Others
- 9.2. Market Analysis, Insights and Forecast - by Type
- 9.2.1. Non-Residue Security Labels
- 9.2.2. Dual Layer Security Labels
- 9.2.3. Security Tape
- 9.1. Market Analysis, Insights and Forecast - by Application
- 10. Asia Pacific Security Labels Analysis, Insights and Forecast, 2020-2032
- 10.1. Market Analysis, Insights and Forecast - by Application
- 10.1.1. Food and Beverage
- 10.1.2. Healthcare & Pharmaceutical
- 10.1.3. Personal Care and Cosmetics
- 10.1.4. Consumer Durables
- 10.1.5. Industrial
- 10.1.6. Others
- 10.2. Market Analysis, Insights and Forecast - by Type
- 10.2.1. Non-Residue Security Labels
- 10.2.2. Dual Layer Security Labels
- 10.2.3. Security Tape
- 10.1. Market Analysis, Insights and Forecast - by Application
- 11. Competitive Analysis
- 11.1. Global Market Share Analysis 2025
- 11.2. Company Profiles
- 11.2.1 CCL Industries
- 11.2.1.1. Overview
- 11.2.1.2. Products
- 11.2.1.3. SWOT Analysis
- 11.2.1.4. Recent Developments
- 11.2.1.5. Financials (Based on Availability)
- 11.2.2 Avery Dennison
- 11.2.2.1. Overview
- 11.2.2.2. Products
- 11.2.2.3. SWOT Analysis
- 11.2.2.4. Recent Developments
- 11.2.2.5. Financials (Based on Availability)
- 11.2.3 UPM Raflatac
- 11.2.3.1. Overview
- 11.2.3.2. Products
- 11.2.3.3. SWOT Analysis
- 11.2.3.4. Recent Developments
- 11.2.3.5. Financials (Based on Availability)
- 11.2.4 tesa SE
- 11.2.4.1. Overview
- 11.2.4.2. Products
- 11.2.4.3. SWOT Analysis
- 11.2.4.4. Recent Developments
- 11.2.4.5. Financials (Based on Availability)
- 11.2.5 MCC Label
- 11.2.5.1. Overview
- 11.2.5.2. Products
- 11.2.5.3. SWOT Analysis
- 11.2.5.4. Recent Developments
- 11.2.5.5. Financials (Based on Availability)
- 11.2.6 Honeywell
- 11.2.6.1. Overview
- 11.2.6.2. Products
- 11.2.6.3. SWOT Analysis
- 11.2.6.4. Recent Developments
- 11.2.6.5. Financials (Based on Availability)
- 11.2.7 Mercian Labels
- 11.2.7.1. Overview
- 11.2.7.2. Products
- 11.2.7.3. SWOT Analysis
- 11.2.7.4. Recent Developments
- 11.2.7.5. Financials (Based on Availability)
- 11.2.8 Brady
- 11.2.8.1. Overview
- 11.2.8.2. Products
- 11.2.8.3. SWOT Analysis
- 11.2.8.4. Recent Developments
- 11.2.8.5. Financials (Based on Availability)
- 11.2.9 CILS international
- 11.2.9.1. Overview
- 11.2.9.2. Products
- 11.2.9.3. SWOT Analysis
- 11.2.9.4. Recent Developments
- 11.2.9.5. Financials (Based on Availability)
- 11.2.10 Autajon Group
- 11.2.10.1. Overview
- 11.2.10.2. Products
- 11.2.10.3. SWOT Analysis
- 11.2.10.4. Recent Developments
- 11.2.10.5. Financials (Based on Availability)
- 11.2.11 orfix International
- 11.2.11.1. Overview
- 11.2.11.2. Products
- 11.2.11.3. SWOT Analysis
- 11.2.11.4. Recent Developments
- 11.2.11.5. Financials (Based on Availability)
- 11.2.12 Securikett
- 11.2.12.1. Overview
- 11.2.12.2. Products
- 11.2.12.3. SWOT Analysis
- 11.2.12.4. Recent Developments
- 11.2.12.5. Financials (Based on Availability)
- 11.2.13 KURZ
- 11.2.13.1. Overview
- 11.2.13.2. Products
- 11.2.13.3. SWOT Analysis
- 11.2.13.4. Recent Developments
- 11.2.13.5. Financials (Based on Availability)
- 11.2.14 Seiko Instruments
- 11.2.14.1. Overview
- 11.2.14.2. Products
- 11.2.14.3. SWOT Analysis
- 11.2.14.4. Recent Developments
- 11.2.14.5. Financials (Based on Availability)
- 11.2.15 Groupdc
- 11.2.15.1. Overview
- 11.2.15.2. Products
- 11.2.15.3. SWOT Analysis
- 11.2.15.4. Recent Developments
- 11.2.15.5. Financials (Based on Availability)
- 11.2.1 CCL Industries
List of Figures
- Figure 1: Global Security Labels Revenue Breakdown (undefined, %) by Region 2025 & 2033
- Figure 2: Global Security Labels Volume Breakdown (K, %) by Region 2025 & 2033
- Figure 3: North America Security Labels Revenue (undefined), by Application 2025 & 2033
- Figure 4: North America Security Labels Volume (K), by Application 2025 & 2033
- Figure 5: North America Security Labels Revenue Share (%), by Application 2025 & 2033
- Figure 6: North America Security Labels Volume Share (%), by Application 2025 & 2033
- Figure 7: North America Security Labels Revenue (undefined), by Type 2025 & 2033
- Figure 8: North America Security Labels Volume (K), by Type 2025 & 2033
- Figure 9: North America Security Labels Revenue Share (%), by Type 2025 & 2033
- Figure 10: North America Security Labels Volume Share (%), by Type 2025 & 2033
- Figure 11: North America Security Labels Revenue (undefined), by Country 2025 & 2033
- Figure 12: North America Security Labels Volume (K), by Country 2025 & 2033
- Figure 13: North America Security Labels Revenue Share (%), by Country 2025 & 2033
- Figure 14: North America Security Labels Volume Share (%), by Country 2025 & 2033
- Figure 15: South America Security Labels Revenue (undefined), by Application 2025 & 2033
- Figure 16: South America Security Labels Volume (K), by Application 2025 & 2033
- Figure 17: South America Security Labels Revenue Share (%), by Application 2025 & 2033
- Figure 18: South America Security Labels Volume Share (%), by Application 2025 & 2033
- Figure 19: South America Security Labels Revenue (undefined), by Type 2025 & 2033
- Figure 20: South America Security Labels Volume (K), by Type 2025 & 2033
- Figure 21: South America Security Labels Revenue Share (%), by Type 2025 & 2033
- Figure 22: South America Security Labels Volume Share (%), by Type 2025 & 2033
- Figure 23: South America Security Labels Revenue (undefined), by Country 2025 & 2033
- Figure 24: South America Security Labels Volume (K), by Country 2025 & 2033
- Figure 25: South America Security Labels Revenue Share (%), by Country 2025 & 2033
- Figure 26: South America Security Labels Volume Share (%), by Country 2025 & 2033
- Figure 27: Europe Security Labels Revenue (undefined), by Application 2025 & 2033
- Figure 28: Europe Security Labels Volume (K), by Application 2025 & 2033
- Figure 29: Europe Security Labels Revenue Share (%), by Application 2025 & 2033
- Figure 30: Europe Security Labels Volume Share (%), by Application 2025 & 2033
- Figure 31: Europe Security Labels Revenue (undefined), by Type 2025 & 2033
- Figure 32: Europe Security Labels Volume (K), by Type 2025 & 2033
- Figure 33: Europe Security Labels Revenue Share (%), by Type 2025 & 2033
- Figure 34: Europe Security Labels Volume Share (%), by Type 2025 & 2033
- Figure 35: Europe Security Labels Revenue (undefined), by Country 2025 & 2033
- Figure 36: Europe Security Labels Volume (K), by Country 2025 & 2033
- Figure 37: Europe Security Labels Revenue Share (%), by Country 2025 & 2033
- Figure 38: Europe Security Labels Volume Share (%), by Country 2025 & 2033
- Figure 39: Middle East & Africa Security Labels Revenue (undefined), by Application 2025 & 2033
- Figure 40: Middle East & Africa Security Labels Volume (K), by Application 2025 & 2033
- Figure 41: Middle East & Africa Security Labels Revenue Share (%), by Application 2025 & 2033
- Figure 42: Middle East & Africa Security Labels Volume Share (%), by Application 2025 & 2033
- Figure 43: Middle East & Africa Security Labels Revenue (undefined), by Type 2025 & 2033
- Figure 44: Middle East & Africa Security Labels Volume (K), by Type 2025 & 2033
- Figure 45: Middle East & Africa Security Labels Revenue Share (%), by Type 2025 & 2033
- Figure 46: Middle East & Africa Security Labels Volume Share (%), by Type 2025 & 2033
- Figure 47: Middle East & Africa Security Labels Revenue (undefined), by Country 2025 & 2033
- Figure 48: Middle East & Africa Security Labels Volume (K), by Country 2025 & 2033
- Figure 49: Middle East & Africa Security Labels Revenue Share (%), by Country 2025 & 2033
- Figure 50: Middle East & Africa Security Labels Volume Share (%), by Country 2025 & 2033
- Figure 51: Asia Pacific Security Labels Revenue (undefined), by Application 2025 & 2033
- Figure 52: Asia Pacific Security Labels Volume (K), by Application 2025 & 2033
- Figure 53: Asia Pacific Security Labels Revenue Share (%), by Application 2025 & 2033
- Figure 54: Asia Pacific Security Labels Volume Share (%), by Application 2025 & 2033
- Figure 55: Asia Pacific Security Labels Revenue (undefined), by Type 2025 & 2033
- Figure 56: Asia Pacific Security Labels Volume (K), by Type 2025 & 2033
- Figure 57: Asia Pacific Security Labels Revenue Share (%), by Type 2025 & 2033
- Figure 58: Asia Pacific Security Labels Volume Share (%), by Type 2025 & 2033
- Figure 59: Asia Pacific Security Labels Revenue (undefined), by Country 2025 & 2033
- Figure 60: Asia Pacific Security Labels Volume (K), by Country 2025 & 2033
- Figure 61: Asia Pacific Security Labels Revenue Share (%), by Country 2025 & 2033
- Figure 62: Asia Pacific Security Labels Volume Share (%), by Country 2025 & 2033
List of Tables
- Table 1: Global Security Labels Revenue undefined Forecast, by Application 2020 & 2033
- Table 2: Global Security Labels Volume K Forecast, by Application 2020 & 2033
- Table 3: Global Security Labels Revenue undefined Forecast, by Type 2020 & 2033
- Table 4: Global Security Labels Volume K Forecast, by Type 2020 & 2033
- Table 5: Global Security Labels Revenue undefined Forecast, by Region 2020 & 2033
- Table 6: Global Security Labels Volume K Forecast, by Region 2020 & 2033
- Table 7: Global Security Labels Revenue undefined Forecast, by Application 2020 & 2033
- Table 8: Global Security Labels Volume K Forecast, by Application 2020 & 2033
- Table 9: Global Security Labels Revenue undefined Forecast, by Type 2020 & 2033
- Table 10: Global Security Labels Volume K Forecast, by Type 2020 & 2033
- Table 11: Global Security Labels Revenue undefined Forecast, by Country 2020 & 2033
- Table 12: Global Security Labels Volume K Forecast, by Country 2020 & 2033
- Table 13: United States Security Labels Revenue (undefined) Forecast, by Application 2020 & 2033
- Table 14: United States Security Labels Volume (K) Forecast, by Application 2020 & 2033
- Table 15: Canada Security Labels Revenue (undefined) Forecast, by Application 2020 & 2033
- Table 16: Canada Security Labels Volume (K) Forecast, by Application 2020 & 2033
- Table 17: Mexico Security Labels Revenue (undefined) Forecast, by Application 2020 & 2033
- Table 18: Mexico Security Labels Volume (K) Forecast, by Application 2020 & 2033
- Table 19: Global Security Labels Revenue undefined Forecast, by Application 2020 & 2033
- Table 20: Global Security Labels Volume K Forecast, by Application 2020 & 2033
- Table 21: Global Security Labels Revenue undefined Forecast, by Type 2020 & 2033
- Table 22: Global Security Labels Volume K Forecast, by Type 2020 & 2033
- Table 23: Global Security Labels Revenue undefined Forecast, by Country 2020 & 2033
- Table 24: Global Security Labels Volume K Forecast, by Country 2020 & 2033
- Table 25: Brazil Security Labels Revenue (undefined) Forecast, by Application 2020 & 2033
- Table 26: Brazil Security Labels Volume (K) Forecast, by Application 2020 & 2033
- Table 27: Argentina Security Labels Revenue (undefined) Forecast, by Application 2020 & 2033
- Table 28: Argentina Security Labels Volume (K) Forecast, by Application 2020 & 2033
- Table 29: Rest of South America Security Labels Revenue (undefined) Forecast, by Application 2020 & 2033
- Table 30: Rest of South America Security Labels Volume (K) Forecast, by Application 2020 & 2033
- Table 31: Global Security Labels Revenue undefined Forecast, by Application 2020 & 2033
- Table 32: Global Security Labels Volume K Forecast, by Application 2020 & 2033
- Table 33: Global Security Labels Revenue undefined Forecast, by Type 2020 & 2033
- Table 34: Global Security Labels Volume K Forecast, by Type 2020 & 2033
- Table 35: Global Security Labels Revenue undefined Forecast, by Country 2020 & 2033
- Table 36: Global Security Labels Volume K Forecast, by Country 2020 & 2033
- Table 37: United Kingdom Security Labels Revenue (undefined) Forecast, by Application 2020 & 2033
- Table 38: United Kingdom Security Labels Volume (K) Forecast, by Application 2020 & 2033
- Table 39: Germany Security Labels Revenue (undefined) Forecast, by Application 2020 & 2033
- Table 40: Germany Security Labels Volume (K) Forecast, by Application 2020 & 2033
- Table 41: France Security Labels Revenue (undefined) Forecast, by Application 2020 & 2033
- Table 42: France Security Labels Volume (K) Forecast, by Application 2020 & 2033
- Table 43: Italy Security Labels Revenue (undefined) Forecast, by Application 2020 & 2033
- Table 44: Italy Security Labels Volume (K) Forecast, by Application 2020 & 2033
- Table 45: Spain Security Labels Revenue (undefined) Forecast, by Application 2020 & 2033
- Table 46: Spain Security Labels Volume (K) Forecast, by Application 2020 & 2033
- Table 47: Russia Security Labels Revenue (undefined) Forecast, by Application 2020 & 2033
- Table 48: Russia Security Labels Volume (K) Forecast, by Application 2020 & 2033
- Table 49: Benelux Security Labels Revenue (undefined) Forecast, by Application 2020 & 2033
- Table 50: Benelux Security Labels Volume (K) Forecast, by Application 2020 & 2033
- Table 51: Nordics Security Labels Revenue (undefined) Forecast, by Application 2020 & 2033
- Table 52: Nordics Security Labels Volume (K) Forecast, by Application 2020 & 2033
- Table 53: Rest of Europe Security Labels Revenue (undefined) Forecast, by Application 2020 & 2033
- Table 54: Rest of Europe Security Labels Volume (K) Forecast, by Application 2020 & 2033
- Table 55: Global Security Labels Revenue undefined Forecast, by Application 2020 & 2033
- Table 56: Global Security Labels Volume K Forecast, by Application 2020 & 2033
- Table 57: Global Security Labels Revenue undefined Forecast, by Type 2020 & 2033
- Table 58: Global Security Labels Volume K Forecast, by Type 2020 & 2033
- Table 59: Global Security Labels Revenue undefined Forecast, by Country 2020 & 2033
- Table 60: Global Security Labels Volume K Forecast, by Country 2020 & 2033
- Table 61: Turkey Security Labels Revenue (undefined) Forecast, by Application 2020 & 2033
- Table 62: Turkey Security Labels Volume (K) Forecast, by Application 2020 & 2033
- Table 63: Israel Security Labels Revenue (undefined) Forecast, by Application 2020 & 2033
- Table 64: Israel Security Labels Volume (K) Forecast, by Application 2020 & 2033
- Table 65: GCC Security Labels Revenue (undefined) Forecast, by Application 2020 & 2033
- Table 66: GCC Security Labels Volume (K) Forecast, by Application 2020 & 2033
- Table 67: North Africa Security Labels Revenue (undefined) Forecast, by Application 2020 & 2033
- Table 68: North Africa Security Labels Volume (K) Forecast, by Application 2020 & 2033
- Table 69: South Africa Security Labels Revenue (undefined) Forecast, by Application 2020 & 2033
- Table 70: South Africa Security Labels Volume (K) Forecast, by Application 2020 & 2033
- Table 71: Rest of Middle East & Africa Security Labels Revenue (undefined) Forecast, by Application 2020 & 2033
- Table 72: Rest of Middle East & Africa Security Labels Volume (K) Forecast, by Application 2020 & 2033
- Table 73: Global Security Labels Revenue undefined Forecast, by Application 2020 & 2033
- Table 74: Global Security Labels Volume K Forecast, by Application 2020 & 2033
- Table 75: Global Security Labels Revenue undefined Forecast, by Type 2020 & 2033
- Table 76: Global Security Labels Volume K Forecast, by Type 2020 & 2033
- Table 77: Global Security Labels Revenue undefined Forecast, by Country 2020 & 2033
- Table 78: Global Security Labels Volume K Forecast, by Country 2020 & 2033
- Table 79: China Security Labels Revenue (undefined) Forecast, by Application 2020 & 2033
- Table 80: China Security Labels Volume (K) Forecast, by Application 2020 & 2033
- Table 81: India Security Labels Revenue (undefined) Forecast, by Application 2020 & 2033
- Table 82: India Security Labels Volume (K) Forecast, by Application 2020 & 2033
- Table 83: Japan Security Labels Revenue (undefined) Forecast, by Application 2020 & 2033
- Table 84: Japan Security Labels Volume (K) Forecast, by Application 2020 & 2033
- Table 85: South Korea Security Labels Revenue (undefined) Forecast, by Application 2020 & 2033
- Table 86: South Korea Security Labels Volume (K) Forecast, by Application 2020 & 2033
- Table 87: ASEAN Security Labels Revenue (undefined) Forecast, by Application 2020 & 2033
- Table 88: ASEAN Security Labels Volume (K) Forecast, by Application 2020 & 2033
- Table 89: Oceania Security Labels Revenue (undefined) Forecast, by Application 2020 & 2033
- Table 90: Oceania Security Labels Volume (K) Forecast, by Application 2020 & 2033
- Table 91: Rest of Asia Pacific Security Labels Revenue (undefined) Forecast, by Application 2020 & 2033
- Table 92: Rest of Asia Pacific Security Labels Volume (K) Forecast, by Application 2020 & 2033
Frequently Asked Questions
1. What is the projected Compound Annual Growth Rate (CAGR) of the Security Labels?
The projected CAGR is approximately 10.14%.
2. Which companies are prominent players in the Security Labels?
Key companies in the market include CCL Industries, Avery Dennison, UPM Raflatac, tesa SE, MCC Label, Honeywell, Mercian Labels, Brady, CILS international, Autajon Group, orfix International, Securikett, KURZ, Seiko Instruments, Groupdc.
3. What are the main segments of the Security Labels?
The market segments include Application, Type.
4. Can you provide details about the market size?
The market size is estimated to be USD XXX N/A as of 2022.
5. What are some drivers contributing to market growth?
N/A
6. What are the notable trends driving market growth?
N/A
7. Are there any restraints impacting market growth?
N/A
8. Can you provide examples of recent developments in the market?
N/A
9. What pricing options are available for accessing the report?
Pricing options include single-user, multi-user, and enterprise licenses priced at USD 3950.00, USD 5925.00, and USD 7900.00 respectively.
10. Is the market size provided in terms of value or volume?
The market size is provided in terms of value, measured in N/A and volume, measured in K.
11. Are there any specific market keywords associated with the report?
Yes, the market keyword associated with the report is "Security Labels," which aids in identifying and referencing the specific market segment covered.
12. How do I determine which pricing option suits my needs best?
The pricing options vary based on user requirements and access needs. Individual users may opt for single-user licenses, while businesses requiring broader access may choose multi-user or enterprise licenses for cost-effective access to the report.
13. Are there any additional resources or data provided in the Security Labels report?
While the report offers comprehensive insights, it's advisable to review the specific contents or supplementary materials provided to ascertain if additional resources or data are available.
14. How can I stay updated on further developments or reports in the Security Labels?
To stay informed about further developments, trends, and reports in the Security Labels, consider subscribing to industry newsletters, following relevant companies and organizations, or regularly checking reputable industry news sources and publications.
Methodology
Step 1 - Identification of Relevant Samples Size from Population Database


Step 2 - Approaches for Defining Global Market Size (Value, Volume* & Price*)

Note*: In applicable scenarios
Step 3 - Data Sources
Primary Research
- Web Analytics
- Survey Reports
- Research Institute
- Latest Research Reports
- Opinion Leaders
Secondary Research
- Annual Reports
- White Paper
- Latest Press Release
- Industry Association
- Paid Database
- Investor Presentations

Step 4 - Data Triangulation
Involves using different sources of information in order to increase the validity of a study
These sources are likely to be stakeholders in a program - participants, other researchers, program staff, other community members, and so on.
Then we put all data in single framework & apply various statistical tools to find out the dynamic on the market.
During the analysis stage, feedback from the stakeholder groups would be compared to determine areas of agreement as well as areas of divergence