

Key Insights
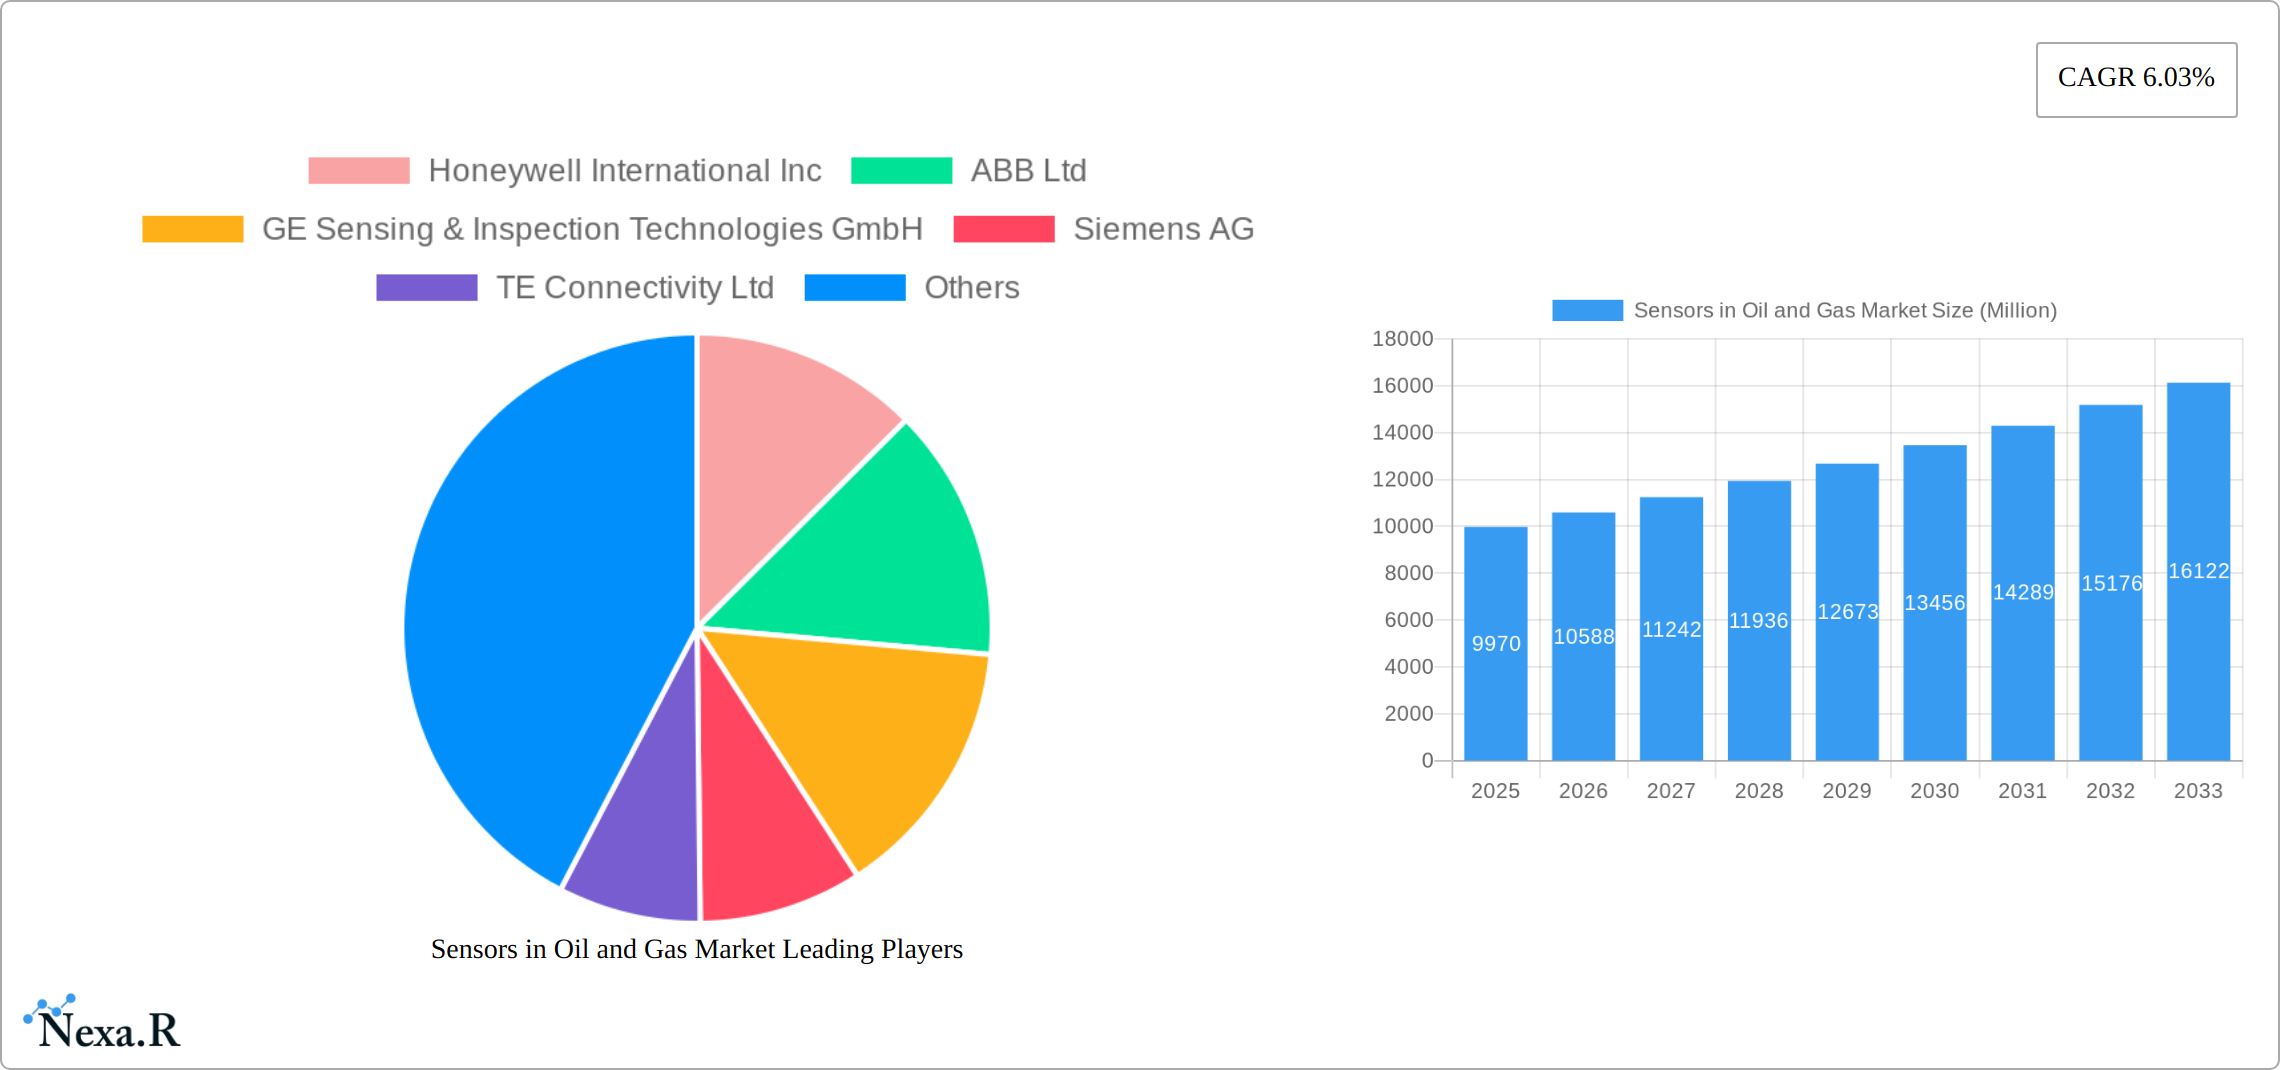
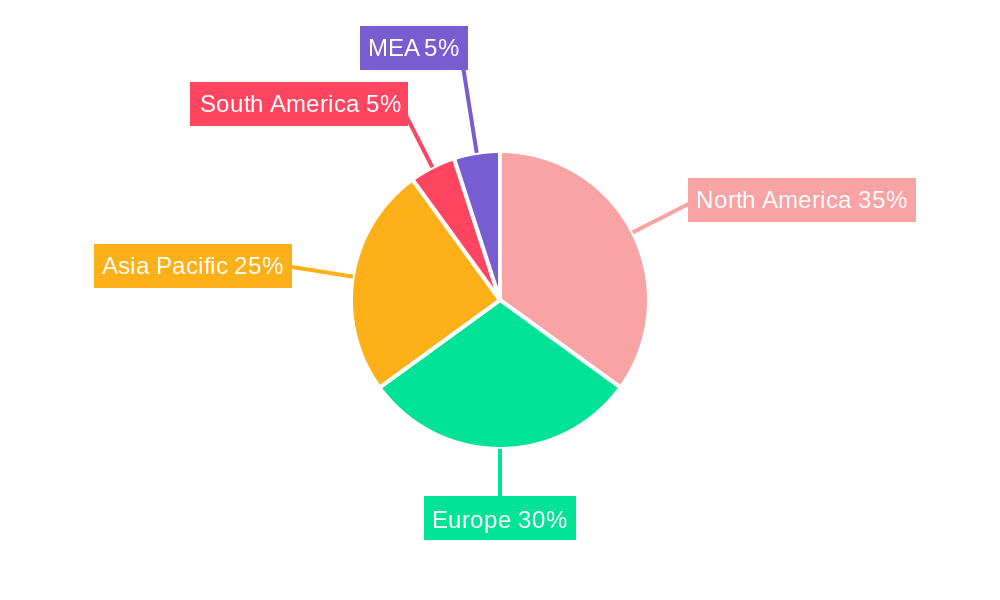
The global Sensors in Oil and Gas market, valued at $9.97 billion in 2025, is projected to experience robust growth, driven by increasing automation and digitalization within the oil and gas sector. The market's Compound Annual Growth Rate (CAGR) of 6.03% from 2025 to 2033 indicates a significant expansion. Key growth drivers include the rising demand for enhanced safety measures, improved operational efficiency through real-time monitoring, predictive maintenance capabilities, and the need for precise process control. The integration of advanced sensor technologies, such as those employing artificial intelligence and machine learning, further fuels market expansion. Wireless sensor networks are gaining prominence, facilitating remote monitoring and reducing infrastructure costs. Market segmentation reveals a strong demand across sensor types, with gas sensors, temperature sensors, and pressure sensors holding significant shares, driven by their crucial role in various oil and gas operations. Geographically, North America and Europe currently dominate the market, owing to established infrastructure and stringent safety regulations. However, the Asia-Pacific region is poised for rapid growth, driven by increasing oil and gas exploration and production activities in countries like China and India.
Despite promising growth prospects, the market faces certain challenges. Fluctuations in oil prices can impact investment in new technologies, and the high initial cost of implementing sensor networks might hinder adoption in smaller oil and gas companies. Furthermore, stringent safety and regulatory compliance requirements necessitate robust quality control measures, potentially impacting profitability for some market participants. However, the long-term benefits of enhanced safety, improved efficiency, and reduced environmental impact are expected to outweigh these challenges, leading to continued market expansion throughout the forecast period. The ongoing development of more sophisticated and cost-effective sensor technologies will further propel market growth and stimulate adoption across various upstream, midstream, and downstream operations.
Sensors in Oil and Gas Market: A Comprehensive Report (2019-2033)
This comprehensive report provides an in-depth analysis of the Sensors in Oil and Gas Market, encompassing market dynamics, growth trends, regional dominance, product landscape, key players, and future outlook. The study period spans from 2019 to 2033, with 2025 serving as the base and estimated year. The report delves into the parent market of Industrial Sensors and the child market of Oil and Gas Sensors, offering granular insights for informed decision-making. The market size is projected to reach xx Million units by 2033.
Sensors in Oil and Gas Market Market Dynamics & Structure
The Sensors in Oil and Gas Market is characterized by a moderately consolidated structure, with key players such as Honeywell International Inc, ABB Ltd, and Siemens AG holding significant market share. Technological innovation, driven by the need for enhanced efficiency, safety, and environmental compliance, is a major growth driver. Stringent regulatory frameworks concerning emissions and operational safety influence market dynamics. Competitive pressures from substitute technologies, such as AI-powered predictive maintenance systems, also exist. The end-user demographic primarily includes upstream, midstream, and downstream oil and gas operators.
- Market Concentration: Moderately consolidated, with the top 5 players holding an estimated 45% market share in 2025.
- Technological Innovation: Focus on miniaturization, improved accuracy, wireless connectivity, and integration with IoT platforms.
- Regulatory Landscape: Stricter emission regulations and safety standards are driving demand for advanced sensors.
- Competitive Substitutes: AI-based predictive maintenance and other digital solutions present competitive challenges.
- M&A Activity: An estimated xx M&A deals in the oil and gas sensor market occurred between 2019 and 2024, driven by consolidation and technological acquisitions. This activity is expected to continue at a rate of xx deals annually through 2033.
- Innovation Barriers: High initial investment costs and integration complexities hinder wider adoption of advanced sensor technologies.
Sensors in Oil and Gas Market Growth Trends & Insights
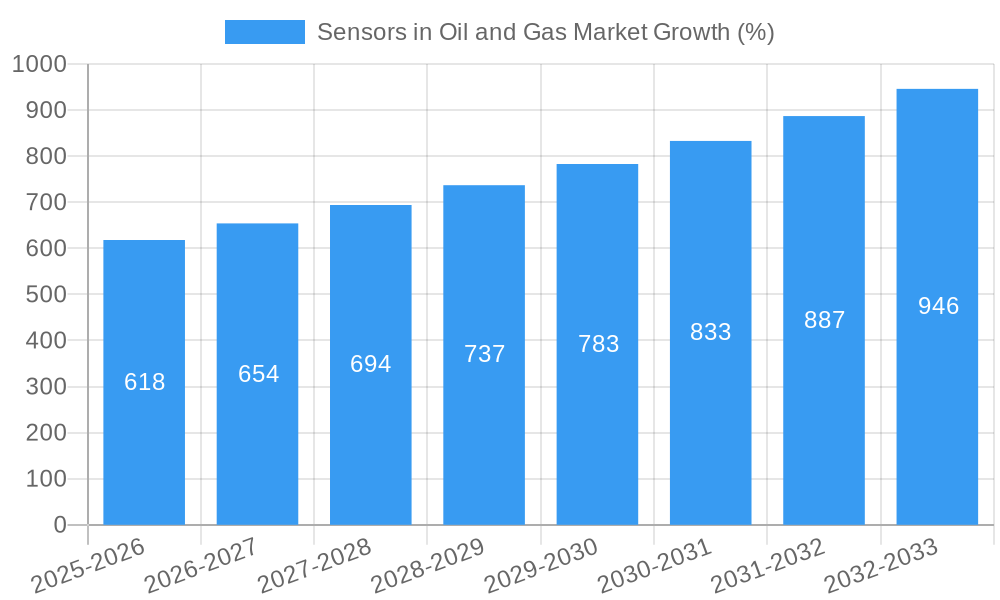
The Sensors in Oil and Gas Market has experienced consistent growth over the historical period (2019-2024), fueled by increasing exploration and production activities, coupled with rising demand for enhanced operational efficiency and safety. The market is projected to grow at a CAGR of xx% during the forecast period (2025-2033), reaching xx Million units by 2033. Technological disruptions, such as the integration of AI and machine learning in sensor data analysis, are significantly impacting adoption rates. A growing emphasis on reducing environmental impact is driving demand for sensors that monitor methane emissions and other pollutants. This shift reflects a change in consumer behavior, moving towards sustainability practices within the industry. Market penetration of advanced sensor technologies (such as wireless and IoT-enabled sensors) is expected to increase from xx% in 2025 to xx% by 2033.
Dominant Regions, Countries, or Segments in Sensors in Oil and Gas Market
North America and the Middle East currently hold the largest market share in the Sensors in Oil and Gas Market, driven by extensive oil and gas operations and investments in advanced technologies. Within sensor types, Pressure Sensors and Temperature Sensors dominate, followed closely by Gas Sensors and Flow Sensors. The Upstream segment (exploration and production) demonstrates the highest growth potential, driven by increasing exploration activities in emerging markets. Wireless connectivity solutions are experiencing faster growth rates compared to wired solutions, owing to their flexibility and ease of installation in remote locations.
- Key Drivers (North America): Robust oil and gas production, investments in technological upgrades, and stringent environmental regulations.
- Key Drivers (Middle East): Significant oil and gas reserves, substantial investments in infrastructure development, and government initiatives promoting technological advancements.
- By Sensor Type: Pressure sensors (xx Million units in 2025), Temperature Sensors (xx Million units in 2025), Gas Sensors (xx Million units in 2025) are the dominant segments.
- By Connectivity: Wireless connectivity is gaining traction due to its ease of deployment and cost-effectiveness.
- By Activity: The Upstream segment exhibits the highest growth rate, driven by the need for enhanced efficiency in exploration and production activities.
Sensors in Oil and Gas Market Product Landscape
The Sensors in Oil and Gas Market is experiencing a dynamic evolution driven by relentless product innovation. A primary focus is on developing sensors with enhanced accuracy, superior durability in harsh operational environments, and seamless connectivity. The market is increasingly embracing smart sensors that incorporate embedded analytics and predictive maintenance capabilities, allowing for proactive issue identification and operational optimization. Miniaturization is another significant trend, enabling the integration of advanced sensing technologies into increasingly confined spaces across the oil and gas value chain. These advancements collectively empower more robust data collection and real-time monitoring, leading to substantial improvements in operational efficiency, enhanced safety protocols, and reduced environmental impact. Key unique selling propositions for these advanced sensors include unparalleled accuracy in measurement, significantly reduced maintenance requirements, and effortless data integration with existing industrial control systems and digital platforms.
Key Drivers, Barriers & Challenges in Sensors in Oil and Gas Market
Key Drivers:
- Increased demand for efficient and safe oil and gas operations.
- Stringent environmental regulations promoting emissions monitoring.
- Advancements in sensor technology, including IoT integration and AI-powered analytics.
- Growing investments in digitalization across the oil and gas industry.
Key Challenges and Restraints:
- High initial investment costs associated with advanced sensor technologies.
- Integration complexities and cybersecurity concerns related to IoT-enabled systems.
- Fluctuations in oil and gas prices impacting investment decisions.
- Supply chain disruptions potentially affecting sensor availability.
Emerging Opportunities in Sensors in Oil and Gas Market
- Expanding applications in deepwater and subsea exploration and production, demanding highly resilient and specialized sensing technologies.
- Seamless integration of advanced sensors with autonomous systems, robotics, and AI-driven platforms for enhanced operational automation and remote management.
- Significant growth in demand for highly specialized sensors in unconventional oil and gas extraction methods, such as shale gas and oil sands operations.
- The critical development and deployment of sophisticated sensors for continuous pipeline integrity monitoring, early leak detection, and proactive prevention of costly and environmentally damaging incidents.
- Increased adoption of fiber optic sensors for distributed sensing applications, offering comprehensive environmental and structural monitoring.
- Focus on developing sensors capable of real-time analysis of fluid composition and quality for improved process control and product optimization.
Growth Accelerators in the Sensors in Oil and Gas Market Industry
The sustained and robust long-term growth of the Sensors in Oil and Gas Market is primarily propelled by continuous technological breakthroughs. These include significant advancements in AI-powered analytics for interpreting complex sensor data, further developments in sensor miniaturization for more versatile deployment, and the creation of more robust and efficient enhanced connectivity solutions, including IoT and 5G integration. Strategic collaborations and partnerships between leading sensor manufacturers and major oil and gas operators are proving instrumental in accelerating the adoption of these cutting-edge technologies. Furthermore, the expansion into previously untapped markets, particularly in rapidly developing economies with growing energy demands, presents substantial and lucrative growth opportunities for sensor providers.
Key Players Shaping the Sensors in Oil and Gas Market Market
- Honeywell International Inc
- ABB Ltd
- GE Sensing & Inspection Technologies GmbH
- Siemens AG
- TE Connectivity Ltd
- Robert Bosch GmbH
- Rockwell Automation Inc
- Analog Devices Inc
- SKF
- Emerson Electric Company
- Yokogawa Electric Corporation
- Schneider Electric
Notable Milestones in Sensors in Oil and Gas Market Sector
- October 2022: Svanehj Tank Control Systems secured a significant order for advanced tank gauging systems from COOEC for the Longkou Nanshan LNG Terminal in China. This underscores the escalating demand for highly accurate level and temperature sensors crucial for the safe and efficient operation of critical LNG infrastructure.
- October 2022: ADNOC's commitment to achieving the Gold Standard in OGMP 2.0 (Oil and Gas Methane Partnership 2.0) strongly highlights the industry's intensified focus on stringent methane emission monitoring. This strategic imperative is expected to drive increased adoption of advanced sensing solutions, including drone-mounted and satellite-based sensors for comprehensive environmental surveillance and regulatory compliance.
- November 2022: The introduction of new flame and gas detection sensors by a leading player promises enhanced safety measures in hazardous offshore and onshore environments, demonstrating innovation in critical safety sensing.
- January 2023: A major oilfield service company announced the integration of AI-powered acoustic sensors for real-time wellbore diagnostics, marking a significant step towards predictive maintenance and optimized production in the upstream sector.
In-Depth Sensors in Oil and Gas Market Market Outlook
The Sensors in Oil and Gas Market is poised for continued robust growth, driven by ongoing digitalization efforts within the oil and gas industry, increasing demand for enhanced safety and efficiency, and stricter environmental regulations. Strategic partnerships, technological innovations, and expansion into new applications will further propel market expansion. The focus on sustainable practices and reduction of environmental impact offers significant opportunities for companies developing advanced sensors for methane detection and emission monitoring. The market's future success hinges on continuous innovation, addressing cybersecurity concerns, and effectively managing the complexities of integrating advanced sensor technologies into existing infrastructure.
Sensors in Oil and Gas Market Segmentation
-
1. Sensor Type
- 1.1. Gas Sensor
- 1.2. Temperature Sensor
- 1.3. Ultrasonic Sensor
- 1.4. Pressure Sensor
- 1.5. Flow Sensor
- 1.6. Level Sensor
- 1.7. Other Sensor Types
-
2. Connectivity
- 2.1. Wired
- 2.2. Wireless
-
3. Activity
- 3.1. Upstream
- 3.2. Midstream
- 3.3. Downstream
Sensors in Oil and Gas Market Segmentation By Geography
-
1. North America
- 1.1. United States
- 1.2. Canada
-
2. Europe
- 2.1. United Kingdom
- 2.2. Germany
- 2.3. Rest of Europe
-
3. Asia Pacific
- 3.1. China
- 3.2. India
- 3.3. Indonesia
- 3.4. Rest of Asia Pacific
-
4. Latin America
- 4.1. Mexico
- 4.2. Brazil
- 4.3. Argentina
- 4.4. Rest of Latin America
-
5. Middle East and Africa
- 5.1. United Arab Emirates
- 5.2. Saudi Arabia
- 5.3. South Africa
- 5.4. Rest of Middle East and Africa
Sensors in Oil and Gas Market REPORT HIGHLIGHTS
| Aspects | Details |
|---|---|
| Study Period | 2019-2033 |
| Base Year | 2024 |
| Estimated Year | 2025 |
| Forecast Period | 2025-2033 |
| Historical Period | 2019-2024 |
| Growth Rate | CAGR of 6.03% from 2019-2033 |
| Segmentation |
|
Table of Contents
- 1. Introduction
- 1.1. Research Scope
- 1.2. Market Segmentation
- 1.3. Research Methodology
- 1.4. Definitions and Assumptions
- 2. Executive Summary
- 2.1. Introduction
- 3. Market Dynamics
- 3.1. Introduction
- 3.2. Market Drivers
- 3.2.1. Rising Demand for Safety Systems in the Oil and Gas Industry; Increasing Need for a Simplified Network Architecture in the Wireless Sensor Segment
- 3.3. Market Restrains
- 3.3.1. Rigid Regulations Imposed on Oil and Gas Drilling Activities
- 3.4. Market Trends
- 3.4.1. Upstream Industries Offer Potential Growth
- 4. Market Factor Analysis
- 4.1. Porters Five Forces
- 4.2. Supply/Value Chain
- 4.3. PESTEL analysis
- 4.4. Market Entropy
- 4.5. Patent/Trademark Analysis
- 5. Global Sensors in Oil and Gas Market Analysis, Insights and Forecast, 2019-2031
- 5.1. Market Analysis, Insights and Forecast - by Sensor Type
- 5.1.1. Gas Sensor
- 5.1.2. Temperature Sensor
- 5.1.3. Ultrasonic Sensor
- 5.1.4. Pressure Sensor
- 5.1.5. Flow Sensor
- 5.1.6. Level Sensor
- 5.1.7. Other Sensor Types
- 5.2. Market Analysis, Insights and Forecast - by Connectivity
- 5.2.1. Wired
- 5.2.2. Wireless
- 5.3. Market Analysis, Insights and Forecast - by Activity
- 5.3.1. Upstream
- 5.3.2. Midstream
- 5.3.3. Downstream
- 5.4. Market Analysis, Insights and Forecast - by Region
- 5.4.1. North America
- 5.4.2. Europe
- 5.4.3. Asia Pacific
- 5.4.4. Latin America
- 5.4.5. Middle East and Africa
- 5.1. Market Analysis, Insights and Forecast - by Sensor Type
- 6. North America Sensors in Oil and Gas Market Analysis, Insights and Forecast, 2019-2031
- 6.1. Market Analysis, Insights and Forecast - by Sensor Type
- 6.1.1. Gas Sensor
- 6.1.2. Temperature Sensor
- 6.1.3. Ultrasonic Sensor
- 6.1.4. Pressure Sensor
- 6.1.5. Flow Sensor
- 6.1.6. Level Sensor
- 6.1.7. Other Sensor Types
- 6.2. Market Analysis, Insights and Forecast - by Connectivity
- 6.2.1. Wired
- 6.2.2. Wireless
- 6.3. Market Analysis, Insights and Forecast - by Activity
- 6.3.1. Upstream
- 6.3.2. Midstream
- 6.3.3. Downstream
- 6.1. Market Analysis, Insights and Forecast - by Sensor Type
- 7. Europe Sensors in Oil and Gas Market Analysis, Insights and Forecast, 2019-2031
- 7.1. Market Analysis, Insights and Forecast - by Sensor Type
- 7.1.1. Gas Sensor
- 7.1.2. Temperature Sensor
- 7.1.3. Ultrasonic Sensor
- 7.1.4. Pressure Sensor
- 7.1.5. Flow Sensor
- 7.1.6. Level Sensor
- 7.1.7. Other Sensor Types
- 7.2. Market Analysis, Insights and Forecast - by Connectivity
- 7.2.1. Wired
- 7.2.2. Wireless
- 7.3. Market Analysis, Insights and Forecast - by Activity
- 7.3.1. Upstream
- 7.3.2. Midstream
- 7.3.3. Downstream
- 7.1. Market Analysis, Insights and Forecast - by Sensor Type
- 8. Asia Pacific Sensors in Oil and Gas Market Analysis, Insights and Forecast, 2019-2031
- 8.1. Market Analysis, Insights and Forecast - by Sensor Type
- 8.1.1. Gas Sensor
- 8.1.2. Temperature Sensor
- 8.1.3. Ultrasonic Sensor
- 8.1.4. Pressure Sensor
- 8.1.5. Flow Sensor
- 8.1.6. Level Sensor
- 8.1.7. Other Sensor Types
- 8.2. Market Analysis, Insights and Forecast - by Connectivity
- 8.2.1. Wired
- 8.2.2. Wireless
- 8.3. Market Analysis, Insights and Forecast - by Activity
- 8.3.1. Upstream
- 8.3.2. Midstream
- 8.3.3. Downstream
- 8.1. Market Analysis, Insights and Forecast - by Sensor Type
- 9. Latin America Sensors in Oil and Gas Market Analysis, Insights and Forecast, 2019-2031
- 9.1. Market Analysis, Insights and Forecast - by Sensor Type
- 9.1.1. Gas Sensor
- 9.1.2. Temperature Sensor
- 9.1.3. Ultrasonic Sensor
- 9.1.4. Pressure Sensor
- 9.1.5. Flow Sensor
- 9.1.6. Level Sensor
- 9.1.7. Other Sensor Types
- 9.2. Market Analysis, Insights and Forecast - by Connectivity
- 9.2.1. Wired
- 9.2.2. Wireless
- 9.3. Market Analysis, Insights and Forecast - by Activity
- 9.3.1. Upstream
- 9.3.2. Midstream
- 9.3.3. Downstream
- 9.1. Market Analysis, Insights and Forecast - by Sensor Type
- 10. Middle East and Africa Sensors in Oil and Gas Market Analysis, Insights and Forecast, 2019-2031
- 10.1. Market Analysis, Insights and Forecast - by Sensor Type
- 10.1.1. Gas Sensor
- 10.1.2. Temperature Sensor
- 10.1.3. Ultrasonic Sensor
- 10.1.4. Pressure Sensor
- 10.1.5. Flow Sensor
- 10.1.6. Level Sensor
- 10.1.7. Other Sensor Types
- 10.2. Market Analysis, Insights and Forecast - by Connectivity
- 10.2.1. Wired
- 10.2.2. Wireless
- 10.3. Market Analysis, Insights and Forecast - by Activity
- 10.3.1. Upstream
- 10.3.2. Midstream
- 10.3.3. Downstream
- 10.1. Market Analysis, Insights and Forecast - by Sensor Type
- 11. North America Sensors in Oil and Gas Market Analysis, Insights and Forecast, 2019-2031
- 11.1. Market Analysis, Insights and Forecast - By Country/Sub-region
- 11.1.1 United States
- 11.1.2 Canada
- 11.1.3 Mexico
- 12. Europe Sensors in Oil and Gas Market Analysis, Insights and Forecast, 2019-2031
- 12.1. Market Analysis, Insights and Forecast - By Country/Sub-region
- 12.1.1 Germany
- 12.1.2 United Kingdom
- 12.1.3 France
- 12.1.4 Spain
- 12.1.5 Italy
- 12.1.6 Spain
- 12.1.7 Belgium
- 12.1.8 Netherland
- 12.1.9 Nordics
- 12.1.10 Rest of Europe
- 13. Asia Pacific Sensors in Oil and Gas Market Analysis, Insights and Forecast, 2019-2031
- 13.1. Market Analysis, Insights and Forecast - By Country/Sub-region
- 13.1.1 China
- 13.1.2 Japan
- 13.1.3 India
- 13.1.4 South Korea
- 13.1.5 Southeast Asia
- 13.1.6 Australia
- 13.1.7 Indonesia
- 13.1.8 Phillipes
- 13.1.9 Singapore
- 13.1.10 Thailandc
- 13.1.11 Rest of Asia Pacific
- 14. South America Sensors in Oil and Gas Market Analysis, Insights and Forecast, 2019-2031
- 14.1. Market Analysis, Insights and Forecast - By Country/Sub-region
- 14.1.1 Brazil
- 14.1.2 Argentina
- 14.1.3 Peru
- 14.1.4 Chile
- 14.1.5 Colombia
- 14.1.6 Ecuador
- 14.1.7 Venezuela
- 14.1.8 Rest of South America
- 15. North America Sensors in Oil and Gas Market Analysis, Insights and Forecast, 2019-2031
- 15.1. Market Analysis, Insights and Forecast - By Country/Sub-region
- 15.1.1 United States
- 15.1.2 Canada
- 15.1.3 Mexico
- 16. MEA Sensors in Oil and Gas Market Analysis, Insights and Forecast, 2019-2031
- 16.1. Market Analysis, Insights and Forecast - By Country/Sub-region
- 16.1.1 United Arab Emirates
- 16.1.2 Saudi Arabia
- 16.1.3 South Africa
- 16.1.4 Rest of Middle East and Africa
- 17. Competitive Analysis
- 17.1. Global Market Share Analysis 2024
- 17.2. Company Profiles
- 17.2.1 Honeywell International Inc
- 17.2.1.1. Overview
- 17.2.1.2. Products
- 17.2.1.3. SWOT Analysis
- 17.2.1.4. Recent Developments
- 17.2.1.5. Financials (Based on Availability)
- 17.2.2 ABB Ltd
- 17.2.2.1. Overview
- 17.2.2.2. Products
- 17.2.2.3. SWOT Analysis
- 17.2.2.4. Recent Developments
- 17.2.2.5. Financials (Based on Availability)
- 17.2.3 GE Sensing & Inspection Technologies GmbH
- 17.2.3.1. Overview
- 17.2.3.2. Products
- 17.2.3.3. SWOT Analysis
- 17.2.3.4. Recent Developments
- 17.2.3.5. Financials (Based on Availability)
- 17.2.4 Siemens AG
- 17.2.4.1. Overview
- 17.2.4.2. Products
- 17.2.4.3. SWOT Analysis
- 17.2.4.4. Recent Developments
- 17.2.4.5. Financials (Based on Availability)
- 17.2.5 TE Connectivity Ltd
- 17.2.5.1. Overview
- 17.2.5.2. Products
- 17.2.5.3. SWOT Analysis
- 17.2.5.4. Recent Developments
- 17.2.5.5. Financials (Based on Availability)
- 17.2.6 Robert Bosch GmbH
- 17.2.6.1. Overview
- 17.2.6.2. Products
- 17.2.6.3. SWOT Analysis
- 17.2.6.4. Recent Developments
- 17.2.6.5. Financials (Based on Availability)
- 17.2.7 Rockwell Automation Inc
- 17.2.7.1. Overview
- 17.2.7.2. Products
- 17.2.7.3. SWOT Analysis
- 17.2.7.4. Recent Developments
- 17.2.7.5. Financials (Based on Availability)
- 17.2.8 Analog Devices Inc
- 17.2.8.1. Overview
- 17.2.8.2. Products
- 17.2.8.3. SWOT Analysis
- 17.2.8.4. Recent Developments
- 17.2.8.5. Financials (Based on Availability)
- 17.2.9 SKF A
- 17.2.9.1. Overview
- 17.2.9.2. Products
- 17.2.9.3. SWOT Analysis
- 17.2.9.4. Recent Developments
- 17.2.9.5. Financials (Based on Availability)
- 17.2.10 Emerson Electric Company
- 17.2.10.1. Overview
- 17.2.10.2. Products
- 17.2.10.3. SWOT Analysis
- 17.2.10.4. Recent Developments
- 17.2.10.5. Financials (Based on Availability)
- 17.2.1 Honeywell International Inc
List of Figures
- Figure 1: Global Sensors in Oil and Gas Market Revenue Breakdown (Million, %) by Region 2024 & 2032
- Figure 2: North America Sensors in Oil and Gas Market Revenue (Million), by Country 2024 & 2032
- Figure 3: North America Sensors in Oil and Gas Market Revenue Share (%), by Country 2024 & 2032
- Figure 4: Europe Sensors in Oil and Gas Market Revenue (Million), by Country 2024 & 2032
- Figure 5: Europe Sensors in Oil and Gas Market Revenue Share (%), by Country 2024 & 2032
- Figure 6: Asia Pacific Sensors in Oil and Gas Market Revenue (Million), by Country 2024 & 2032
- Figure 7: Asia Pacific Sensors in Oil and Gas Market Revenue Share (%), by Country 2024 & 2032
- Figure 8: South America Sensors in Oil and Gas Market Revenue (Million), by Country 2024 & 2032
- Figure 9: South America Sensors in Oil and Gas Market Revenue Share (%), by Country 2024 & 2032
- Figure 10: North America Sensors in Oil and Gas Market Revenue (Million), by Country 2024 & 2032
- Figure 11: North America Sensors in Oil and Gas Market Revenue Share (%), by Country 2024 & 2032
- Figure 12: MEA Sensors in Oil and Gas Market Revenue (Million), by Country 2024 & 2032
- Figure 13: MEA Sensors in Oil and Gas Market Revenue Share (%), by Country 2024 & 2032
- Figure 14: North America Sensors in Oil and Gas Market Revenue (Million), by Sensor Type 2024 & 2032
- Figure 15: North America Sensors in Oil and Gas Market Revenue Share (%), by Sensor Type 2024 & 2032
- Figure 16: North America Sensors in Oil and Gas Market Revenue (Million), by Connectivity 2024 & 2032
- Figure 17: North America Sensors in Oil and Gas Market Revenue Share (%), by Connectivity 2024 & 2032
- Figure 18: North America Sensors in Oil and Gas Market Revenue (Million), by Activity 2024 & 2032
- Figure 19: North America Sensors in Oil and Gas Market Revenue Share (%), by Activity 2024 & 2032
- Figure 20: North America Sensors in Oil and Gas Market Revenue (Million), by Country 2024 & 2032
- Figure 21: North America Sensors in Oil and Gas Market Revenue Share (%), by Country 2024 & 2032
- Figure 22: Europe Sensors in Oil and Gas Market Revenue (Million), by Sensor Type 2024 & 2032
- Figure 23: Europe Sensors in Oil and Gas Market Revenue Share (%), by Sensor Type 2024 & 2032
- Figure 24: Europe Sensors in Oil and Gas Market Revenue (Million), by Connectivity 2024 & 2032
- Figure 25: Europe Sensors in Oil and Gas Market Revenue Share (%), by Connectivity 2024 & 2032
- Figure 26: Europe Sensors in Oil and Gas Market Revenue (Million), by Activity 2024 & 2032
- Figure 27: Europe Sensors in Oil and Gas Market Revenue Share (%), by Activity 2024 & 2032
- Figure 28: Europe Sensors in Oil and Gas Market Revenue (Million), by Country 2024 & 2032
- Figure 29: Europe Sensors in Oil and Gas Market Revenue Share (%), by Country 2024 & 2032
- Figure 30: Asia Pacific Sensors in Oil and Gas Market Revenue (Million), by Sensor Type 2024 & 2032
- Figure 31: Asia Pacific Sensors in Oil and Gas Market Revenue Share (%), by Sensor Type 2024 & 2032
- Figure 32: Asia Pacific Sensors in Oil and Gas Market Revenue (Million), by Connectivity 2024 & 2032
- Figure 33: Asia Pacific Sensors in Oil and Gas Market Revenue Share (%), by Connectivity 2024 & 2032
- Figure 34: Asia Pacific Sensors in Oil and Gas Market Revenue (Million), by Activity 2024 & 2032
- Figure 35: Asia Pacific Sensors in Oil and Gas Market Revenue Share (%), by Activity 2024 & 2032
- Figure 36: Asia Pacific Sensors in Oil and Gas Market Revenue (Million), by Country 2024 & 2032
- Figure 37: Asia Pacific Sensors in Oil and Gas Market Revenue Share (%), by Country 2024 & 2032
- Figure 38: Latin America Sensors in Oil and Gas Market Revenue (Million), by Sensor Type 2024 & 2032
- Figure 39: Latin America Sensors in Oil and Gas Market Revenue Share (%), by Sensor Type 2024 & 2032
- Figure 40: Latin America Sensors in Oil and Gas Market Revenue (Million), by Connectivity 2024 & 2032
- Figure 41: Latin America Sensors in Oil and Gas Market Revenue Share (%), by Connectivity 2024 & 2032
- Figure 42: Latin America Sensors in Oil and Gas Market Revenue (Million), by Activity 2024 & 2032
- Figure 43: Latin America Sensors in Oil and Gas Market Revenue Share (%), by Activity 2024 & 2032
- Figure 44: Latin America Sensors in Oil and Gas Market Revenue (Million), by Country 2024 & 2032
- Figure 45: Latin America Sensors in Oil and Gas Market Revenue Share (%), by Country 2024 & 2032
- Figure 46: Middle East and Africa Sensors in Oil and Gas Market Revenue (Million), by Sensor Type 2024 & 2032
- Figure 47: Middle East and Africa Sensors in Oil and Gas Market Revenue Share (%), by Sensor Type 2024 & 2032
- Figure 48: Middle East and Africa Sensors in Oil and Gas Market Revenue (Million), by Connectivity 2024 & 2032
- Figure 49: Middle East and Africa Sensors in Oil and Gas Market Revenue Share (%), by Connectivity 2024 & 2032
- Figure 50: Middle East and Africa Sensors in Oil and Gas Market Revenue (Million), by Activity 2024 & 2032
- Figure 51: Middle East and Africa Sensors in Oil and Gas Market Revenue Share (%), by Activity 2024 & 2032
- Figure 52: Middle East and Africa Sensors in Oil and Gas Market Revenue (Million), by Country 2024 & 2032
- Figure 53: Middle East and Africa Sensors in Oil and Gas Market Revenue Share (%), by Country 2024 & 2032
List of Tables
- Table 1: Global Sensors in Oil and Gas Market Revenue Million Forecast, by Region 2019 & 2032
- Table 2: Global Sensors in Oil and Gas Market Revenue Million Forecast, by Sensor Type 2019 & 2032
- Table 3: Global Sensors in Oil and Gas Market Revenue Million Forecast, by Connectivity 2019 & 2032
- Table 4: Global Sensors in Oil and Gas Market Revenue Million Forecast, by Activity 2019 & 2032
- Table 5: Global Sensors in Oil and Gas Market Revenue Million Forecast, by Region 2019 & 2032
- Table 6: Global Sensors in Oil and Gas Market Revenue Million Forecast, by Country 2019 & 2032
- Table 7: United States Sensors in Oil and Gas Market Revenue (Million) Forecast, by Application 2019 & 2032
- Table 8: Canada Sensors in Oil and Gas Market Revenue (Million) Forecast, by Application 2019 & 2032
- Table 9: Mexico Sensors in Oil and Gas Market Revenue (Million) Forecast, by Application 2019 & 2032
- Table 10: Global Sensors in Oil and Gas Market Revenue Million Forecast, by Country 2019 & 2032
- Table 11: Germany Sensors in Oil and Gas Market Revenue (Million) Forecast, by Application 2019 & 2032
- Table 12: United Kingdom Sensors in Oil and Gas Market Revenue (Million) Forecast, by Application 2019 & 2032
- Table 13: France Sensors in Oil and Gas Market Revenue (Million) Forecast, by Application 2019 & 2032
- Table 14: Spain Sensors in Oil and Gas Market Revenue (Million) Forecast, by Application 2019 & 2032
- Table 15: Italy Sensors in Oil and Gas Market Revenue (Million) Forecast, by Application 2019 & 2032
- Table 16: Spain Sensors in Oil and Gas Market Revenue (Million) Forecast, by Application 2019 & 2032
- Table 17: Belgium Sensors in Oil and Gas Market Revenue (Million) Forecast, by Application 2019 & 2032
- Table 18: Netherland Sensors in Oil and Gas Market Revenue (Million) Forecast, by Application 2019 & 2032
- Table 19: Nordics Sensors in Oil and Gas Market Revenue (Million) Forecast, by Application 2019 & 2032
- Table 20: Rest of Europe Sensors in Oil and Gas Market Revenue (Million) Forecast, by Application 2019 & 2032
- Table 21: Global Sensors in Oil and Gas Market Revenue Million Forecast, by Country 2019 & 2032
- Table 22: China Sensors in Oil and Gas Market Revenue (Million) Forecast, by Application 2019 & 2032
- Table 23: Japan Sensors in Oil and Gas Market Revenue (Million) Forecast, by Application 2019 & 2032
- Table 24: India Sensors in Oil and Gas Market Revenue (Million) Forecast, by Application 2019 & 2032
- Table 25: South Korea Sensors in Oil and Gas Market Revenue (Million) Forecast, by Application 2019 & 2032
- Table 26: Southeast Asia Sensors in Oil and Gas Market Revenue (Million) Forecast, by Application 2019 & 2032
- Table 27: Australia Sensors in Oil and Gas Market Revenue (Million) Forecast, by Application 2019 & 2032
- Table 28: Indonesia Sensors in Oil and Gas Market Revenue (Million) Forecast, by Application 2019 & 2032
- Table 29: Phillipes Sensors in Oil and Gas Market Revenue (Million) Forecast, by Application 2019 & 2032
- Table 30: Singapore Sensors in Oil and Gas Market Revenue (Million) Forecast, by Application 2019 & 2032
- Table 31: Thailandc Sensors in Oil and Gas Market Revenue (Million) Forecast, by Application 2019 & 2032
- Table 32: Rest of Asia Pacific Sensors in Oil and Gas Market Revenue (Million) Forecast, by Application 2019 & 2032
- Table 33: Global Sensors in Oil and Gas Market Revenue Million Forecast, by Country 2019 & 2032
- Table 34: Brazil Sensors in Oil and Gas Market Revenue (Million) Forecast, by Application 2019 & 2032
- Table 35: Argentina Sensors in Oil and Gas Market Revenue (Million) Forecast, by Application 2019 & 2032
- Table 36: Peru Sensors in Oil and Gas Market Revenue (Million) Forecast, by Application 2019 & 2032
- Table 37: Chile Sensors in Oil and Gas Market Revenue (Million) Forecast, by Application 2019 & 2032
- Table 38: Colombia Sensors in Oil and Gas Market Revenue (Million) Forecast, by Application 2019 & 2032
- Table 39: Ecuador Sensors in Oil and Gas Market Revenue (Million) Forecast, by Application 2019 & 2032
- Table 40: Venezuela Sensors in Oil and Gas Market Revenue (Million) Forecast, by Application 2019 & 2032
- Table 41: Rest of South America Sensors in Oil and Gas Market Revenue (Million) Forecast, by Application 2019 & 2032
- Table 42: Global Sensors in Oil and Gas Market Revenue Million Forecast, by Country 2019 & 2032
- Table 43: United States Sensors in Oil and Gas Market Revenue (Million) Forecast, by Application 2019 & 2032
- Table 44: Canada Sensors in Oil and Gas Market Revenue (Million) Forecast, by Application 2019 & 2032
- Table 45: Mexico Sensors in Oil and Gas Market Revenue (Million) Forecast, by Application 2019 & 2032
- Table 46: Global Sensors in Oil and Gas Market Revenue Million Forecast, by Country 2019 & 2032
- Table 47: United Arab Emirates Sensors in Oil and Gas Market Revenue (Million) Forecast, by Application 2019 & 2032
- Table 48: Saudi Arabia Sensors in Oil and Gas Market Revenue (Million) Forecast, by Application 2019 & 2032
- Table 49: South Africa Sensors in Oil and Gas Market Revenue (Million) Forecast, by Application 2019 & 2032
- Table 50: Rest of Middle East and Africa Sensors in Oil and Gas Market Revenue (Million) Forecast, by Application 2019 & 2032
- Table 51: Global Sensors in Oil and Gas Market Revenue Million Forecast, by Sensor Type 2019 & 2032
- Table 52: Global Sensors in Oil and Gas Market Revenue Million Forecast, by Connectivity 2019 & 2032
- Table 53: Global Sensors in Oil and Gas Market Revenue Million Forecast, by Activity 2019 & 2032
- Table 54: Global Sensors in Oil and Gas Market Revenue Million Forecast, by Country 2019 & 2032
- Table 55: United States Sensors in Oil and Gas Market Revenue (Million) Forecast, by Application 2019 & 2032
- Table 56: Canada Sensors in Oil and Gas Market Revenue (Million) Forecast, by Application 2019 & 2032
- Table 57: Global Sensors in Oil and Gas Market Revenue Million Forecast, by Sensor Type 2019 & 2032
- Table 58: Global Sensors in Oil and Gas Market Revenue Million Forecast, by Connectivity 2019 & 2032
- Table 59: Global Sensors in Oil and Gas Market Revenue Million Forecast, by Activity 2019 & 2032
- Table 60: Global Sensors in Oil and Gas Market Revenue Million Forecast, by Country 2019 & 2032
- Table 61: United Kingdom Sensors in Oil and Gas Market Revenue (Million) Forecast, by Application 2019 & 2032
- Table 62: Germany Sensors in Oil and Gas Market Revenue (Million) Forecast, by Application 2019 & 2032
- Table 63: Rest of Europe Sensors in Oil and Gas Market Revenue (Million) Forecast, by Application 2019 & 2032
- Table 64: Global Sensors in Oil and Gas Market Revenue Million Forecast, by Sensor Type 2019 & 2032
- Table 65: Global Sensors in Oil and Gas Market Revenue Million Forecast, by Connectivity 2019 & 2032
- Table 66: Global Sensors in Oil and Gas Market Revenue Million Forecast, by Activity 2019 & 2032
- Table 67: Global Sensors in Oil and Gas Market Revenue Million Forecast, by Country 2019 & 2032
- Table 68: China Sensors in Oil and Gas Market Revenue (Million) Forecast, by Application 2019 & 2032
- Table 69: India Sensors in Oil and Gas Market Revenue (Million) Forecast, by Application 2019 & 2032
- Table 70: Indonesia Sensors in Oil and Gas Market Revenue (Million) Forecast, by Application 2019 & 2032
- Table 71: Rest of Asia Pacific Sensors in Oil and Gas Market Revenue (Million) Forecast, by Application 2019 & 2032
- Table 72: Global Sensors in Oil and Gas Market Revenue Million Forecast, by Sensor Type 2019 & 2032
- Table 73: Global Sensors in Oil and Gas Market Revenue Million Forecast, by Connectivity 2019 & 2032
- Table 74: Global Sensors in Oil and Gas Market Revenue Million Forecast, by Activity 2019 & 2032
- Table 75: Global Sensors in Oil and Gas Market Revenue Million Forecast, by Country 2019 & 2032
- Table 76: Mexico Sensors in Oil and Gas Market Revenue (Million) Forecast, by Application 2019 & 2032
- Table 77: Brazil Sensors in Oil and Gas Market Revenue (Million) Forecast, by Application 2019 & 2032
- Table 78: Argentina Sensors in Oil and Gas Market Revenue (Million) Forecast, by Application 2019 & 2032
- Table 79: Rest of Latin America Sensors in Oil and Gas Market Revenue (Million) Forecast, by Application 2019 & 2032
- Table 80: Global Sensors in Oil and Gas Market Revenue Million Forecast, by Sensor Type 2019 & 2032
- Table 81: Global Sensors in Oil and Gas Market Revenue Million Forecast, by Connectivity 2019 & 2032
- Table 82: Global Sensors in Oil and Gas Market Revenue Million Forecast, by Activity 2019 & 2032
- Table 83: Global Sensors in Oil and Gas Market Revenue Million Forecast, by Country 2019 & 2032
- Table 84: United Arab Emirates Sensors in Oil and Gas Market Revenue (Million) Forecast, by Application 2019 & 2032
- Table 85: Saudi Arabia Sensors in Oil and Gas Market Revenue (Million) Forecast, by Application 2019 & 2032
- Table 86: South Africa Sensors in Oil and Gas Market Revenue (Million) Forecast, by Application 2019 & 2032
- Table 87: Rest of Middle East and Africa Sensors in Oil and Gas Market Revenue (Million) Forecast, by Application 2019 & 2032
Frequently Asked Questions
1. What is the projected Compound Annual Growth Rate (CAGR) of the Sensors in Oil and Gas Market?
The projected CAGR is approximately 6.03%.
2. Which companies are prominent players in the Sensors in Oil and Gas Market?
Key companies in the market include Honeywell International Inc, ABB Ltd, GE Sensing & Inspection Technologies GmbH, Siemens AG, TE Connectivity Ltd, Robert Bosch GmbH, Rockwell Automation Inc, Analog Devices Inc, SKF A, Emerson Electric Company.
3. What are the main segments of the Sensors in Oil and Gas Market?
The market segments include Sensor Type, Connectivity, Activity.
4. Can you provide details about the market size?
The market size is estimated to be USD 9.97 Million as of 2022.
5. What are some drivers contributing to market growth?
Rising Demand for Safety Systems in the Oil and Gas Industry; Increasing Need for a Simplified Network Architecture in the Wireless Sensor Segment.
6. What are the notable trends driving market growth?
Upstream Industries Offer Potential Growth.
7. Are there any restraints impacting market growth?
Rigid Regulations Imposed on Oil and Gas Drilling Activities.
8. Can you provide examples of recent developments in the market?
October 2022: Svanehj Tank Control Systems supplied the tank gauging systems for six 220,000 m3 LNG tanks at the Longkou Nanshan LNG Terminal, which is being constructed in China. The client is COOEC, one of the biggest EPCI contractors for the Asia-Pacific region's offshore oil and gas industry. The 18 servo level gauges, six LTD gauges, 12 multi-spot temperature sensors, hardware, and software for data collecting and rollover prediction are all part of the order from COOEC.
9. What pricing options are available for accessing the report?
Pricing options include single-user, multi-user, and enterprise licenses priced at USD 4750, USD 5250, and USD 8750 respectively.
10. Is the market size provided in terms of value or volume?
The market size is provided in terms of value, measured in Million.
11. Are there any specific market keywords associated with the report?
Yes, the market keyword associated with the report is "Sensors in Oil and Gas Market," which aids in identifying and referencing the specific market segment covered.
12. How do I determine which pricing option suits my needs best?
The pricing options vary based on user requirements and access needs. Individual users may opt for single-user licenses, while businesses requiring broader access may choose multi-user or enterprise licenses for cost-effective access to the report.
13. Are there any additional resources or data provided in the Sensors in Oil and Gas Market report?
While the report offers comprehensive insights, it's advisable to review the specific contents or supplementary materials provided to ascertain if additional resources or data are available.
14. How can I stay updated on further developments or reports in the Sensors in Oil and Gas Market?
To stay informed about further developments, trends, and reports in the Sensors in Oil and Gas Market, consider subscribing to industry newsletters, following relevant companies and organizations, or regularly checking reputable industry news sources and publications.
Methodology
Step 1 - Identification of Relevant Samples Size from Population Database


Step 2 - Approaches for Defining Global Market Size (Value, Volume* & Price*)

Note*: In applicable scenarios
Step 3 - Data Sources
Primary Research
- Web Analytics
- Survey Reports
- Research Institute
- Latest Research Reports
- Opinion Leaders
Secondary Research
- Annual Reports
- White Paper
- Latest Press Release
- Industry Association
- Paid Database
- Investor Presentations

Step 4 - Data Triangulation
Involves using different sources of information in order to increase the validity of a study
These sources are likely to be stakeholders in a program - participants, other researchers, program staff, other community members, and so on.
Then we put all data in single framework & apply various statistical tools to find out the dynamic on the market.
During the analysis stage, feedback from the stakeholder groups would be compared to determine areas of agreement as well as areas of divergence
