

Key Insights
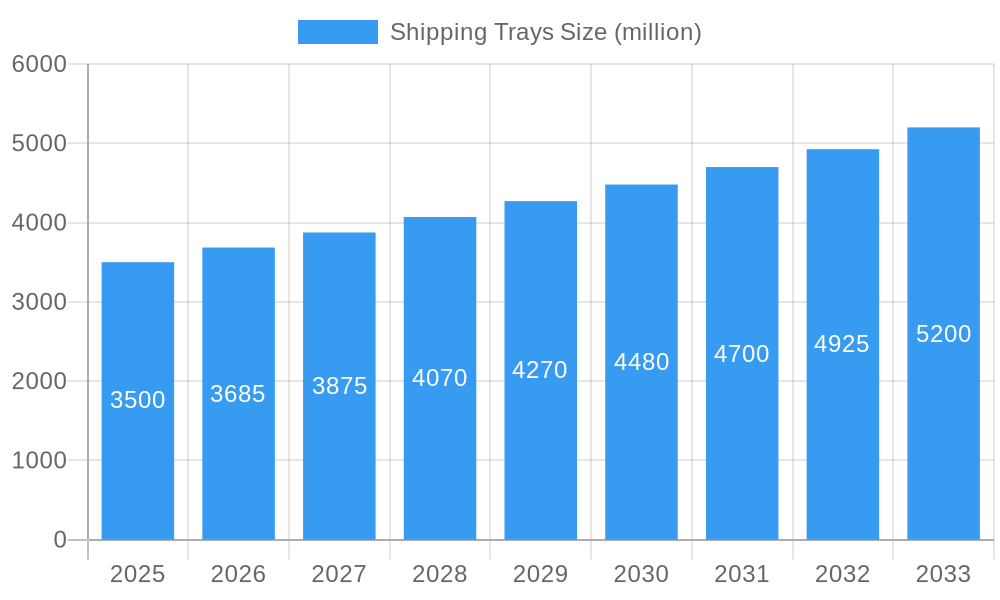
The global Shipping Trays market is projected to experience significant growth, reaching an estimated market size of approximately $3,500 million by 2025 and expanding further to $5,200 million by 2033, exhibiting a Compound Annual Growth Rate (CAGR) of around 4.5% during the forecast period. This robust expansion is primarily driven by the escalating demand for secure and efficient packaging solutions across a multitude of industries, including medical, electrical & electronics, and military & aerospace. The increasing complexities of global supply chains, coupled with a growing emphasis on product protection during transit, are fueling the adoption of specialized shipping trays. Furthermore, the surge in e-commerce activities has amplified the need for tailored and protective packaging, directly benefiting the shipping trays market. Innovations in material science, leading to lighter, more durable, and eco-friendly tray options, are also contributing to market dynamism.
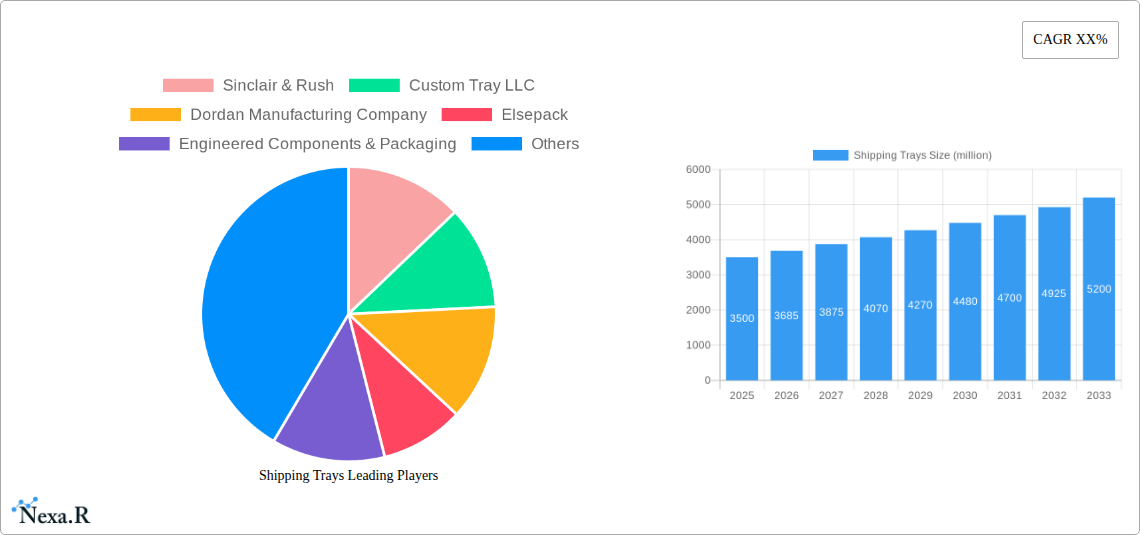
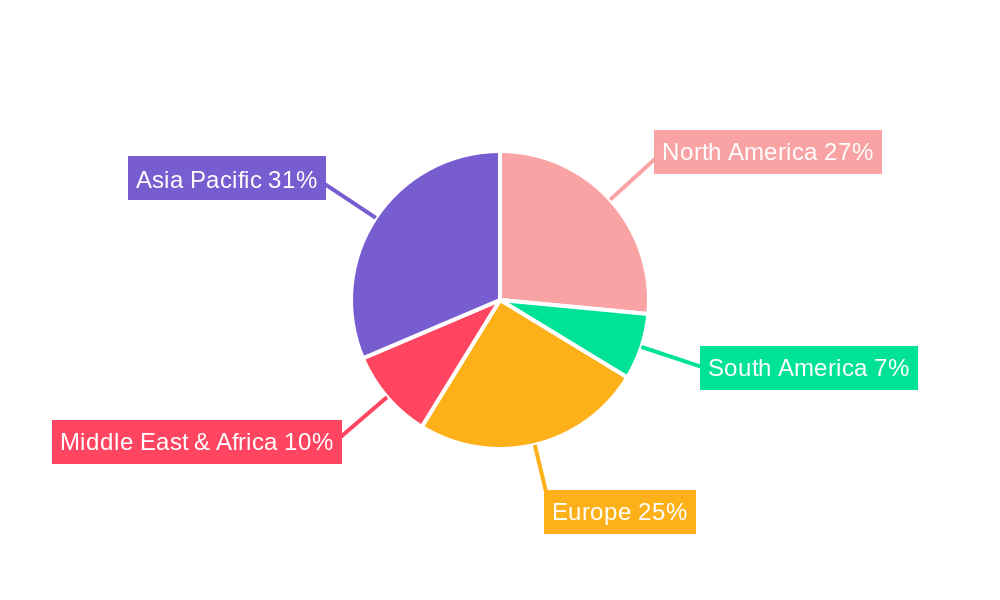
Shipping Trays Market Size (In Billion)
Key market restraints, such as the rising costs of raw materials and the ongoing environmental concerns associated with certain plastic-based packaging, present challenges. However, the industry is actively responding by developing sustainable alternatives and exploring advanced manufacturing techniques to optimize cost-effectiveness. The market is segmented into Disposable Shipping Trays and Reusable Shipping Trays, with disposable options currently holding a dominant share due to their widespread adoption in high-volume shipping. Reusable trays are gaining traction, especially in closed-loop logistics systems, driven by cost savings and sustainability initiatives. Geographically, Asia Pacific is anticipated to emerge as a leading region, driven by rapid industrialization and a burgeoning manufacturing sector, closely followed by North America and Europe, which benefit from established industrial bases and advanced logistics infrastructure. Key players like Sinclair & Rush, Custom Tray LLC, and Dordan Manufacturing Company are actively innovating to capture market share through product differentiation and strategic partnerships.
Shipping Trays Company Market Share
Shipping Trays Market Dynamics & Structure
The global shipping trays market exhibits a moderate concentration, with key players like Sinclair & Rush, Custom Tray LLC, Dordan Manufacturing Company, Elsepack, Engineered Components & Packaging, LLC, Universal Plastics Corporation, Young Jin Tech, Robinson Industries, Inc., and Elmes Packaging Inc. actively participating. Technological innovation is a significant driver, with advancements in material science leading to more sustainable and durable tray designs. Regulatory frameworks, particularly concerning environmental impact and material sourcing, are shaping manufacturing practices and product development. Competitive product substitutes, such as corrugated boxes and foam packaging, present an ongoing challenge, necessitating continuous innovation in performance and cost-effectiveness. End-user demographics are increasingly influenced by e-commerce growth, demanding efficient, protective, and often customizable shipping solutions across various sectors. Mergers and acquisitions (M&A) trends, while not dominating the landscape, are observed as companies seek to expand their product portfolios, geographical reach, or technological capabilities. For instance, acquisitions of smaller specialized tray manufacturers by larger packaging conglomerates have been noted to consolidate market share and enhance operational efficiencies. Barriers to innovation include the high cost of developing novel, sustainable materials and the need to meet stringent performance standards across diverse applications.
- Market Concentration: Moderate, with a blend of large established players and smaller niche manufacturers.
- Technological Innovation Drivers: Advancements in biodegradable plastics, smart packaging integration, and high-impact resistant materials.
- Regulatory Frameworks: Growing emphasis on recyclability, waste reduction, and adherence to international shipping standards.
- Competitive Product Substitutes: Corrugated inserts, molded pulp, and custom-designed foam cushioning.
- End-User Demographics: Driven by e-commerce expansion, demand for product protection during transit, and increasing focus on sustainability.
- M&A Trends: Strategic acquisitions to expand product lines and market access.
Shipping Trays Growth Trends & Insights
The global shipping trays market is poised for robust growth over the forecast period of 2025–2033, with a projected Compound Annual Growth Rate (CAGR) of XX%. This expansion is underpinned by a confluence of factors, including the escalating volume of global trade and the relentless surge in e-commerce. As online retail continues its upward trajectory, the demand for protective and efficient shipping solutions like trays escalates. This trend is particularly pronounced in the Electrical & Electronics and Medical sectors, where the delicate nature of products necessitates specialized packaging to prevent damage during transit. The adoption rate of advanced shipping tray technologies, such as those incorporating anti-static properties for electronics or sterile-grade materials for medical devices, is steadily increasing. Technological disruptions are also playing a pivotal role. The development of lightweight, yet remarkably durable, composite materials is revolutionizing tray manufacturing, offering improved performance with reduced environmental impact. Furthermore, the integration of smart technologies, such as RFID tags for enhanced inventory management, is beginning to permeate the market, offering added value beyond mere product protection. Consumer behavior shifts are also contributing significantly. There is a growing preference for reusable shipping trays among environmentally conscious businesses and consumers, driving innovation in durable and returnable packaging solutions. This aligns with a broader global movement towards circular economy principles, where waste reduction and resource efficiency are paramount. The market penetration of specialized shipping trays tailored for specific industry needs, like automotive components or delicate consumer goods, is deepening as manufacturers recognize the value of customized solutions. The base year of 2025 marks a strong foundation for this growth, with estimated market size reaching $XX million units. By the estimated year of 2025, this figure is projected to see further upward revision based on current market momentum. The historical period of 2019–2024 has laid the groundwork, showcasing a consistent demand and gradual technological evolution, setting the stage for accelerated growth in the coming decade. The forecast period of 2025–2033 anticipates not only quantitative market expansion but also qualitative shifts in how shipping trays are designed, utilized, and perceived, moving towards more intelligent, sustainable, and integrated packaging ecosystems.
Dominant Regions, Countries, or Segments in Shipping Trays
The Electrical & Electronics segment is emerging as a dominant force within the global shipping trays market, driven by the relentless growth of consumer electronics, telecommunications, and the burgeoning Internet of Things (IoT) sector. This segment’s dominance is fueled by the inherent fragility of its products, which include semiconductors, circuit boards, and sensitive electronic components. The stringent requirements for static discharge prevention, shock absorption, and precise product placement make specialized shipping trays indispensable. Countries with robust manufacturing bases and significant consumption of electronic goods, such as China, are leading this regional growth. China's extensive electronics manufacturing ecosystem, coupled with its position as a global supplier, directly translates to a massive demand for protective shipping solutions. Furthermore, supportive government policies promoting technological advancement and export growth in the electronics sector create a favorable environment for shipping tray manufacturers. The market share within the Electrical & Electronics segment is substantial, estimated at XX% in 2025, and is projected to grow at a CAGR of XX% from 2025–2033.
Key Drivers for Dominance:
- Product Fragility: High susceptibility of electronic components to damage during transit.
- Static Discharge Prevention: Critical need for anti-static materials in trays for sensitive electronics.
- Precision Placement: Requirement for custom-designed trays to secure individual components and prevent movement.
- E-commerce Growth: Proliferation of online sales of electronics, increasing the volume of individual shipments.
- Technological Advancements: Continuous innovation in electronic devices necessitates evolving packaging solutions.
- Global Supply Chains: The intricate global network of electronics manufacturing and distribution relies heavily on secure packaging.
In terms of Types, Disposable Shipping Trays currently hold a larger market share, driven by cost-effectiveness and suitability for high-volume, single-use applications, particularly in the rapidly expanding e-commerce sector. However, Reusable Shipping Trays are witnessing a significant upswing in demand, propelled by growing environmental consciousness and the implementation of corporate sustainability initiatives. Regions with strong regulatory mandates for waste reduction and a developed logistics infrastructure for reverse logistics are seeing accelerated adoption of reusable trays. This segment’s growth potential is substantial, with an anticipated CAGR of XX% from 2025–2033.
Dominance Factors for Disposable Shipping Trays:
- Cost-Effectiveness: Lower per-unit cost for mass distribution.
- Hygiene and Sterility: Preferred for certain single-use applications, especially in the medical field.
- Convenience: Eliminates the need for return logistics, simplifying supply chain operations.
Growth Potential for Reusable Shipping Trays:
- Sustainability Focus: Aligns with corporate social responsibility and environmental goals.
- Reduced Long-Term Costs: Lower total cost of ownership over multiple use cycles.
- Regulatory Incentives: Government initiatives promoting waste reduction and circular economy models.
- Enhanced Brand Image: Companies using reusable packaging often benefit from positive consumer perception.
The Medical application segment also presents a significant and growing area for shipping trays. The increasing demand for pharmaceuticals, medical devices, and diagnostic kits, coupled with stringent sterility and safety regulations, drives the need for specialized, often single-use, medical shipping trays.
Shipping Trays Product Landscape
The shipping trays market is characterized by continuous product innovation, focusing on enhanced protection, sustainability, and cost-efficiency. Advancements include the development of lightweight yet high-strength polymer trays offering superior impact resistance for sensitive electronics and fragile consumer products. Biodegradable and compostable materials are gaining traction, addressing environmental concerns without compromising protective performance. Specific product innovations include thermoformed trays with intricate cavities for precise component segregation in medical and aerospace applications, and anti-static trays essential for safeguarding delicate electrical and electronic components. The performance metrics being optimized include load-bearing capacity, vibration dampening, and chemical resistance, crucial for industries like military & aerospace and construction. Unique selling propositions revolve around customized design capabilities, the integration of sustainable material options, and adherence to industry-specific compliance standards.
Key Drivers, Barriers & Challenges in Shipping Trays
The shipping trays market is propelled by several key drivers: the escalating growth of e-commerce, demanding efficient and protective packaging solutions; the expansion of the medical device and pharmaceutical industries, requiring sterile and secure containment; and the ongoing technological advancements in material science, enabling the development of more sustainable and durable tray options. Furthermore, global trade expansion and the need for robust supply chain logistics contribute significantly.
Key challenges and restraints include the fluctuating raw material costs, particularly for plastics, which can impact pricing and profitability. Stringent regulatory requirements in certain sectors, such as medical and aerospace, necessitate significant investment in compliance and quality control, creating a barrier for smaller players. Intense competition from alternative packaging materials like corrugated cardboard and molded pulp exerts constant pressure on pricing. Supply chain disruptions, as experienced in recent years, can lead to material shortages and increased lead times, impacting production schedules.
Emerging Opportunities in Shipping Trays
Emerging opportunities lie in the development of smart shipping trays integrated with IoT sensors for real-time tracking, condition monitoring, and inventory management, particularly for high-value or temperature-sensitive goods. The growing demand for sustainable packaging presents a significant avenue for innovation in biodegradable, compostable, and recycled materials, catering to environmentally conscious businesses and consumers. Untapped markets in developing economies with expanding e-commerce penetration offer substantial growth potential. Furthermore, the increasing complexity of product designs across various industries necessitates more specialized and custom-designed shipping tray solutions.
Growth Accelerators in the Shipping Trays Industry
Long-term growth in the shipping trays industry is significantly accelerated by technological breakthroughs in material science, leading to the creation of lighter, stronger, and more eco-friendly packaging. Strategic partnerships between tray manufacturers and logistics companies are fostering the development of integrated packaging and delivery solutions, optimizing the entire supply chain. Market expansion strategies, including entering new geographical regions and targeting emerging industries with bespoke packaging needs, are also crucial growth catalysts. The ongoing digital transformation, enabling greater customization and on-demand manufacturing of trays, further fuels industry expansion.
Key Players Shaping the Shipping Trays Market
- Sinclair & Rush
- Custom Tray LLC
- Dordan Manufacturing Company
- Elsepack
- Engineered Components & Packaging, LLC
- Universal Plastics Corporation
- Young Jin Tech
- Robinson Industries, Inc.
- Elmes Packaging Inc.
Notable Milestones in Shipping Trays Sector
- 2019: Increased adoption of recycled plastics in tray manufacturing for consumer goods.
- 2020: Surge in demand for specialized trays for medical supplies and PPE due to the global pandemic.
- 2021: Development of advanced anti-static tray materials for the booming electronics sector.
- 2022: Introduction of innovative biodegradable shipping trays in the food and beverage industry.
- 2023: Greater integration of custom thermoforming for precise component packaging in aerospace.
- 2024: Enhanced focus on returnable and reusable tray systems to meet sustainability targets.
In-Depth Shipping Trays Market Outlook
The future outlook for the shipping trays market is exceptionally positive, driven by the convergence of e-commerce expansion, stringent product protection requirements across diverse industries, and a global push towards sustainability. Growth accelerators like advanced material innovation, particularly in biodegradable and high-performance polymers, will continue to redefine product offerings. Strategic collaborations between packaging providers and end-users will foster the development of tailored solutions that enhance supply chain efficiency and reduce product damage. Emerging markets offer significant untapped potential, while the increasing sophistication of product designs will fuel demand for highly specialized and customized shipping trays. The market is poised for substantial growth, presenting ample opportunities for companies investing in innovation and sustainable practices.
Shipping Trays Segmentation
-
1. Application
- 1.1. Medical
- 1.2. Electrical & Electronics
- 1.3. Military & Aerospace
- 1.4. Consumer Products
- 1.5. Construction
- 1.6. Others
-
2. Types
- 2.1. Disposable Shipping Trays
- 2.2. Reusable Shipping Trays
Shipping Trays Segmentation By Geography
-
1. North America
- 1.1. United States
- 1.2. Canada
- 1.3. Mexico
-
2. South America
- 2.1. Brazil
- 2.2. Argentina
- 2.3. Rest of South America
-
3. Europe
- 3.1. United Kingdom
- 3.2. Germany
- 3.3. France
- 3.4. Italy
- 3.5. Spain
- 3.6. Russia
- 3.7. Benelux
- 3.8. Nordics
- 3.9. Rest of Europe
-
4. Middle East & Africa
- 4.1. Turkey
- 4.2. Israel
- 4.3. GCC
- 4.4. North Africa
- 4.5. South Africa
- 4.6. Rest of Middle East & Africa
-
5. Asia Pacific
- 5.1. China
- 5.2. India
- 5.3. Japan
- 5.4. South Korea
- 5.5. ASEAN
- 5.6. Oceania
- 5.7. Rest of Asia Pacific
Shipping Trays Regional Market Share
Geographic Coverage of Shipping Trays
Shipping Trays REPORT HIGHLIGHTS
| Aspects | Details |
|---|---|
| Study Period | 2020-2034 |
| Base Year | 2025 |
| Estimated Year | 2026 |
| Forecast Period | 2026-2034 |
| Historical Period | 2020-2025 |
| Growth Rate | CAGR of 7% from 2020-2034 |
| Segmentation |
|
Table of Contents
- 1. Introduction
- 1.1. Research Scope
- 1.2. Market Segmentation
- 1.3. Research Methodology
- 1.4. Definitions and Assumptions
- 2. Executive Summary
- 2.1. Introduction
- 3. Market Dynamics
- 3.1. Introduction
- 3.2. Market Drivers
- 3.3. Market Restrains
- 3.4. Market Trends
- 4. Market Factor Analysis
- 4.1. Porters Five Forces
- 4.2. Supply/Value Chain
- 4.3. PESTEL analysis
- 4.4. Market Entropy
- 4.5. Patent/Trademark Analysis
- 5. Global Shipping Trays Analysis, Insights and Forecast, 2020-2032
- 5.1. Market Analysis, Insights and Forecast - by Application
- 5.1.1. Medical
- 5.1.2. Electrical & Electronics
- 5.1.3. Military & Aerospace
- 5.1.4. Consumer Products
- 5.1.5. Construction
- 5.1.6. Others
- 5.2. Market Analysis, Insights and Forecast - by Types
- 5.2.1. Disposable Shipping Trays
- 5.2.2. Reusable Shipping Trays
- 5.3. Market Analysis, Insights and Forecast - by Region
- 5.3.1. North America
- 5.3.2. South America
- 5.3.3. Europe
- 5.3.4. Middle East & Africa
- 5.3.5. Asia Pacific
- 5.1. Market Analysis, Insights and Forecast - by Application
- 6. North America Shipping Trays Analysis, Insights and Forecast, 2020-2032
- 6.1. Market Analysis, Insights and Forecast - by Application
- 6.1.1. Medical
- 6.1.2. Electrical & Electronics
- 6.1.3. Military & Aerospace
- 6.1.4. Consumer Products
- 6.1.5. Construction
- 6.1.6. Others
- 6.2. Market Analysis, Insights and Forecast - by Types
- 6.2.1. Disposable Shipping Trays
- 6.2.2. Reusable Shipping Trays
- 6.1. Market Analysis, Insights and Forecast - by Application
- 7. South America Shipping Trays Analysis, Insights and Forecast, 2020-2032
- 7.1. Market Analysis, Insights and Forecast - by Application
- 7.1.1. Medical
- 7.1.2. Electrical & Electronics
- 7.1.3. Military & Aerospace
- 7.1.4. Consumer Products
- 7.1.5. Construction
- 7.1.6. Others
- 7.2. Market Analysis, Insights and Forecast - by Types
- 7.2.1. Disposable Shipping Trays
- 7.2.2. Reusable Shipping Trays
- 7.1. Market Analysis, Insights and Forecast - by Application
- 8. Europe Shipping Trays Analysis, Insights and Forecast, 2020-2032
- 8.1. Market Analysis, Insights and Forecast - by Application
- 8.1.1. Medical
- 8.1.2. Electrical & Electronics
- 8.1.3. Military & Aerospace
- 8.1.4. Consumer Products
- 8.1.5. Construction
- 8.1.6. Others
- 8.2. Market Analysis, Insights and Forecast - by Types
- 8.2.1. Disposable Shipping Trays
- 8.2.2. Reusable Shipping Trays
- 8.1. Market Analysis, Insights and Forecast - by Application
- 9. Middle East & Africa Shipping Trays Analysis, Insights and Forecast, 2020-2032
- 9.1. Market Analysis, Insights and Forecast - by Application
- 9.1.1. Medical
- 9.1.2. Electrical & Electronics
- 9.1.3. Military & Aerospace
- 9.1.4. Consumer Products
- 9.1.5. Construction
- 9.1.6. Others
- 9.2. Market Analysis, Insights and Forecast - by Types
- 9.2.1. Disposable Shipping Trays
- 9.2.2. Reusable Shipping Trays
- 9.1. Market Analysis, Insights and Forecast - by Application
- 10. Asia Pacific Shipping Trays Analysis, Insights and Forecast, 2020-2032
- 10.1. Market Analysis, Insights and Forecast - by Application
- 10.1.1. Medical
- 10.1.2. Electrical & Electronics
- 10.1.3. Military & Aerospace
- 10.1.4. Consumer Products
- 10.1.5. Construction
- 10.1.6. Others
- 10.2. Market Analysis, Insights and Forecast - by Types
- 10.2.1. Disposable Shipping Trays
- 10.2.2. Reusable Shipping Trays
- 10.1. Market Analysis, Insights and Forecast - by Application
- 11. Competitive Analysis
- 11.1. Global Market Share Analysis 2025
- 11.2. Company Profiles
- 11.2.1 Sinclair & Rush
- 11.2.1.1. Overview
- 11.2.1.2. Products
- 11.2.1.3. SWOT Analysis
- 11.2.1.4. Recent Developments
- 11.2.1.5. Financials (Based on Availability)
- 11.2.2 Custom Tray LLC
- 11.2.2.1. Overview
- 11.2.2.2. Products
- 11.2.2.3. SWOT Analysis
- 11.2.2.4. Recent Developments
- 11.2.2.5. Financials (Based on Availability)
- 11.2.3 Dordan Manufacturing Company
- 11.2.3.1. Overview
- 11.2.3.2. Products
- 11.2.3.3. SWOT Analysis
- 11.2.3.4. Recent Developments
- 11.2.3.5. Financials (Based on Availability)
- 11.2.4 Elsepack
- 11.2.4.1. Overview
- 11.2.4.2. Products
- 11.2.4.3. SWOT Analysis
- 11.2.4.4. Recent Developments
- 11.2.4.5. Financials (Based on Availability)
- 11.2.5 Engineered Components & Packaging
- 11.2.5.1. Overview
- 11.2.5.2. Products
- 11.2.5.3. SWOT Analysis
- 11.2.5.4. Recent Developments
- 11.2.5.5. Financials (Based on Availability)
- 11.2.6 LLC
- 11.2.6.1. Overview
- 11.2.6.2. Products
- 11.2.6.3. SWOT Analysis
- 11.2.6.4. Recent Developments
- 11.2.6.5. Financials (Based on Availability)
- 11.2.7 Universal Plastics Corporation
- 11.2.7.1. Overview
- 11.2.7.2. Products
- 11.2.7.3. SWOT Analysis
- 11.2.7.4. Recent Developments
- 11.2.7.5. Financials (Based on Availability)
- 11.2.8 Young Jin Tech
- 11.2.8.1. Overview
- 11.2.8.2. Products
- 11.2.8.3. SWOT Analysis
- 11.2.8.4. Recent Developments
- 11.2.8.5. Financials (Based on Availability)
- 11.2.9 Robinson Industries
- 11.2.9.1. Overview
- 11.2.9.2. Products
- 11.2.9.3. SWOT Analysis
- 11.2.9.4. Recent Developments
- 11.2.9.5. Financials (Based on Availability)
- 11.2.10 Inc.
- 11.2.10.1. Overview
- 11.2.10.2. Products
- 11.2.10.3. SWOT Analysis
- 11.2.10.4. Recent Developments
- 11.2.10.5. Financials (Based on Availability)
- 11.2.11 Elmes Packaging Inc.
- 11.2.11.1. Overview
- 11.2.11.2. Products
- 11.2.11.3. SWOT Analysis
- 11.2.11.4. Recent Developments
- 11.2.11.5. Financials (Based on Availability)
- 11.2.1 Sinclair & Rush
List of Figures
- Figure 1: Global Shipping Trays Revenue Breakdown (undefined, %) by Region 2025 & 2033
- Figure 2: Global Shipping Trays Volume Breakdown (K, %) by Region 2025 & 2033
- Figure 3: North America Shipping Trays Revenue (undefined), by Application 2025 & 2033
- Figure 4: North America Shipping Trays Volume (K), by Application 2025 & 2033
- Figure 5: North America Shipping Trays Revenue Share (%), by Application 2025 & 2033
- Figure 6: North America Shipping Trays Volume Share (%), by Application 2025 & 2033
- Figure 7: North America Shipping Trays Revenue (undefined), by Types 2025 & 2033
- Figure 8: North America Shipping Trays Volume (K), by Types 2025 & 2033
- Figure 9: North America Shipping Trays Revenue Share (%), by Types 2025 & 2033
- Figure 10: North America Shipping Trays Volume Share (%), by Types 2025 & 2033
- Figure 11: North America Shipping Trays Revenue (undefined), by Country 2025 & 2033
- Figure 12: North America Shipping Trays Volume (K), by Country 2025 & 2033
- Figure 13: North America Shipping Trays Revenue Share (%), by Country 2025 & 2033
- Figure 14: North America Shipping Trays Volume Share (%), by Country 2025 & 2033
- Figure 15: South America Shipping Trays Revenue (undefined), by Application 2025 & 2033
- Figure 16: South America Shipping Trays Volume (K), by Application 2025 & 2033
- Figure 17: South America Shipping Trays Revenue Share (%), by Application 2025 & 2033
- Figure 18: South America Shipping Trays Volume Share (%), by Application 2025 & 2033
- Figure 19: South America Shipping Trays Revenue (undefined), by Types 2025 & 2033
- Figure 20: South America Shipping Trays Volume (K), by Types 2025 & 2033
- Figure 21: South America Shipping Trays Revenue Share (%), by Types 2025 & 2033
- Figure 22: South America Shipping Trays Volume Share (%), by Types 2025 & 2033
- Figure 23: South America Shipping Trays Revenue (undefined), by Country 2025 & 2033
- Figure 24: South America Shipping Trays Volume (K), by Country 2025 & 2033
- Figure 25: South America Shipping Trays Revenue Share (%), by Country 2025 & 2033
- Figure 26: South America Shipping Trays Volume Share (%), by Country 2025 & 2033
- Figure 27: Europe Shipping Trays Revenue (undefined), by Application 2025 & 2033
- Figure 28: Europe Shipping Trays Volume (K), by Application 2025 & 2033
- Figure 29: Europe Shipping Trays Revenue Share (%), by Application 2025 & 2033
- Figure 30: Europe Shipping Trays Volume Share (%), by Application 2025 & 2033
- Figure 31: Europe Shipping Trays Revenue (undefined), by Types 2025 & 2033
- Figure 32: Europe Shipping Trays Volume (K), by Types 2025 & 2033
- Figure 33: Europe Shipping Trays Revenue Share (%), by Types 2025 & 2033
- Figure 34: Europe Shipping Trays Volume Share (%), by Types 2025 & 2033
- Figure 35: Europe Shipping Trays Revenue (undefined), by Country 2025 & 2033
- Figure 36: Europe Shipping Trays Volume (K), by Country 2025 & 2033
- Figure 37: Europe Shipping Trays Revenue Share (%), by Country 2025 & 2033
- Figure 38: Europe Shipping Trays Volume Share (%), by Country 2025 & 2033
- Figure 39: Middle East & Africa Shipping Trays Revenue (undefined), by Application 2025 & 2033
- Figure 40: Middle East & Africa Shipping Trays Volume (K), by Application 2025 & 2033
- Figure 41: Middle East & Africa Shipping Trays Revenue Share (%), by Application 2025 & 2033
- Figure 42: Middle East & Africa Shipping Trays Volume Share (%), by Application 2025 & 2033
- Figure 43: Middle East & Africa Shipping Trays Revenue (undefined), by Types 2025 & 2033
- Figure 44: Middle East & Africa Shipping Trays Volume (K), by Types 2025 & 2033
- Figure 45: Middle East & Africa Shipping Trays Revenue Share (%), by Types 2025 & 2033
- Figure 46: Middle East & Africa Shipping Trays Volume Share (%), by Types 2025 & 2033
- Figure 47: Middle East & Africa Shipping Trays Revenue (undefined), by Country 2025 & 2033
- Figure 48: Middle East & Africa Shipping Trays Volume (K), by Country 2025 & 2033
- Figure 49: Middle East & Africa Shipping Trays Revenue Share (%), by Country 2025 & 2033
- Figure 50: Middle East & Africa Shipping Trays Volume Share (%), by Country 2025 & 2033
- Figure 51: Asia Pacific Shipping Trays Revenue (undefined), by Application 2025 & 2033
- Figure 52: Asia Pacific Shipping Trays Volume (K), by Application 2025 & 2033
- Figure 53: Asia Pacific Shipping Trays Revenue Share (%), by Application 2025 & 2033
- Figure 54: Asia Pacific Shipping Trays Volume Share (%), by Application 2025 & 2033
- Figure 55: Asia Pacific Shipping Trays Revenue (undefined), by Types 2025 & 2033
- Figure 56: Asia Pacific Shipping Trays Volume (K), by Types 2025 & 2033
- Figure 57: Asia Pacific Shipping Trays Revenue Share (%), by Types 2025 & 2033
- Figure 58: Asia Pacific Shipping Trays Volume Share (%), by Types 2025 & 2033
- Figure 59: Asia Pacific Shipping Trays Revenue (undefined), by Country 2025 & 2033
- Figure 60: Asia Pacific Shipping Trays Volume (K), by Country 2025 & 2033
- Figure 61: Asia Pacific Shipping Trays Revenue Share (%), by Country 2025 & 2033
- Figure 62: Asia Pacific Shipping Trays Volume Share (%), by Country 2025 & 2033
List of Tables
- Table 1: Global Shipping Trays Revenue undefined Forecast, by Application 2020 & 2033
- Table 2: Global Shipping Trays Volume K Forecast, by Application 2020 & 2033
- Table 3: Global Shipping Trays Revenue undefined Forecast, by Types 2020 & 2033
- Table 4: Global Shipping Trays Volume K Forecast, by Types 2020 & 2033
- Table 5: Global Shipping Trays Revenue undefined Forecast, by Region 2020 & 2033
- Table 6: Global Shipping Trays Volume K Forecast, by Region 2020 & 2033
- Table 7: Global Shipping Trays Revenue undefined Forecast, by Application 2020 & 2033
- Table 8: Global Shipping Trays Volume K Forecast, by Application 2020 & 2033
- Table 9: Global Shipping Trays Revenue undefined Forecast, by Types 2020 & 2033
- Table 10: Global Shipping Trays Volume K Forecast, by Types 2020 & 2033
- Table 11: Global Shipping Trays Revenue undefined Forecast, by Country 2020 & 2033
- Table 12: Global Shipping Trays Volume K Forecast, by Country 2020 & 2033
- Table 13: United States Shipping Trays Revenue (undefined) Forecast, by Application 2020 & 2033
- Table 14: United States Shipping Trays Volume (K) Forecast, by Application 2020 & 2033
- Table 15: Canada Shipping Trays Revenue (undefined) Forecast, by Application 2020 & 2033
- Table 16: Canada Shipping Trays Volume (K) Forecast, by Application 2020 & 2033
- Table 17: Mexico Shipping Trays Revenue (undefined) Forecast, by Application 2020 & 2033
- Table 18: Mexico Shipping Trays Volume (K) Forecast, by Application 2020 & 2033
- Table 19: Global Shipping Trays Revenue undefined Forecast, by Application 2020 & 2033
- Table 20: Global Shipping Trays Volume K Forecast, by Application 2020 & 2033
- Table 21: Global Shipping Trays Revenue undefined Forecast, by Types 2020 & 2033
- Table 22: Global Shipping Trays Volume K Forecast, by Types 2020 & 2033
- Table 23: Global Shipping Trays Revenue undefined Forecast, by Country 2020 & 2033
- Table 24: Global Shipping Trays Volume K Forecast, by Country 2020 & 2033
- Table 25: Brazil Shipping Trays Revenue (undefined) Forecast, by Application 2020 & 2033
- Table 26: Brazil Shipping Trays Volume (K) Forecast, by Application 2020 & 2033
- Table 27: Argentina Shipping Trays Revenue (undefined) Forecast, by Application 2020 & 2033
- Table 28: Argentina Shipping Trays Volume (K) Forecast, by Application 2020 & 2033
- Table 29: Rest of South America Shipping Trays Revenue (undefined) Forecast, by Application 2020 & 2033
- Table 30: Rest of South America Shipping Trays Volume (K) Forecast, by Application 2020 & 2033
- Table 31: Global Shipping Trays Revenue undefined Forecast, by Application 2020 & 2033
- Table 32: Global Shipping Trays Volume K Forecast, by Application 2020 & 2033
- Table 33: Global Shipping Trays Revenue undefined Forecast, by Types 2020 & 2033
- Table 34: Global Shipping Trays Volume K Forecast, by Types 2020 & 2033
- Table 35: Global Shipping Trays Revenue undefined Forecast, by Country 2020 & 2033
- Table 36: Global Shipping Trays Volume K Forecast, by Country 2020 & 2033
- Table 37: United Kingdom Shipping Trays Revenue (undefined) Forecast, by Application 2020 & 2033
- Table 38: United Kingdom Shipping Trays Volume (K) Forecast, by Application 2020 & 2033
- Table 39: Germany Shipping Trays Revenue (undefined) Forecast, by Application 2020 & 2033
- Table 40: Germany Shipping Trays Volume (K) Forecast, by Application 2020 & 2033
- Table 41: France Shipping Trays Revenue (undefined) Forecast, by Application 2020 & 2033
- Table 42: France Shipping Trays Volume (K) Forecast, by Application 2020 & 2033
- Table 43: Italy Shipping Trays Revenue (undefined) Forecast, by Application 2020 & 2033
- Table 44: Italy Shipping Trays Volume (K) Forecast, by Application 2020 & 2033
- Table 45: Spain Shipping Trays Revenue (undefined) Forecast, by Application 2020 & 2033
- Table 46: Spain Shipping Trays Volume (K) Forecast, by Application 2020 & 2033
- Table 47: Russia Shipping Trays Revenue (undefined) Forecast, by Application 2020 & 2033
- Table 48: Russia Shipping Trays Volume (K) Forecast, by Application 2020 & 2033
- Table 49: Benelux Shipping Trays Revenue (undefined) Forecast, by Application 2020 & 2033
- Table 50: Benelux Shipping Trays Volume (K) Forecast, by Application 2020 & 2033
- Table 51: Nordics Shipping Trays Revenue (undefined) Forecast, by Application 2020 & 2033
- Table 52: Nordics Shipping Trays Volume (K) Forecast, by Application 2020 & 2033
- Table 53: Rest of Europe Shipping Trays Revenue (undefined) Forecast, by Application 2020 & 2033
- Table 54: Rest of Europe Shipping Trays Volume (K) Forecast, by Application 2020 & 2033
- Table 55: Global Shipping Trays Revenue undefined Forecast, by Application 2020 & 2033
- Table 56: Global Shipping Trays Volume K Forecast, by Application 2020 & 2033
- Table 57: Global Shipping Trays Revenue undefined Forecast, by Types 2020 & 2033
- Table 58: Global Shipping Trays Volume K Forecast, by Types 2020 & 2033
- Table 59: Global Shipping Trays Revenue undefined Forecast, by Country 2020 & 2033
- Table 60: Global Shipping Trays Volume K Forecast, by Country 2020 & 2033
- Table 61: Turkey Shipping Trays Revenue (undefined) Forecast, by Application 2020 & 2033
- Table 62: Turkey Shipping Trays Volume (K) Forecast, by Application 2020 & 2033
- Table 63: Israel Shipping Trays Revenue (undefined) Forecast, by Application 2020 & 2033
- Table 64: Israel Shipping Trays Volume (K) Forecast, by Application 2020 & 2033
- Table 65: GCC Shipping Trays Revenue (undefined) Forecast, by Application 2020 & 2033
- Table 66: GCC Shipping Trays Volume (K) Forecast, by Application 2020 & 2033
- Table 67: North Africa Shipping Trays Revenue (undefined) Forecast, by Application 2020 & 2033
- Table 68: North Africa Shipping Trays Volume (K) Forecast, by Application 2020 & 2033
- Table 69: South Africa Shipping Trays Revenue (undefined) Forecast, by Application 2020 & 2033
- Table 70: South Africa Shipping Trays Volume (K) Forecast, by Application 2020 & 2033
- Table 71: Rest of Middle East & Africa Shipping Trays Revenue (undefined) Forecast, by Application 2020 & 2033
- Table 72: Rest of Middle East & Africa Shipping Trays Volume (K) Forecast, by Application 2020 & 2033
- Table 73: Global Shipping Trays Revenue undefined Forecast, by Application 2020 & 2033
- Table 74: Global Shipping Trays Volume K Forecast, by Application 2020 & 2033
- Table 75: Global Shipping Trays Revenue undefined Forecast, by Types 2020 & 2033
- Table 76: Global Shipping Trays Volume K Forecast, by Types 2020 & 2033
- Table 77: Global Shipping Trays Revenue undefined Forecast, by Country 2020 & 2033
- Table 78: Global Shipping Trays Volume K Forecast, by Country 2020 & 2033
- Table 79: China Shipping Trays Revenue (undefined) Forecast, by Application 2020 & 2033
- Table 80: China Shipping Trays Volume (K) Forecast, by Application 2020 & 2033
- Table 81: India Shipping Trays Revenue (undefined) Forecast, by Application 2020 & 2033
- Table 82: India Shipping Trays Volume (K) Forecast, by Application 2020 & 2033
- Table 83: Japan Shipping Trays Revenue (undefined) Forecast, by Application 2020 & 2033
- Table 84: Japan Shipping Trays Volume (K) Forecast, by Application 2020 & 2033
- Table 85: South Korea Shipping Trays Revenue (undefined) Forecast, by Application 2020 & 2033
- Table 86: South Korea Shipping Trays Volume (K) Forecast, by Application 2020 & 2033
- Table 87: ASEAN Shipping Trays Revenue (undefined) Forecast, by Application 2020 & 2033
- Table 88: ASEAN Shipping Trays Volume (K) Forecast, by Application 2020 & 2033
- Table 89: Oceania Shipping Trays Revenue (undefined) Forecast, by Application 2020 & 2033
- Table 90: Oceania Shipping Trays Volume (K) Forecast, by Application 2020 & 2033
- Table 91: Rest of Asia Pacific Shipping Trays Revenue (undefined) Forecast, by Application 2020 & 2033
- Table 92: Rest of Asia Pacific Shipping Trays Volume (K) Forecast, by Application 2020 & 2033
Frequently Asked Questions
1. What is the projected Compound Annual Growth Rate (CAGR) of the Shipping Trays?
The projected CAGR is approximately 7%.
2. Which companies are prominent players in the Shipping Trays?
Key companies in the market include Sinclair & Rush, Custom Tray LLC, Dordan Manufacturing Company, Elsepack, Engineered Components & Packaging, LLC, Universal Plastics Corporation, Young Jin Tech, Robinson Industries, Inc., Elmes Packaging Inc..
3. What are the main segments of the Shipping Trays?
The market segments include Application, Types.
4. Can you provide details about the market size?
The market size is estimated to be USD XXX N/A as of 2022.
5. What are some drivers contributing to market growth?
N/A
6. What are the notable trends driving market growth?
N/A
7. Are there any restraints impacting market growth?
N/A
8. Can you provide examples of recent developments in the market?
N/A
9. What pricing options are available for accessing the report?
Pricing options include single-user, multi-user, and enterprise licenses priced at USD 3350.00, USD 5025.00, and USD 6700.00 respectively.
10. Is the market size provided in terms of value or volume?
The market size is provided in terms of value, measured in N/A and volume, measured in K.
11. Are there any specific market keywords associated with the report?
Yes, the market keyword associated with the report is "Shipping Trays," which aids in identifying and referencing the specific market segment covered.
12. How do I determine which pricing option suits my needs best?
The pricing options vary based on user requirements and access needs. Individual users may opt for single-user licenses, while businesses requiring broader access may choose multi-user or enterprise licenses for cost-effective access to the report.
13. Are there any additional resources or data provided in the Shipping Trays report?
While the report offers comprehensive insights, it's advisable to review the specific contents or supplementary materials provided to ascertain if additional resources or data are available.
14. How can I stay updated on further developments or reports in the Shipping Trays?
To stay informed about further developments, trends, and reports in the Shipping Trays, consider subscribing to industry newsletters, following relevant companies and organizations, or regularly checking reputable industry news sources and publications.
Methodology
Step 1 - Identification of Relevant Samples Size from Population Database


Step 2 - Approaches for Defining Global Market Size (Value, Volume* & Price*)

Note*: In applicable scenarios
Step 3 - Data Sources
Primary Research
- Web Analytics
- Survey Reports
- Research Institute
- Latest Research Reports
- Opinion Leaders
Secondary Research
- Annual Reports
- White Paper
- Latest Press Release
- Industry Association
- Paid Database
- Investor Presentations

Step 4 - Data Triangulation
Involves using different sources of information in order to increase the validity of a study
These sources are likely to be stakeholders in a program - participants, other researchers, program staff, other community members, and so on.
Then we put all data in single framework & apply various statistical tools to find out the dynamic on the market.
During the analysis stage, feedback from the stakeholder groups would be compared to determine areas of agreement as well as areas of divergence