

Key Insights
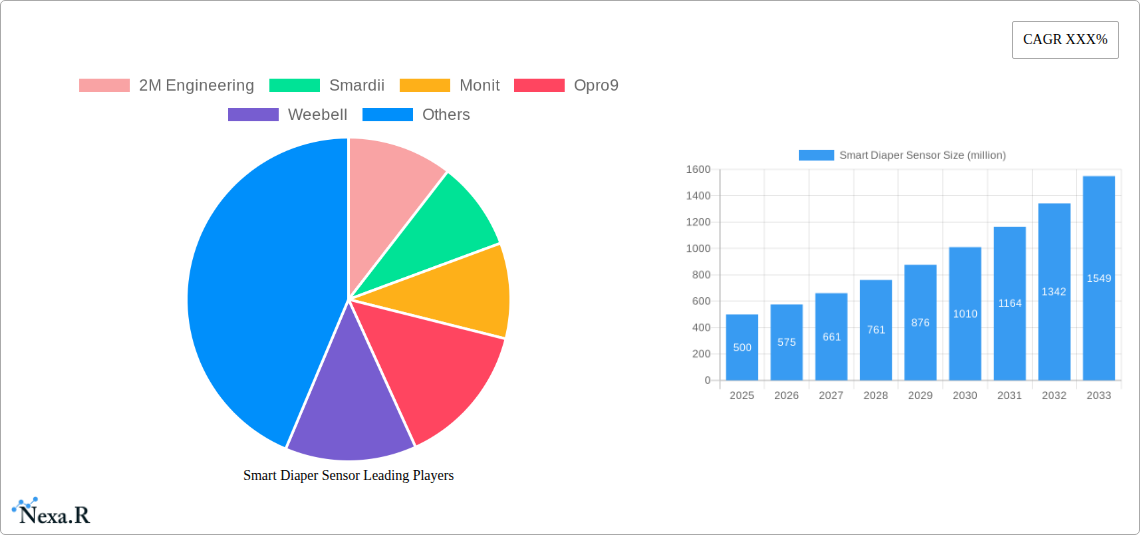
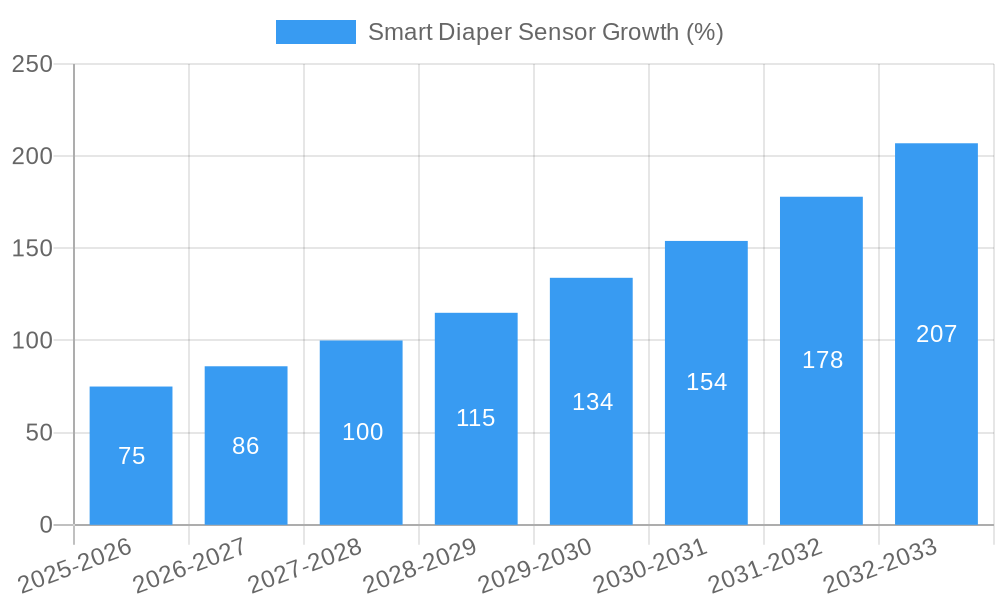
The global smart diaper sensor market is experiencing robust growth, driven by increasing awareness of infant health and hygiene, coupled with technological advancements in sensor technology and data analytics. The market, estimated at $500 million in 2025, is projected to witness a Compound Annual Growth Rate (CAGR) of 15% from 2025 to 2033, reaching approximately $1.8 billion by 2033. Key drivers include the rising demand for remote health monitoring solutions, the increasing adoption of connected devices in healthcare, and the growing preference for convenient and efficient childcare solutions. Market trends indicate a shift towards miniaturization and improved sensor accuracy, along with the integration of smart diaper sensors with mobile applications for real-time data monitoring and analysis. This enables parents and caregivers to proactively address potential health concerns, such as dehydration or urinary tract infections, leading to timely interventions and improved infant well-being. While regulatory hurdles and the relatively high initial cost of smart diaper sensors represent constraints, the market’s long-term growth trajectory remains positive due to continuous innovation and increasing consumer acceptance.
The competitive landscape includes established players like 2M Engineering, Smardii, Monit, Opro9, Weebell, and Renesas, along with emerging companies such as ElderSens and Sinopulsar. These companies are actively engaged in developing innovative sensor technologies, improving data analytics capabilities, and expanding their product portfolios to meet the evolving needs of consumers. Strategic partnerships and collaborations are also playing a significant role in driving market expansion. Future growth will be further fueled by advancements in artificial intelligence (AI) and machine learning (ML), which can enhance data interpretation and provide more personalized insights to healthcare professionals and parents. The integration of smart diaper sensors into broader connected healthcare ecosystems will also contribute significantly to the market's expansion. Regional variations are expected, with North America and Europe leading the market initially, followed by increasing adoption in Asia-Pacific and other regions.
Smart Diaper Sensor Market Report: 2019-2033
This comprehensive report provides a detailed analysis of the global Smart Diaper Sensor market, offering invaluable insights for parents, childcare professionals, industry stakeholders, and investors. The study period covers 2019-2033, with a base year of 2025 and a forecast period of 2025-2033. We delve into market dynamics, growth trends, regional dominance, product innovation, and key players, equipping you with the knowledge to navigate this rapidly evolving market. The market is expected to reach xx million units by 2033.
Smart Diaper Sensor Market Dynamics & Structure
The global smart diaper sensor market is experiencing significant growth driven by technological advancements, increasing parental awareness of infant health, and supportive government initiatives. Market concentration is currently moderate, with several key players vying for dominance. The market exhibits a dynamic landscape, marked by ongoing technological innovation, particularly in sensor miniaturization, data analytics, and wireless connectivity. Stringent regulatory frameworks concerning data privacy and device safety are also shaping the market. Competitive product substitutes, like traditional diaper changing methods, still exist but are facing a decline in popularity.
- Market Concentration: Moderately concentrated, with the top 5 players holding approximately 60% market share in 2025.
- Technological Innovation: Miniaturization of sensors, improved data accuracy, and integration with smart home ecosystems are key drivers.
- Regulatory Frameworks: Growing emphasis on data security and privacy regulations influences market growth.
- Competitive Substitutes: Traditional diaper changing methods, although still present, are steadily losing market share to smart diaper sensors.
- End-User Demographics: Primarily parents of infants and toddlers, with a growing focus on the needs of parents of children with special needs.
- M&A Trends: An estimated xx M&A deals occurred between 2019 and 2024, signifying increasing industry consolidation.
Smart Diaper Sensor Growth Trends & Insights
The smart diaper sensor market is exhibiting robust growth, fueled by increasing disposable incomes, rising awareness of infant health monitoring, and technological advancements that improve sensor accuracy and functionality. The market size witnessed a Compound Annual Growth Rate (CAGR) of xx% during the historical period (2019-2024) and is projected to maintain a CAGR of xx% during the forecast period (2025-2033). This growth is being driven by factors such as the increasing adoption of smart home technologies, improved smartphone integration, and the growing demand for convenient and effective baby care solutions. Market penetration is currently at approximately xx% in developed countries and is expected to reach xx% by 2033. The market shows a significant shift towards subscription-based models for data access and diaper replenishment, boosting recurring revenue streams for manufacturers. Consumer behavior analysis indicates a strong preference for sensors offering real-time alerts, detailed data analysis, and seamless integration with mobile applications.
Dominant Regions, Countries, or Segments in Smart Diaper Sensor
North America currently holds the dominant position in the smart diaper sensor market, driven by high disposable incomes, increased technological adoption rates, and a well-established healthcare infrastructure. Europe follows as a significant market, showcasing substantial growth potential. Asia-Pacific is expected to witness the fastest growth rate, fuelled by a rising middle class, increasing birth rates, and growing adoption of smart technologies.
- North America: High disposable income, technologically advanced healthcare infrastructure, early adoption of smart home technologies.
- Europe: Strong regulatory framework promoting digital health solutions, increasing awareness of child health monitoring.
- Asia-Pacific: Rapidly expanding middle class, increasing birth rates, growing smartphone penetration.
Smart Diaper Sensor Product Landscape
Smart diaper sensors are evolving from basic moisture detection to sophisticated devices that monitor temperature, pH levels, and even bowel movements. These advancements utilize various sensor technologies, including capacitive, electrochemical, and optical sensors, offering enhanced accuracy and a wider range of data points. The unique selling propositions include real-time alerts, remote monitoring capabilities, data-driven insights into infant health, and convenient integration with smartphone applications. Technological improvements focus on miniaturization, enhanced battery life, and improved data security protocols.
Key Drivers, Barriers & Challenges in Smart Diaper Sensor
Key Drivers: Increasing parental concern for infant well-being, technological advancements enhancing sensor accuracy and functionality, rising disposable incomes, supportive government initiatives promoting digital health solutions.
Challenges & Restraints: High initial costs, concerns about data privacy and security, potential for inaccurate readings due to sensor malfunction, limited availability in certain regions, and the need for continuous connectivity for data transmission. Supply chain disruptions could affect manufacturing and device availability, impacting market growth negatively. Regulatory hurdles and stringent certification processes add to the challenge.
Emerging Opportunities in Smart Diaper Sensor
Emerging opportunities lie in expanding into untapped markets, particularly in developing countries. Innovative applications, like integrating smart diaper sensors with predictive analytics to anticipate potential health issues, are expected to drive demand. Evolving consumer preferences towards subscription-based services and personalized health insights present further opportunities. Development of sensors for children with specific health needs (e.g., diabetes, urinary tract infections) will also be an important growth avenue.
Growth Accelerators in the Smart Diaper Sensor Industry
Strategic partnerships between sensor manufacturers, diaper brands, and healthcare providers are crucial for market expansion. Technological breakthroughs in sensor miniaturization, advanced data analytics, and improved wireless connectivity will act as significant growth catalysts. Government incentives and healthcare policies that promote digital health adoption will further stimulate market expansion.
Key Players Shaping the Smart Diaper Sensor Market
- 2M Engineering
- Smardii
- Monit
- Opro9
- Weebell
- Renesas
- ElderSens
- Sinopulsar
Notable Milestones in Smart Diaper Sensor Sector
- 2020: Launch of the first commercially available smart diaper sensor with integrated temperature monitoring (Company X).
- 2022: Introduction of a subscription-based data analytics platform (Company Y).
- 2023: FDA approval of a smart diaper sensor for use in hospitals (Company Z).
In-Depth Smart Diaper Sensor Market Outlook
The smart diaper sensor market is poised for continued robust growth, driven by technological advancements, expanding market penetration, and increasing consumer awareness. Strategic partnerships, innovative product development, and effective marketing strategies will be crucial for success in this dynamic market. The long-term outlook remains positive, with substantial potential for market expansion in both developed and developing countries.
Smart Diaper Sensor Segmentation
-
1. Application
- 1.1. Neonates and Babies
- 1.2. Adults
-
2. Type
- 2.1. Humidity Sensor
- 2.2. Temperature Sensor
- 2.3. Pressure Sensor
Smart Diaper Sensor Segmentation By Geography
-
1. North America
- 1.1. United States
- 1.2. Canada
- 1.3. Mexico
-
2. South America
- 2.1. Brazil
- 2.2. Argentina
- 2.3. Rest of South America
-
3. Europe
- 3.1. United Kingdom
- 3.2. Germany
- 3.3. France
- 3.4. Italy
- 3.5. Spain
- 3.6. Russia
- 3.7. Benelux
- 3.8. Nordics
- 3.9. Rest of Europe
-
4. Middle East & Africa
- 4.1. Turkey
- 4.2. Israel
- 4.3. GCC
- 4.4. North Africa
- 4.5. South Africa
- 4.6. Rest of Middle East & Africa
-
5. Asia Pacific
- 5.1. China
- 5.2. India
- 5.3. Japan
- 5.4. South Korea
- 5.5. ASEAN
- 5.6. Oceania
- 5.7. Rest of Asia Pacific

Smart Diaper Sensor REPORT HIGHLIGHTS
| Aspects | Details |
|---|---|
| Study Period | 2019-2033 |
| Base Year | 2024 |
| Estimated Year | 2025 |
| Forecast Period | 2025-2033 |
| Historical Period | 2019-2024 |
| Growth Rate | CAGR of XXX% from 2019-2033 |
| Segmentation |
|
Table of Contents
- 1. Introduction
- 1.1. Research Scope
- 1.2. Market Segmentation
- 1.3. Research Methodology
- 1.4. Definitions and Assumptions
- 2. Executive Summary
- 2.1. Introduction
- 3. Market Dynamics
- 3.1. Introduction
- 3.2. Market Drivers
- 3.3. Market Restrains
- 3.4. Market Trends
- 4. Market Factor Analysis
- 4.1. Porters Five Forces
- 4.2. Supply/Value Chain
- 4.3. PESTEL analysis
- 4.4. Market Entropy
- 4.5. Patent/Trademark Analysis
- 5. Global Smart Diaper Sensor Analysis, Insights and Forecast, 2019-2031
- 5.1. Market Analysis, Insights and Forecast - by Application
- 5.1.1. Neonates and Babies
- 5.1.2. Adults
- 5.2. Market Analysis, Insights and Forecast - by Type
- 5.2.1. Humidity Sensor
- 5.2.2. Temperature Sensor
- 5.2.3. Pressure Sensor
- 5.3. Market Analysis, Insights and Forecast - by Region
- 5.3.1. North America
- 5.3.2. South America
- 5.3.3. Europe
- 5.3.4. Middle East & Africa
- 5.3.5. Asia Pacific
- 5.1. Market Analysis, Insights and Forecast - by Application
- 6. North America Smart Diaper Sensor Analysis, Insights and Forecast, 2019-2031
- 6.1. Market Analysis, Insights and Forecast - by Application
- 6.1.1. Neonates and Babies
- 6.1.2. Adults
- 6.2. Market Analysis, Insights and Forecast - by Type
- 6.2.1. Humidity Sensor
- 6.2.2. Temperature Sensor
- 6.2.3. Pressure Sensor
- 6.1. Market Analysis, Insights and Forecast - by Application
- 7. South America Smart Diaper Sensor Analysis, Insights and Forecast, 2019-2031
- 7.1. Market Analysis, Insights and Forecast - by Application
- 7.1.1. Neonates and Babies
- 7.1.2. Adults
- 7.2. Market Analysis, Insights and Forecast - by Type
- 7.2.1. Humidity Sensor
- 7.2.2. Temperature Sensor
- 7.2.3. Pressure Sensor
- 7.1. Market Analysis, Insights and Forecast - by Application
- 8. Europe Smart Diaper Sensor Analysis, Insights and Forecast, 2019-2031
- 8.1. Market Analysis, Insights and Forecast - by Application
- 8.1.1. Neonates and Babies
- 8.1.2. Adults
- 8.2. Market Analysis, Insights and Forecast - by Type
- 8.2.1. Humidity Sensor
- 8.2.2. Temperature Sensor
- 8.2.3. Pressure Sensor
- 8.1. Market Analysis, Insights and Forecast - by Application
- 9. Middle East & Africa Smart Diaper Sensor Analysis, Insights and Forecast, 2019-2031
- 9.1. Market Analysis, Insights and Forecast - by Application
- 9.1.1. Neonates and Babies
- 9.1.2. Adults
- 9.2. Market Analysis, Insights and Forecast - by Type
- 9.2.1. Humidity Sensor
- 9.2.2. Temperature Sensor
- 9.2.3. Pressure Sensor
- 9.1. Market Analysis, Insights and Forecast - by Application
- 10. Asia Pacific Smart Diaper Sensor Analysis, Insights and Forecast, 2019-2031
- 10.1. Market Analysis, Insights and Forecast - by Application
- 10.1.1. Neonates and Babies
- 10.1.2. Adults
- 10.2. Market Analysis, Insights and Forecast - by Type
- 10.2.1. Humidity Sensor
- 10.2.2. Temperature Sensor
- 10.2.3. Pressure Sensor
- 10.1. Market Analysis, Insights and Forecast - by Application
- 11. Competitive Analysis
- 11.1. Global Market Share Analysis 2024
- 11.2. Company Profiles
- 11.2.1 2M Engineering
- 11.2.1.1. Overview
- 11.2.1.2. Products
- 11.2.1.3. SWOT Analysis
- 11.2.1.4. Recent Developments
- 11.2.1.5. Financials (Based on Availability)
- 11.2.2 Smardii
- 11.2.2.1. Overview
- 11.2.2.2. Products
- 11.2.2.3. SWOT Analysis
- 11.2.2.4. Recent Developments
- 11.2.2.5. Financials (Based on Availability)
- 11.2.3 Monit
- 11.2.3.1. Overview
- 11.2.3.2. Products
- 11.2.3.3. SWOT Analysis
- 11.2.3.4. Recent Developments
- 11.2.3.5. Financials (Based on Availability)
- 11.2.4 Opro9
- 11.2.4.1. Overview
- 11.2.4.2. Products
- 11.2.4.3. SWOT Analysis
- 11.2.4.4. Recent Developments
- 11.2.4.5. Financials (Based on Availability)
- 11.2.5 Weebell
- 11.2.5.1. Overview
- 11.2.5.2. Products
- 11.2.5.3. SWOT Analysis
- 11.2.5.4. Recent Developments
- 11.2.5.5. Financials (Based on Availability)
- 11.2.6 Renesas
- 11.2.6.1. Overview
- 11.2.6.2. Products
- 11.2.6.3. SWOT Analysis
- 11.2.6.4. Recent Developments
- 11.2.6.5. Financials (Based on Availability)
- 11.2.7 ElderSens
- 11.2.7.1. Overview
- 11.2.7.2. Products
- 11.2.7.3. SWOT Analysis
- 11.2.7.4. Recent Developments
- 11.2.7.5. Financials (Based on Availability)
- 11.2.8 Sinopulsar
- 11.2.8.1. Overview
- 11.2.8.2. Products
- 11.2.8.3. SWOT Analysis
- 11.2.8.4. Recent Developments
- 11.2.8.5. Financials (Based on Availability)
- 11.2.1 2M Engineering
List of Figures
- Figure 1: Global Smart Diaper Sensor Revenue Breakdown (million, %) by Region 2024 & 2032
- Figure 2: Global Smart Diaper Sensor Volume Breakdown (K, %) by Region 2024 & 2032
- Figure 3: North America Smart Diaper Sensor Revenue (million), by Application 2024 & 2032
- Figure 4: North America Smart Diaper Sensor Volume (K), by Application 2024 & 2032
- Figure 5: North America Smart Diaper Sensor Revenue Share (%), by Application 2024 & 2032
- Figure 6: North America Smart Diaper Sensor Volume Share (%), by Application 2024 & 2032
- Figure 7: North America Smart Diaper Sensor Revenue (million), by Type 2024 & 2032
- Figure 8: North America Smart Diaper Sensor Volume (K), by Type 2024 & 2032
- Figure 9: North America Smart Diaper Sensor Revenue Share (%), by Type 2024 & 2032
- Figure 10: North America Smart Diaper Sensor Volume Share (%), by Type 2024 & 2032
- Figure 11: North America Smart Diaper Sensor Revenue (million), by Country 2024 & 2032
- Figure 12: North America Smart Diaper Sensor Volume (K), by Country 2024 & 2032
- Figure 13: North America Smart Diaper Sensor Revenue Share (%), by Country 2024 & 2032
- Figure 14: North America Smart Diaper Sensor Volume Share (%), by Country 2024 & 2032
- Figure 15: South America Smart Diaper Sensor Revenue (million), by Application 2024 & 2032
- Figure 16: South America Smart Diaper Sensor Volume (K), by Application 2024 & 2032
- Figure 17: South America Smart Diaper Sensor Revenue Share (%), by Application 2024 & 2032
- Figure 18: South America Smart Diaper Sensor Volume Share (%), by Application 2024 & 2032
- Figure 19: South America Smart Diaper Sensor Revenue (million), by Type 2024 & 2032
- Figure 20: South America Smart Diaper Sensor Volume (K), by Type 2024 & 2032
- Figure 21: South America Smart Diaper Sensor Revenue Share (%), by Type 2024 & 2032
- Figure 22: South America Smart Diaper Sensor Volume Share (%), by Type 2024 & 2032
- Figure 23: South America Smart Diaper Sensor Revenue (million), by Country 2024 & 2032
- Figure 24: South America Smart Diaper Sensor Volume (K), by Country 2024 & 2032
- Figure 25: South America Smart Diaper Sensor Revenue Share (%), by Country 2024 & 2032
- Figure 26: South America Smart Diaper Sensor Volume Share (%), by Country 2024 & 2032
- Figure 27: Europe Smart Diaper Sensor Revenue (million), by Application 2024 & 2032
- Figure 28: Europe Smart Diaper Sensor Volume (K), by Application 2024 & 2032
- Figure 29: Europe Smart Diaper Sensor Revenue Share (%), by Application 2024 & 2032
- Figure 30: Europe Smart Diaper Sensor Volume Share (%), by Application 2024 & 2032
- Figure 31: Europe Smart Diaper Sensor Revenue (million), by Type 2024 & 2032
- Figure 32: Europe Smart Diaper Sensor Volume (K), by Type 2024 & 2032
- Figure 33: Europe Smart Diaper Sensor Revenue Share (%), by Type 2024 & 2032
- Figure 34: Europe Smart Diaper Sensor Volume Share (%), by Type 2024 & 2032
- Figure 35: Europe Smart Diaper Sensor Revenue (million), by Country 2024 & 2032
- Figure 36: Europe Smart Diaper Sensor Volume (K), by Country 2024 & 2032
- Figure 37: Europe Smart Diaper Sensor Revenue Share (%), by Country 2024 & 2032
- Figure 38: Europe Smart Diaper Sensor Volume Share (%), by Country 2024 & 2032
- Figure 39: Middle East & Africa Smart Diaper Sensor Revenue (million), by Application 2024 & 2032
- Figure 40: Middle East & Africa Smart Diaper Sensor Volume (K), by Application 2024 & 2032
- Figure 41: Middle East & Africa Smart Diaper Sensor Revenue Share (%), by Application 2024 & 2032
- Figure 42: Middle East & Africa Smart Diaper Sensor Volume Share (%), by Application 2024 & 2032
- Figure 43: Middle East & Africa Smart Diaper Sensor Revenue (million), by Type 2024 & 2032
- Figure 44: Middle East & Africa Smart Diaper Sensor Volume (K), by Type 2024 & 2032
- Figure 45: Middle East & Africa Smart Diaper Sensor Revenue Share (%), by Type 2024 & 2032
- Figure 46: Middle East & Africa Smart Diaper Sensor Volume Share (%), by Type 2024 & 2032
- Figure 47: Middle East & Africa Smart Diaper Sensor Revenue (million), by Country 2024 & 2032
- Figure 48: Middle East & Africa Smart Diaper Sensor Volume (K), by Country 2024 & 2032
- Figure 49: Middle East & Africa Smart Diaper Sensor Revenue Share (%), by Country 2024 & 2032
- Figure 50: Middle East & Africa Smart Diaper Sensor Volume Share (%), by Country 2024 & 2032
- Figure 51: Asia Pacific Smart Diaper Sensor Revenue (million), by Application 2024 & 2032
- Figure 52: Asia Pacific Smart Diaper Sensor Volume (K), by Application 2024 & 2032
- Figure 53: Asia Pacific Smart Diaper Sensor Revenue Share (%), by Application 2024 & 2032
- Figure 54: Asia Pacific Smart Diaper Sensor Volume Share (%), by Application 2024 & 2032
- Figure 55: Asia Pacific Smart Diaper Sensor Revenue (million), by Type 2024 & 2032
- Figure 56: Asia Pacific Smart Diaper Sensor Volume (K), by Type 2024 & 2032
- Figure 57: Asia Pacific Smart Diaper Sensor Revenue Share (%), by Type 2024 & 2032
- Figure 58: Asia Pacific Smart Diaper Sensor Volume Share (%), by Type 2024 & 2032
- Figure 59: Asia Pacific Smart Diaper Sensor Revenue (million), by Country 2024 & 2032
- Figure 60: Asia Pacific Smart Diaper Sensor Volume (K), by Country 2024 & 2032
- Figure 61: Asia Pacific Smart Diaper Sensor Revenue Share (%), by Country 2024 & 2032
- Figure 62: Asia Pacific Smart Diaper Sensor Volume Share (%), by Country 2024 & 2032
List of Tables
- Table 1: Global Smart Diaper Sensor Revenue million Forecast, by Region 2019 & 2032
- Table 2: Global Smart Diaper Sensor Volume K Forecast, by Region 2019 & 2032
- Table 3: Global Smart Diaper Sensor Revenue million Forecast, by Application 2019 & 2032
- Table 4: Global Smart Diaper Sensor Volume K Forecast, by Application 2019 & 2032
- Table 5: Global Smart Diaper Sensor Revenue million Forecast, by Type 2019 & 2032
- Table 6: Global Smart Diaper Sensor Volume K Forecast, by Type 2019 & 2032
- Table 7: Global Smart Diaper Sensor Revenue million Forecast, by Region 2019 & 2032
- Table 8: Global Smart Diaper Sensor Volume K Forecast, by Region 2019 & 2032
- Table 9: Global Smart Diaper Sensor Revenue million Forecast, by Application 2019 & 2032
- Table 10: Global Smart Diaper Sensor Volume K Forecast, by Application 2019 & 2032
- Table 11: Global Smart Diaper Sensor Revenue million Forecast, by Type 2019 & 2032
- Table 12: Global Smart Diaper Sensor Volume K Forecast, by Type 2019 & 2032
- Table 13: Global Smart Diaper Sensor Revenue million Forecast, by Country 2019 & 2032
- Table 14: Global Smart Diaper Sensor Volume K Forecast, by Country 2019 & 2032
- Table 15: United States Smart Diaper Sensor Revenue (million) Forecast, by Application 2019 & 2032
- Table 16: United States Smart Diaper Sensor Volume (K) Forecast, by Application 2019 & 2032
- Table 17: Canada Smart Diaper Sensor Revenue (million) Forecast, by Application 2019 & 2032
- Table 18: Canada Smart Diaper Sensor Volume (K) Forecast, by Application 2019 & 2032
- Table 19: Mexico Smart Diaper Sensor Revenue (million) Forecast, by Application 2019 & 2032
- Table 20: Mexico Smart Diaper Sensor Volume (K) Forecast, by Application 2019 & 2032
- Table 21: Global Smart Diaper Sensor Revenue million Forecast, by Application 2019 & 2032
- Table 22: Global Smart Diaper Sensor Volume K Forecast, by Application 2019 & 2032
- Table 23: Global Smart Diaper Sensor Revenue million Forecast, by Type 2019 & 2032
- Table 24: Global Smart Diaper Sensor Volume K Forecast, by Type 2019 & 2032
- Table 25: Global Smart Diaper Sensor Revenue million Forecast, by Country 2019 & 2032
- Table 26: Global Smart Diaper Sensor Volume K Forecast, by Country 2019 & 2032
- Table 27: Brazil Smart Diaper Sensor Revenue (million) Forecast, by Application 2019 & 2032
- Table 28: Brazil Smart Diaper Sensor Volume (K) Forecast, by Application 2019 & 2032
- Table 29: Argentina Smart Diaper Sensor Revenue (million) Forecast, by Application 2019 & 2032
- Table 30: Argentina Smart Diaper Sensor Volume (K) Forecast, by Application 2019 & 2032
- Table 31: Rest of South America Smart Diaper Sensor Revenue (million) Forecast, by Application 2019 & 2032
- Table 32: Rest of South America Smart Diaper Sensor Volume (K) Forecast, by Application 2019 & 2032
- Table 33: Global Smart Diaper Sensor Revenue million Forecast, by Application 2019 & 2032
- Table 34: Global Smart Diaper Sensor Volume K Forecast, by Application 2019 & 2032
- Table 35: Global Smart Diaper Sensor Revenue million Forecast, by Type 2019 & 2032
- Table 36: Global Smart Diaper Sensor Volume K Forecast, by Type 2019 & 2032
- Table 37: Global Smart Diaper Sensor Revenue million Forecast, by Country 2019 & 2032
- Table 38: Global Smart Diaper Sensor Volume K Forecast, by Country 2019 & 2032
- Table 39: United Kingdom Smart Diaper Sensor Revenue (million) Forecast, by Application 2019 & 2032
- Table 40: United Kingdom Smart Diaper Sensor Volume (K) Forecast, by Application 2019 & 2032
- Table 41: Germany Smart Diaper Sensor Revenue (million) Forecast, by Application 2019 & 2032
- Table 42: Germany Smart Diaper Sensor Volume (K) Forecast, by Application 2019 & 2032
- Table 43: France Smart Diaper Sensor Revenue (million) Forecast, by Application 2019 & 2032
- Table 44: France Smart Diaper Sensor Volume (K) Forecast, by Application 2019 & 2032
- Table 45: Italy Smart Diaper Sensor Revenue (million) Forecast, by Application 2019 & 2032
- Table 46: Italy Smart Diaper Sensor Volume (K) Forecast, by Application 2019 & 2032
- Table 47: Spain Smart Diaper Sensor Revenue (million) Forecast, by Application 2019 & 2032
- Table 48: Spain Smart Diaper Sensor Volume (K) Forecast, by Application 2019 & 2032
- Table 49: Russia Smart Diaper Sensor Revenue (million) Forecast, by Application 2019 & 2032
- Table 50: Russia Smart Diaper Sensor Volume (K) Forecast, by Application 2019 & 2032
- Table 51: Benelux Smart Diaper Sensor Revenue (million) Forecast, by Application 2019 & 2032
- Table 52: Benelux Smart Diaper Sensor Volume (K) Forecast, by Application 2019 & 2032
- Table 53: Nordics Smart Diaper Sensor Revenue (million) Forecast, by Application 2019 & 2032
- Table 54: Nordics Smart Diaper Sensor Volume (K) Forecast, by Application 2019 & 2032
- Table 55: Rest of Europe Smart Diaper Sensor Revenue (million) Forecast, by Application 2019 & 2032
- Table 56: Rest of Europe Smart Diaper Sensor Volume (K) Forecast, by Application 2019 & 2032
- Table 57: Global Smart Diaper Sensor Revenue million Forecast, by Application 2019 & 2032
- Table 58: Global Smart Diaper Sensor Volume K Forecast, by Application 2019 & 2032
- Table 59: Global Smart Diaper Sensor Revenue million Forecast, by Type 2019 & 2032
- Table 60: Global Smart Diaper Sensor Volume K Forecast, by Type 2019 & 2032
- Table 61: Global Smart Diaper Sensor Revenue million Forecast, by Country 2019 & 2032
- Table 62: Global Smart Diaper Sensor Volume K Forecast, by Country 2019 & 2032
- Table 63: Turkey Smart Diaper Sensor Revenue (million) Forecast, by Application 2019 & 2032
- Table 64: Turkey Smart Diaper Sensor Volume (K) Forecast, by Application 2019 & 2032
- Table 65: Israel Smart Diaper Sensor Revenue (million) Forecast, by Application 2019 & 2032
- Table 66: Israel Smart Diaper Sensor Volume (K) Forecast, by Application 2019 & 2032
- Table 67: GCC Smart Diaper Sensor Revenue (million) Forecast, by Application 2019 & 2032
- Table 68: GCC Smart Diaper Sensor Volume (K) Forecast, by Application 2019 & 2032
- Table 69: North Africa Smart Diaper Sensor Revenue (million) Forecast, by Application 2019 & 2032
- Table 70: North Africa Smart Diaper Sensor Volume (K) Forecast, by Application 2019 & 2032
- Table 71: South Africa Smart Diaper Sensor Revenue (million) Forecast, by Application 2019 & 2032
- Table 72: South Africa Smart Diaper Sensor Volume (K) Forecast, by Application 2019 & 2032
- Table 73: Rest of Middle East & Africa Smart Diaper Sensor Revenue (million) Forecast, by Application 2019 & 2032
- Table 74: Rest of Middle East & Africa Smart Diaper Sensor Volume (K) Forecast, by Application 2019 & 2032
- Table 75: Global Smart Diaper Sensor Revenue million Forecast, by Application 2019 & 2032
- Table 76: Global Smart Diaper Sensor Volume K Forecast, by Application 2019 & 2032
- Table 77: Global Smart Diaper Sensor Revenue million Forecast, by Type 2019 & 2032
- Table 78: Global Smart Diaper Sensor Volume K Forecast, by Type 2019 & 2032
- Table 79: Global Smart Diaper Sensor Revenue million Forecast, by Country 2019 & 2032
- Table 80: Global Smart Diaper Sensor Volume K Forecast, by Country 2019 & 2032
- Table 81: China Smart Diaper Sensor Revenue (million) Forecast, by Application 2019 & 2032
- Table 82: China Smart Diaper Sensor Volume (K) Forecast, by Application 2019 & 2032
- Table 83: India Smart Diaper Sensor Revenue (million) Forecast, by Application 2019 & 2032
- Table 84: India Smart Diaper Sensor Volume (K) Forecast, by Application 2019 & 2032
- Table 85: Japan Smart Diaper Sensor Revenue (million) Forecast, by Application 2019 & 2032
- Table 86: Japan Smart Diaper Sensor Volume (K) Forecast, by Application 2019 & 2032
- Table 87: South Korea Smart Diaper Sensor Revenue (million) Forecast, by Application 2019 & 2032
- Table 88: South Korea Smart Diaper Sensor Volume (K) Forecast, by Application 2019 & 2032
- Table 89: ASEAN Smart Diaper Sensor Revenue (million) Forecast, by Application 2019 & 2032
- Table 90: ASEAN Smart Diaper Sensor Volume (K) Forecast, by Application 2019 & 2032
- Table 91: Oceania Smart Diaper Sensor Revenue (million) Forecast, by Application 2019 & 2032
- Table 92: Oceania Smart Diaper Sensor Volume (K) Forecast, by Application 2019 & 2032
- Table 93: Rest of Asia Pacific Smart Diaper Sensor Revenue (million) Forecast, by Application 2019 & 2032
- Table 94: Rest of Asia Pacific Smart Diaper Sensor Volume (K) Forecast, by Application 2019 & 2032
Frequently Asked Questions
1. What is the projected Compound Annual Growth Rate (CAGR) of the Smart Diaper Sensor?
The projected CAGR is approximately XXX%.
2. Which companies are prominent players in the Smart Diaper Sensor?
Key companies in the market include 2M Engineering, Smardii, Monit, Opro9, Weebell, Renesas, ElderSens, Sinopulsar.
3. What are the main segments of the Smart Diaper Sensor?
The market segments include Application, Type.
4. Can you provide details about the market size?
The market size is estimated to be USD XXX million as of 2022.
5. What are some drivers contributing to market growth?
N/A
6. What are the notable trends driving market growth?
N/A
7. Are there any restraints impacting market growth?
N/A
8. Can you provide examples of recent developments in the market?
N/A
9. What pricing options are available for accessing the report?
Pricing options include single-user, multi-user, and enterprise licenses priced at USD 3950.00, USD 5925.00, and USD 7900.00 respectively.
10. Is the market size provided in terms of value or volume?
The market size is provided in terms of value, measured in million and volume, measured in K.
11. Are there any specific market keywords associated with the report?
Yes, the market keyword associated with the report is "Smart Diaper Sensor," which aids in identifying and referencing the specific market segment covered.
12. How do I determine which pricing option suits my needs best?
The pricing options vary based on user requirements and access needs. Individual users may opt for single-user licenses, while businesses requiring broader access may choose multi-user or enterprise licenses for cost-effective access to the report.
13. Are there any additional resources or data provided in the Smart Diaper Sensor report?
While the report offers comprehensive insights, it's advisable to review the specific contents or supplementary materials provided to ascertain if additional resources or data are available.
14. How can I stay updated on further developments or reports in the Smart Diaper Sensor?
To stay informed about further developments, trends, and reports in the Smart Diaper Sensor, consider subscribing to industry newsletters, following relevant companies and organizations, or regularly checking reputable industry news sources and publications.
Methodology
Step 1 - Identification of Relevant Samples Size from Population Database


Step 2 - Approaches for Defining Global Market Size (Value, Volume* & Price*)

Note*: In applicable scenarios
Step 3 - Data Sources
Primary Research
- Web Analytics
- Survey Reports
- Research Institute
- Latest Research Reports
- Opinion Leaders
Secondary Research
- Annual Reports
- White Paper
- Latest Press Release
- Industry Association
- Paid Database
- Investor Presentations

Step 4 - Data Triangulation
Involves using different sources of information in order to increase the validity of a study
These sources are likely to be stakeholders in a program - participants, other researchers, program staff, other community members, and so on.
Then we put all data in single framework & apply various statistical tools to find out the dynamic on the market.
During the analysis stage, feedback from the stakeholder groups would be compared to determine areas of agreement as well as areas of divergence
