

Key Insights
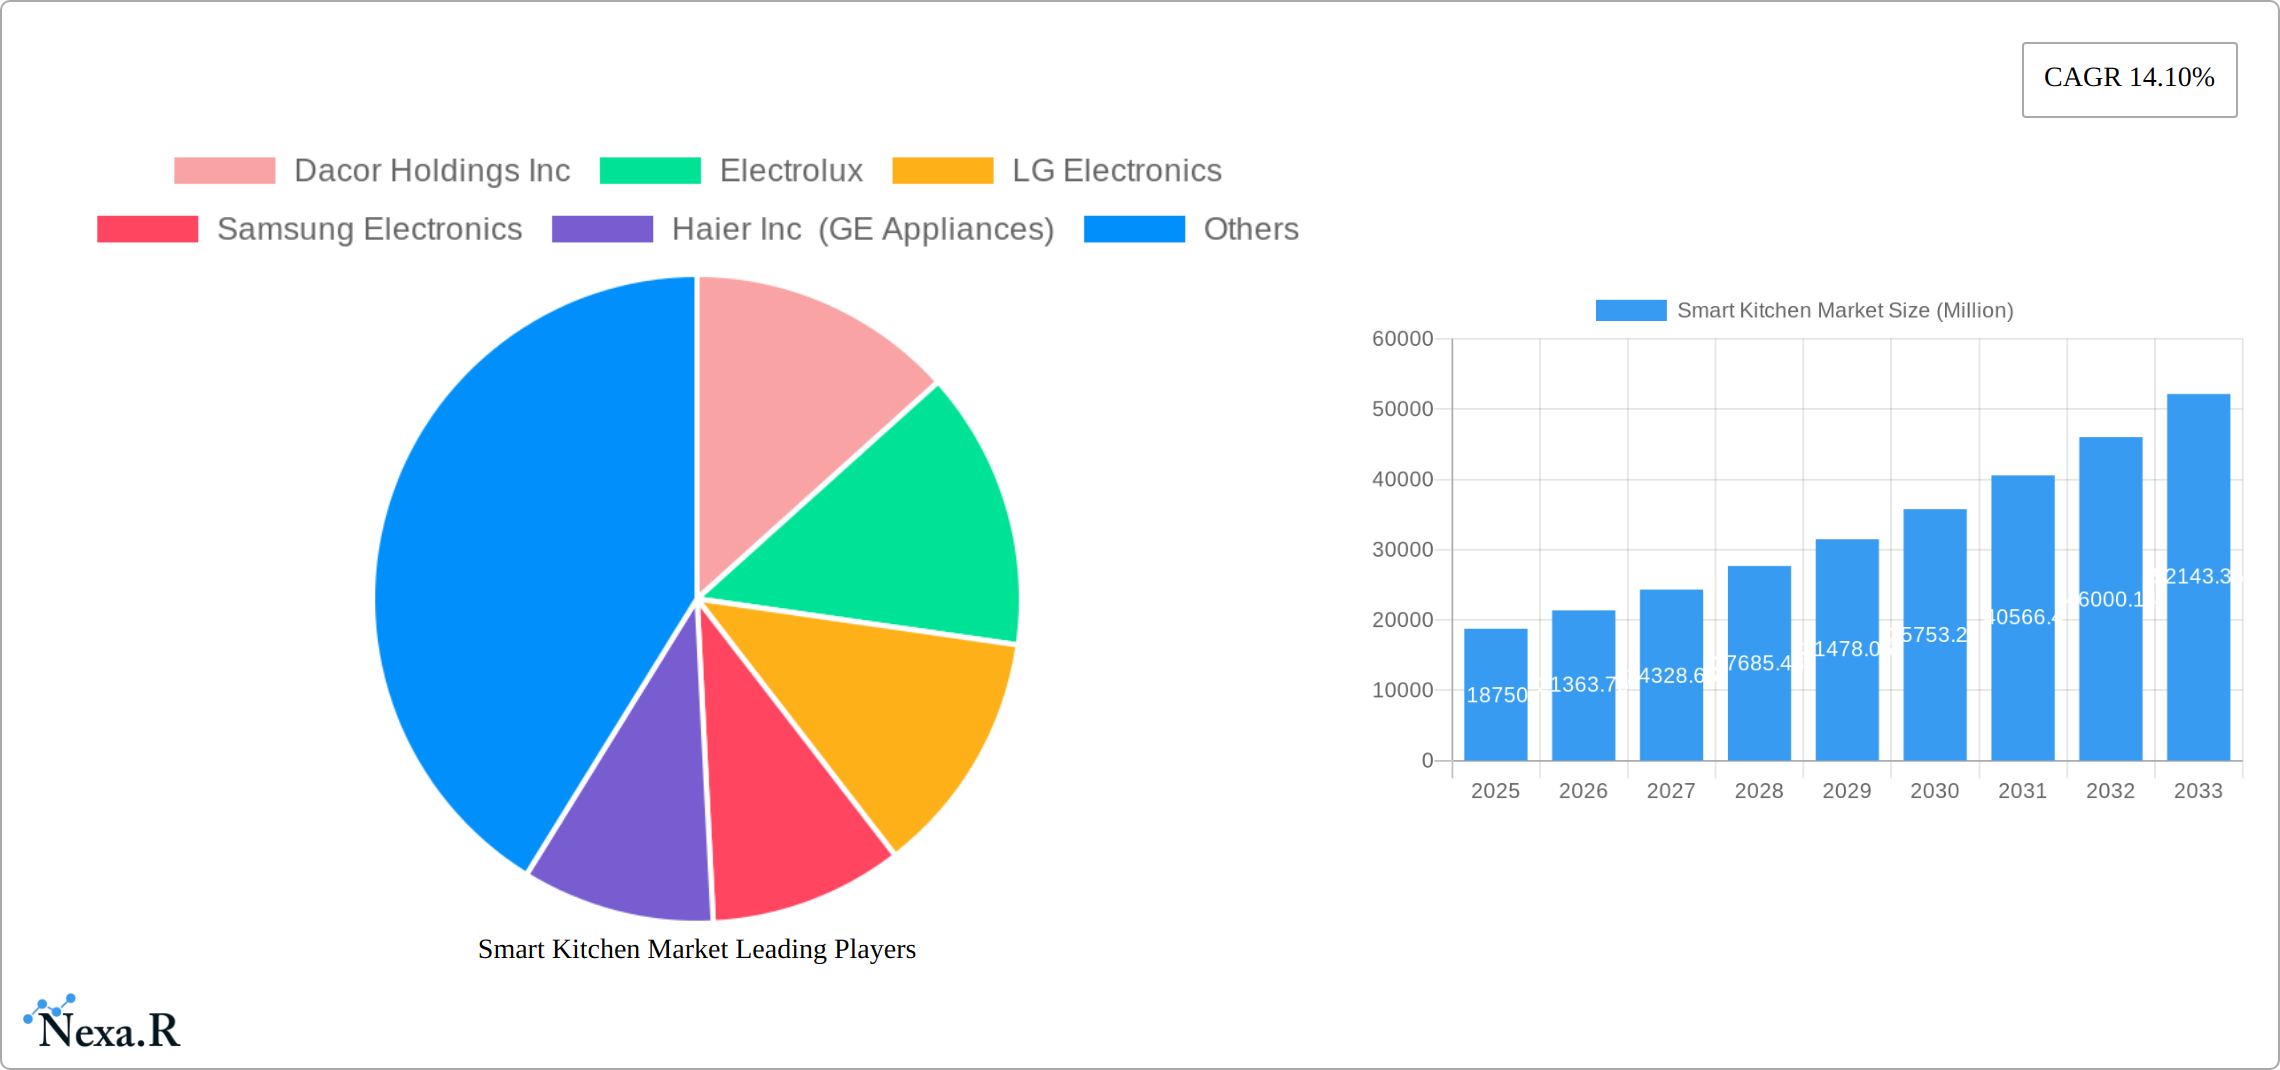
The smart kitchen market, valued at $18.75 billion in 2025, is experiencing robust growth, projected to expand at a Compound Annual Growth Rate (CAGR) of 14.10% from 2025 to 2033. This significant expansion is driven by several key factors. Increasing consumer demand for convenience and efficiency in the kitchen, coupled with technological advancements in smart appliances and integration capabilities, are major catalysts. The rise of connected homes and the proliferation of smart home ecosystems are further fueling market growth. Consumers are increasingly drawn to features such as remote appliance control, automated cooking functions, and intelligent inventory management systems. Furthermore, the growing adoption of voice assistants and the integration of artificial intelligence (AI) in kitchen appliances are enhancing the user experience and driving demand. Competition within the market is fierce, with major players like Whirlpool, Samsung, LG, and others continuously innovating to offer advanced features and competitive pricing. However, challenges remain, including concerns about data privacy, cybersecurity vulnerabilities, and the high initial cost of implementing smart kitchen solutions.
Despite these challenges, the long-term outlook for the smart kitchen market remains highly positive. The continued convergence of technology and culinary practices, along with ongoing improvements in affordability and accessibility, are expected to drive market penetration across various demographics. The market is segmented by appliance type (refrigerators, ovens, cooktops, dishwashers, etc.), functionality (connectivity, automation, AI integration), and price point, allowing for tailored product offerings to meet diverse consumer needs. Regional variations in adoption rates are expected, with developed markets exhibiting higher initial penetration, followed by a gradual increase in emerging economies as technology becomes more affordable. Strategic partnerships and acquisitions within the industry will further shape the market landscape, leading to increased innovation and competition.
Smart Kitchen Market Report: 2019-2033
This comprehensive report provides an in-depth analysis of the Smart Kitchen market, encompassing market dynamics, growth trends, regional dominance, product landscapes, and key players shaping the industry's future. The report covers the period 2019-2033, with a focus on the forecast period 2025-2033, using 2025 as the base year. The study segments the market to provide a granular understanding of its evolution and future potential. This report is ideal for industry professionals, investors, and anyone seeking a strategic understanding of the burgeoning Smart Kitchen market.
Smart Kitchen Market Dynamics & Structure
The Smart Kitchen market, a child segment of the broader Smart Home market, is experiencing robust growth driven by technological advancements and evolving consumer preferences. Market concentration is moderate, with key players such as Electrolux, LG Electronics, Samsung Electronics, and Whirlpool Corporation holding significant market share, estimated at xx% collectively in 2025. However, smaller innovative companies like Brava Home Inc and Cosori are making inroads with niche offerings.
- Market Concentration: Moderate, with top players holding xx% market share in 2025.
- Technological Innovation: AI-driven cooking assistants, smart appliances integration, and improved connectivity are key drivers.
- Regulatory Frameworks: Varying regulations across geographies impact market growth; standardization efforts are crucial.
- Competitive Substitutes: Traditional kitchen appliances represent a primary competitive substitute.
- End-User Demographics: High-income households and tech-savvy consumers are the primary adopters.
- M&A Trends: Consolidation is expected to increase as larger players seek to expand their portfolios and technological capabilities. An estimated xx M&A deals were recorded between 2019 and 2024. Innovation barriers include high R&D costs and the complexity of integrating different smart devices seamlessly.
Smart Kitchen Market Growth Trends & Insights
The Smart Kitchen market is experiencing significant and accelerating growth, poised to reshape home environments. The market size is estimated to reach xx million units by 2025. Propelled by a robust Compound Annual Growth Rate (CAGR) of xx% throughout the forecast period (2025-2033), this expansion is fundamentally driven by consumers actively seeking enhanced convenience, superior efficiency, and highly personalized culinary experiences. Cutting-edge technological advancements, particularly the seamless integration of Artificial Intelligence (AI) and the Internet of Things (IoT), are acting as powerful catalysts, accelerating market growth at an unprecedented pace. Furthermore, evolving consumer behaviors, characterized by a growing emphasis on healthier eating habits and a burgeoning demand for integrated smart home solutions, are significantly fueling this upward trajectory. While market penetration currently stands at xx% in key developed regions, it is projected to surge to an impressive xx% by 2033, signifying a substantial shift in consumer adoption. A critical trend underpinning this growth is the increasing interconnectedness of smart kitchen appliances with broader smart home ecosystems, thereby amplifying the value proposition for consumers and fostering greater adoption. The market value of smart kitchen products has demonstrated consistent and strong appreciation between 2019 and 2024, a clear indicator of robust market health. Additionally, the emergence and growing adoption of subscription-based services for personalized recipes and proactive maintenance are further contributing to the overall expansion of market value.
Dominant Regions, Countries, or Segments in Smart Kitchen Market
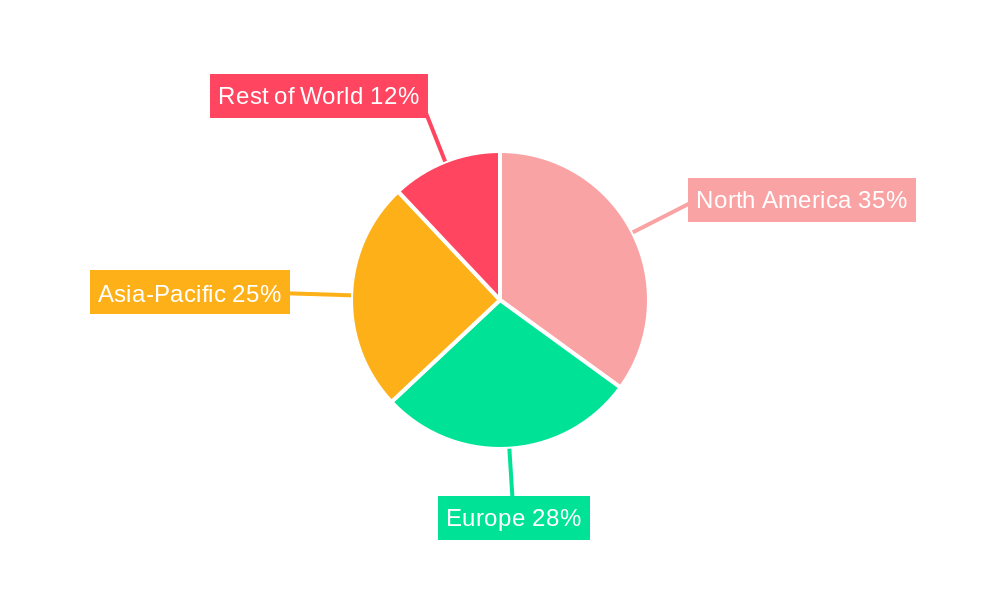
North America currently leads the Smart Kitchen market, a position bolstered by high consumer disposable incomes, a well-established culture of early smart home technology adoption, and a robust supporting infrastructure. Europe represents another significant market, exhibiting steady and consistent growth. The Asia-Pacific region, however, is rapidly emerging as a powerhouse of expansion, driven by its vast population and burgeoning middle class. Within the diverse product landscape, smart refrigerators and ovens consistently hold the largest market segments, reflecting their high consumer demand and perceived value. These appliances are often seen as the gateway into the smart kitchen ecosystem for many households.
- North America: Dominance is sustained by high adoption rates of smart home technologies, a strong existing infrastructure, and significantly high levels of consumer disposable income.
- Europe: The market is experiencing steady growth, primarily driven by increasing consumer awareness and acceptance of smart home technologies, coupled with a focus on energy efficiency.
- Asia-Pacific: This region is characterized by rapid expansion, fueled by a growing middle class, rising disposable incomes, and accelerating urbanization, leading to increased demand for modern home solutions.
- Key Drivers: Sustained growth is underpinned by strong underlying consumer demand for convenience and advanced features, relentless technological innovation, and generally favorable economic conditions across major markets.
- Market Share: In 2025, North America is projected to hold an estimated xx% of the global market share, followed by Europe at xx% and Asia-Pacific at xx%. The Asia-Pacific region presents the highest growth potential for future market expansion due to its immense population and rapidly expanding middle-income segment.
Smart Kitchen Market Product Landscape
Smart kitchen products range from smart refrigerators and ovens to smart cooktops and dishwashers, all interconnected via mobile applications. These products offer features such as automated cooking, remote control, ingredient tracking, and recipe suggestions. Technological advancements focus on improved connectivity, enhanced user interfaces, and greater integration with other smart home devices. Unique selling propositions include energy efficiency, time-saving features, and personalized cooking experiences.
Key Drivers, Barriers & Challenges in Smart Kitchen Market
Key Drivers:
- Technological Advancements: Continuous innovation in AI and IoT integration is creating more intelligent, intuitive, and connected kitchen experiences.
- Consumer Demand for Convenience and Efficiency: Consumers are increasingly valuing appliances that simplify daily tasks, save time, and offer greater control over their cooking processes.
- Growing Awareness of Smart Home Technologies: As smart home ecosystems become more mainstream, consumers are more open to integrating smart appliances into their kitchens for a cohesive experience.
- Focus on Health and Wellness: Smart kitchen appliances are increasingly offering features that support healthier cooking and dietary tracking, aligning with consumer trends.
Challenges & Restraints:
- High Initial Investment Costs: The premium pricing of smart kitchen appliances can be a significant barrier for some consumer segments, limiting widespread adoption.
- Data Privacy and Security Concerns: Consumers express apprehension regarding the collection and security of their personal data generated by connected appliances.
- Complexity of Integration: Ensuring seamless compatibility and ease of use across a multitude of different smart devices and platforms remains a challenge.
- Supply Chain Disruptions and Component Shortages: Global supply chain volatility, including shortages of critical components, led to an estimated xx% increase in manufacturing costs in 2024, impacting product availability and pricing.
Emerging Opportunities in Smart Kitchen Market
- Expansion into Developing Markets: Significant growth opportunities lie in emerging economies with rapidly increasing internet and smartphone penetration, creating a fertile ground for smart appliance adoption.
- Development of Affordable Smart Appliances: Innovations focused on reducing manufacturing costs and offering more budget-friendly smart kitchen solutions can unlock new consumer segments.
- Integration with Health and Wellness Platforms: Deeper integration with health tracking apps and personalized nutrition services can offer compelling value propositions, guiding users towards healthier eating habits.
- Focus on Energy Efficiency and Sustainability: The development of smart kitchen solutions designed for reduced energy consumption and enhanced sustainability will appeal to environmentally conscious consumers.
- Personalized Culinary Experiences: Leveraging AI to offer highly customized recipe suggestions, cooking guidance, and meal planning based on user preferences and dietary needs.
Growth Accelerators in the Smart Kitchen Market Industry
Strategic partnerships between appliance manufacturers and technology companies are accelerating growth. Technological breakthroughs, such as improved AI algorithms and enhanced connectivity, are expanding the capabilities of smart kitchen products, leading to increased consumer adoption. Expansion into new markets and the introduction of innovative product offerings are further driving market expansion.
Key Players Shaping the Smart Kitchen Market Market
- Dacor Holdings Inc
- Electrolux
- LG Electronics
- Samsung Electronics
- Haier Inc (GE Appliances)
- Panasonic Corporation
- Whirlpool Corporation
- Miele & Cie KG
- Groupe SEB
- BSH Hausgeräte GmbH
- Midea Group
- Frigidaire
- Liebherr Group
- Brava Home Inc
- Spinn Inc
- Tovala
- Meater (Apption Labs Limited)
- Cosori
- COWAY CO LTD
- Gourmia Inc
Notable Milestones in Smart Kitchen Market Sector
- August 2023: GE Appliances (GEA) and Google Cloud expand collaboration, launching Flavorly AI for personalized recipe creation within the SmartHQ app.
- January 2024: Fresco and Panasonic announce an AI-driven cooking assistant for Panasonic's HomeCHEF 4-in-1 multi-oven, enhancing recipe customization and cooking parameters.
In-Depth Smart Kitchen Market Market Outlook
The Smart Kitchen market is on an undeniable trajectory of sustained and robust growth, poised to become an integral part of modern living. This expansion will be primarily propelled by relentless technological advancements, a continually increasing rate of consumer adoption driven by perceived value, and strategic market expansion into untapped geographical regions. The formation of strategic partnerships between appliance manufacturers, technology providers, and service providers, coupled with a strong emphasis on innovative product development, will be paramount in fully capitalizing on the market's immense potential. The pervasive integration of AI, IoT, and advanced cloud computing technologies will further elevate the user experience by offering unprecedented levels of personalization and functionality, acting as a powerful accelerator for market expansion in the coming years. The forecast period clearly indicates a significant upward trend, presenting a wealth of opportunities for both established industry leaders and agile new entrants to carve out significant market share and drive future innovation.
Smart Kitchen Market Segmentation
-
1. Product Type
- 1.1. Smart Refrigerators
- 1.2. Smart Oven
- 1.3. Smart Dishwashers
- 1.4. Smart Cooktops
- 1.5. Other Product Types
-
2. End-user Industry
- 2.1. Residential
- 2.2. Commercial
Smart Kitchen Market Segmentation By Geography
- 1. North America
- 2. Europe
- 3. Asia
- 4. Australia and New Zealand
- 5. Latin America
- 6. Middle East and Africa
Smart Kitchen Market REPORT HIGHLIGHTS
| Aspects | Details |
|---|---|
| Study Period | 2019-2033 |
| Base Year | 2024 |
| Estimated Year | 2025 |
| Forecast Period | 2025-2033 |
| Historical Period | 2019-2024 |
| Growth Rate | CAGR of 14.10% from 2019-2033 |
| Segmentation |
|
Table of Contents
- 1. Introduction
- 1.1. Research Scope
- 1.2. Market Segmentation
- 1.3. Research Methodology
- 1.4. Definitions and Assumptions
- 2. Executive Summary
- 2.1. Introduction
- 3. Market Dynamics
- 3.1. Introduction
- 3.2. Market Drivers
- 3.2.1. Increasing Awareness toward Energy-Efficiency and Environmental Impact Drives the Market Demand; Surge in Urban Population and Interest toward Convenient Lifestyle Drives the Market Growth
- 3.3. Market Restrains
- 3.3.1. Increasing Awareness toward Energy-Efficiency and Environmental Impact Drives the Market Demand; Surge in Urban Population and Interest toward Convenient Lifestyle Drives the Market Growth
- 3.4. Market Trends
- 3.4.1. Residential End-User Segment is Expected to Hold Significant Market Share
- 4. Market Factor Analysis
- 4.1. Porters Five Forces
- 4.2. Supply/Value Chain
- 4.3. PESTEL analysis
- 4.4. Market Entropy
- 4.5. Patent/Trademark Analysis
- 5. Global Smart Kitchen Market Analysis, Insights and Forecast, 2019-2031
- 5.1. Market Analysis, Insights and Forecast - by Product Type
- 5.1.1. Smart Refrigerators
- 5.1.2. Smart Oven
- 5.1.3. Smart Dishwashers
- 5.1.4. Smart Cooktops
- 5.1.5. Other Product Types
- 5.2. Market Analysis, Insights and Forecast - by End-user Industry
- 5.2.1. Residential
- 5.2.2. Commercial
- 5.3. Market Analysis, Insights and Forecast - by Region
- 5.3.1. North America
- 5.3.2. Europe
- 5.3.3. Asia
- 5.3.4. Australia and New Zealand
- 5.3.5. Latin America
- 5.3.6. Middle East and Africa
- 5.1. Market Analysis, Insights and Forecast - by Product Type
- 6. North America Smart Kitchen Market Analysis, Insights and Forecast, 2019-2031
- 6.1. Market Analysis, Insights and Forecast - by Product Type
- 6.1.1. Smart Refrigerators
- 6.1.2. Smart Oven
- 6.1.3. Smart Dishwashers
- 6.1.4. Smart Cooktops
- 6.1.5. Other Product Types
- 6.2. Market Analysis, Insights and Forecast - by End-user Industry
- 6.2.1. Residential
- 6.2.2. Commercial
- 6.1. Market Analysis, Insights and Forecast - by Product Type
- 7. Europe Smart Kitchen Market Analysis, Insights and Forecast, 2019-2031
- 7.1. Market Analysis, Insights and Forecast - by Product Type
- 7.1.1. Smart Refrigerators
- 7.1.2. Smart Oven
- 7.1.3. Smart Dishwashers
- 7.1.4. Smart Cooktops
- 7.1.5. Other Product Types
- 7.2. Market Analysis, Insights and Forecast - by End-user Industry
- 7.2.1. Residential
- 7.2.2. Commercial
- 7.1. Market Analysis, Insights and Forecast - by Product Type
- 8. Asia Smart Kitchen Market Analysis, Insights and Forecast, 2019-2031
- 8.1. Market Analysis, Insights and Forecast - by Product Type
- 8.1.1. Smart Refrigerators
- 8.1.2. Smart Oven
- 8.1.3. Smart Dishwashers
- 8.1.4. Smart Cooktops
- 8.1.5. Other Product Types
- 8.2. Market Analysis, Insights and Forecast - by End-user Industry
- 8.2.1. Residential
- 8.2.2. Commercial
- 8.1. Market Analysis, Insights and Forecast - by Product Type
- 9. Australia and New Zealand Smart Kitchen Market Analysis, Insights and Forecast, 2019-2031
- 9.1. Market Analysis, Insights and Forecast - by Product Type
- 9.1.1. Smart Refrigerators
- 9.1.2. Smart Oven
- 9.1.3. Smart Dishwashers
- 9.1.4. Smart Cooktops
- 9.1.5. Other Product Types
- 9.2. Market Analysis, Insights and Forecast - by End-user Industry
- 9.2.1. Residential
- 9.2.2. Commercial
- 9.1. Market Analysis, Insights and Forecast - by Product Type
- 10. Latin America Smart Kitchen Market Analysis, Insights and Forecast, 2019-2031
- 10.1. Market Analysis, Insights and Forecast - by Product Type
- 10.1.1. Smart Refrigerators
- 10.1.2. Smart Oven
- 10.1.3. Smart Dishwashers
- 10.1.4. Smart Cooktops
- 10.1.5. Other Product Types
- 10.2. Market Analysis, Insights and Forecast - by End-user Industry
- 10.2.1. Residential
- 10.2.2. Commercial
- 10.1. Market Analysis, Insights and Forecast - by Product Type
- 11. Middle East and Africa Smart Kitchen Market Analysis, Insights and Forecast, 2019-2031
- 11.1. Market Analysis, Insights and Forecast - by Product Type
- 11.1.1. Smart Refrigerators
- 11.1.2. Smart Oven
- 11.1.3. Smart Dishwashers
- 11.1.4. Smart Cooktops
- 11.1.5. Other Product Types
- 11.2. Market Analysis, Insights and Forecast - by End-user Industry
- 11.2.1. Residential
- 11.2.2. Commercial
- 11.1. Market Analysis, Insights and Forecast - by Product Type
- 12. Competitive Analysis
- 12.1. Global Market Share Analysis 2024
- 12.2. Company Profiles
- 12.2.1 Dacor Holdings Inc
- 12.2.1.1. Overview
- 12.2.1.2. Products
- 12.2.1.3. SWOT Analysis
- 12.2.1.4. Recent Developments
- 12.2.1.5. Financials (Based on Availability)
- 12.2.2 Electrolux
- 12.2.2.1. Overview
- 12.2.2.2. Products
- 12.2.2.3. SWOT Analysis
- 12.2.2.4. Recent Developments
- 12.2.2.5. Financials (Based on Availability)
- 12.2.3 LG Electronics
- 12.2.3.1. Overview
- 12.2.3.2. Products
- 12.2.3.3. SWOT Analysis
- 12.2.3.4. Recent Developments
- 12.2.3.5. Financials (Based on Availability)
- 12.2.4 Samsung Electronics
- 12.2.4.1. Overview
- 12.2.4.2. Products
- 12.2.4.3. SWOT Analysis
- 12.2.4.4. Recent Developments
- 12.2.4.5. Financials (Based on Availability)
- 12.2.5 Haier Inc (GE Appliances)
- 12.2.5.1. Overview
- 12.2.5.2. Products
- 12.2.5.3. SWOT Analysis
- 12.2.5.4. Recent Developments
- 12.2.5.5. Financials (Based on Availability)
- 12.2.6 Panasonic Corporation
- 12.2.6.1. Overview
- 12.2.6.2. Products
- 12.2.6.3. SWOT Analysis
- 12.2.6.4. Recent Developments
- 12.2.6.5. Financials (Based on Availability)
- 12.2.7 Whirlpool Corporation
- 12.2.7.1. Overview
- 12.2.7.2. Products
- 12.2.7.3. SWOT Analysis
- 12.2.7.4. Recent Developments
- 12.2.7.5. Financials (Based on Availability)
- 12.2.8 Miele & Cie KG
- 12.2.8.1. Overview
- 12.2.8.2. Products
- 12.2.8.3. SWOT Analysis
- 12.2.8.4. Recent Developments
- 12.2.8.5. Financials (Based on Availability)
- 12.2.9 Groupe SEB
- 12.2.9.1. Overview
- 12.2.9.2. Products
- 12.2.9.3. SWOT Analysis
- 12.2.9.4. Recent Developments
- 12.2.9.5. Financials (Based on Availability)
- 12.2.10 BSH Hausgeräte GmbH
- 12.2.10.1. Overview
- 12.2.10.2. Products
- 12.2.10.3. SWOT Analysis
- 12.2.10.4. Recent Developments
- 12.2.10.5. Financials (Based on Availability)
- 12.2.11 Midea Group
- 12.2.11.1. Overview
- 12.2.11.2. Products
- 12.2.11.3. SWOT Analysis
- 12.2.11.4. Recent Developments
- 12.2.11.5. Financials (Based on Availability)
- 12.2.12 Frigidaire
- 12.2.12.1. Overview
- 12.2.12.2. Products
- 12.2.12.3. SWOT Analysis
- 12.2.12.4. Recent Developments
- 12.2.12.5. Financials (Based on Availability)
- 12.2.13 Liebherr Group
- 12.2.13.1. Overview
- 12.2.13.2. Products
- 12.2.13.3. SWOT Analysis
- 12.2.13.4. Recent Developments
- 12.2.13.5. Financials (Based on Availability)
- 12.2.14 Brava Home Inc
- 12.2.14.1. Overview
- 12.2.14.2. Products
- 12.2.14.3. SWOT Analysis
- 12.2.14.4. Recent Developments
- 12.2.14.5. Financials (Based on Availability)
- 12.2.15 Spinn Inc
- 12.2.15.1. Overview
- 12.2.15.2. Products
- 12.2.15.3. SWOT Analysis
- 12.2.15.4. Recent Developments
- 12.2.15.5. Financials (Based on Availability)
- 12.2.16 Tovala
- 12.2.16.1. Overview
- 12.2.16.2. Products
- 12.2.16.3. SWOT Analysis
- 12.2.16.4. Recent Developments
- 12.2.16.5. Financials (Based on Availability)
- 12.2.17 Meater (Apption Labs Limited)
- 12.2.17.1. Overview
- 12.2.17.2. Products
- 12.2.17.3. SWOT Analysis
- 12.2.17.4. Recent Developments
- 12.2.17.5. Financials (Based on Availability)
- 12.2.18 Cosori
- 12.2.18.1. Overview
- 12.2.18.2. Products
- 12.2.18.3. SWOT Analysis
- 12.2.18.4. Recent Developments
- 12.2.18.5. Financials (Based on Availability)
- 12.2.19 COWAY CO LTD
- 12.2.19.1. Overview
- 12.2.19.2. Products
- 12.2.19.3. SWOT Analysis
- 12.2.19.4. Recent Developments
- 12.2.19.5. Financials (Based on Availability)
- 12.2.20 Gourmia Inc
- 12.2.20.1. Overview
- 12.2.20.2. Products
- 12.2.20.3. SWOT Analysis
- 12.2.20.4. Recent Developments
- 12.2.20.5. Financials (Based on Availability)
- 12.2.1 Dacor Holdings Inc
List of Figures
- Figure 1: Global Smart Kitchen Market Revenue Breakdown (Million, %) by Region 2024 & 2032
- Figure 2: Global Smart Kitchen Market Volume Breakdown (Billion, %) by Region 2024 & 2032
- Figure 3: North America Smart Kitchen Market Revenue (Million), by Product Type 2024 & 2032
- Figure 4: North America Smart Kitchen Market Volume (Billion), by Product Type 2024 & 2032
- Figure 5: North America Smart Kitchen Market Revenue Share (%), by Product Type 2024 & 2032
- Figure 6: North America Smart Kitchen Market Volume Share (%), by Product Type 2024 & 2032
- Figure 7: North America Smart Kitchen Market Revenue (Million), by End-user Industry 2024 & 2032
- Figure 8: North America Smart Kitchen Market Volume (Billion), by End-user Industry 2024 & 2032
- Figure 9: North America Smart Kitchen Market Revenue Share (%), by End-user Industry 2024 & 2032
- Figure 10: North America Smart Kitchen Market Volume Share (%), by End-user Industry 2024 & 2032
- Figure 11: North America Smart Kitchen Market Revenue (Million), by Country 2024 & 2032
- Figure 12: North America Smart Kitchen Market Volume (Billion), by Country 2024 & 2032
- Figure 13: North America Smart Kitchen Market Revenue Share (%), by Country 2024 & 2032
- Figure 14: North America Smart Kitchen Market Volume Share (%), by Country 2024 & 2032
- Figure 15: Europe Smart Kitchen Market Revenue (Million), by Product Type 2024 & 2032
- Figure 16: Europe Smart Kitchen Market Volume (Billion), by Product Type 2024 & 2032
- Figure 17: Europe Smart Kitchen Market Revenue Share (%), by Product Type 2024 & 2032
- Figure 18: Europe Smart Kitchen Market Volume Share (%), by Product Type 2024 & 2032
- Figure 19: Europe Smart Kitchen Market Revenue (Million), by End-user Industry 2024 & 2032
- Figure 20: Europe Smart Kitchen Market Volume (Billion), by End-user Industry 2024 & 2032
- Figure 21: Europe Smart Kitchen Market Revenue Share (%), by End-user Industry 2024 & 2032
- Figure 22: Europe Smart Kitchen Market Volume Share (%), by End-user Industry 2024 & 2032
- Figure 23: Europe Smart Kitchen Market Revenue (Million), by Country 2024 & 2032
- Figure 24: Europe Smart Kitchen Market Volume (Billion), by Country 2024 & 2032
- Figure 25: Europe Smart Kitchen Market Revenue Share (%), by Country 2024 & 2032
- Figure 26: Europe Smart Kitchen Market Volume Share (%), by Country 2024 & 2032
- Figure 27: Asia Smart Kitchen Market Revenue (Million), by Product Type 2024 & 2032
- Figure 28: Asia Smart Kitchen Market Volume (Billion), by Product Type 2024 & 2032
- Figure 29: Asia Smart Kitchen Market Revenue Share (%), by Product Type 2024 & 2032
- Figure 30: Asia Smart Kitchen Market Volume Share (%), by Product Type 2024 & 2032
- Figure 31: Asia Smart Kitchen Market Revenue (Million), by End-user Industry 2024 & 2032
- Figure 32: Asia Smart Kitchen Market Volume (Billion), by End-user Industry 2024 & 2032
- Figure 33: Asia Smart Kitchen Market Revenue Share (%), by End-user Industry 2024 & 2032
- Figure 34: Asia Smart Kitchen Market Volume Share (%), by End-user Industry 2024 & 2032
- Figure 35: Asia Smart Kitchen Market Revenue (Million), by Country 2024 & 2032
- Figure 36: Asia Smart Kitchen Market Volume (Billion), by Country 2024 & 2032
- Figure 37: Asia Smart Kitchen Market Revenue Share (%), by Country 2024 & 2032
- Figure 38: Asia Smart Kitchen Market Volume Share (%), by Country 2024 & 2032
- Figure 39: Australia and New Zealand Smart Kitchen Market Revenue (Million), by Product Type 2024 & 2032
- Figure 40: Australia and New Zealand Smart Kitchen Market Volume (Billion), by Product Type 2024 & 2032
- Figure 41: Australia and New Zealand Smart Kitchen Market Revenue Share (%), by Product Type 2024 & 2032
- Figure 42: Australia and New Zealand Smart Kitchen Market Volume Share (%), by Product Type 2024 & 2032
- Figure 43: Australia and New Zealand Smart Kitchen Market Revenue (Million), by End-user Industry 2024 & 2032
- Figure 44: Australia and New Zealand Smart Kitchen Market Volume (Billion), by End-user Industry 2024 & 2032
- Figure 45: Australia and New Zealand Smart Kitchen Market Revenue Share (%), by End-user Industry 2024 & 2032
- Figure 46: Australia and New Zealand Smart Kitchen Market Volume Share (%), by End-user Industry 2024 & 2032
- Figure 47: Australia and New Zealand Smart Kitchen Market Revenue (Million), by Country 2024 & 2032
- Figure 48: Australia and New Zealand Smart Kitchen Market Volume (Billion), by Country 2024 & 2032
- Figure 49: Australia and New Zealand Smart Kitchen Market Revenue Share (%), by Country 2024 & 2032
- Figure 50: Australia and New Zealand Smart Kitchen Market Volume Share (%), by Country 2024 & 2032
- Figure 51: Latin America Smart Kitchen Market Revenue (Million), by Product Type 2024 & 2032
- Figure 52: Latin America Smart Kitchen Market Volume (Billion), by Product Type 2024 & 2032
- Figure 53: Latin America Smart Kitchen Market Revenue Share (%), by Product Type 2024 & 2032
- Figure 54: Latin America Smart Kitchen Market Volume Share (%), by Product Type 2024 & 2032
- Figure 55: Latin America Smart Kitchen Market Revenue (Million), by End-user Industry 2024 & 2032
- Figure 56: Latin America Smart Kitchen Market Volume (Billion), by End-user Industry 2024 & 2032
- Figure 57: Latin America Smart Kitchen Market Revenue Share (%), by End-user Industry 2024 & 2032
- Figure 58: Latin America Smart Kitchen Market Volume Share (%), by End-user Industry 2024 & 2032
- Figure 59: Latin America Smart Kitchen Market Revenue (Million), by Country 2024 & 2032
- Figure 60: Latin America Smart Kitchen Market Volume (Billion), by Country 2024 & 2032
- Figure 61: Latin America Smart Kitchen Market Revenue Share (%), by Country 2024 & 2032
- Figure 62: Latin America Smart Kitchen Market Volume Share (%), by Country 2024 & 2032
- Figure 63: Middle East and Africa Smart Kitchen Market Revenue (Million), by Product Type 2024 & 2032
- Figure 64: Middle East and Africa Smart Kitchen Market Volume (Billion), by Product Type 2024 & 2032
- Figure 65: Middle East and Africa Smart Kitchen Market Revenue Share (%), by Product Type 2024 & 2032
- Figure 66: Middle East and Africa Smart Kitchen Market Volume Share (%), by Product Type 2024 & 2032
- Figure 67: Middle East and Africa Smart Kitchen Market Revenue (Million), by End-user Industry 2024 & 2032
- Figure 68: Middle East and Africa Smart Kitchen Market Volume (Billion), by End-user Industry 2024 & 2032
- Figure 69: Middle East and Africa Smart Kitchen Market Revenue Share (%), by End-user Industry 2024 & 2032
- Figure 70: Middle East and Africa Smart Kitchen Market Volume Share (%), by End-user Industry 2024 & 2032
- Figure 71: Middle East and Africa Smart Kitchen Market Revenue (Million), by Country 2024 & 2032
- Figure 72: Middle East and Africa Smart Kitchen Market Volume (Billion), by Country 2024 & 2032
- Figure 73: Middle East and Africa Smart Kitchen Market Revenue Share (%), by Country 2024 & 2032
- Figure 74: Middle East and Africa Smart Kitchen Market Volume Share (%), by Country 2024 & 2032
List of Tables
- Table 1: Global Smart Kitchen Market Revenue Million Forecast, by Region 2019 & 2032
- Table 2: Global Smart Kitchen Market Volume Billion Forecast, by Region 2019 & 2032
- Table 3: Global Smart Kitchen Market Revenue Million Forecast, by Product Type 2019 & 2032
- Table 4: Global Smart Kitchen Market Volume Billion Forecast, by Product Type 2019 & 2032
- Table 5: Global Smart Kitchen Market Revenue Million Forecast, by End-user Industry 2019 & 2032
- Table 6: Global Smart Kitchen Market Volume Billion Forecast, by End-user Industry 2019 & 2032
- Table 7: Global Smart Kitchen Market Revenue Million Forecast, by Region 2019 & 2032
- Table 8: Global Smart Kitchen Market Volume Billion Forecast, by Region 2019 & 2032
- Table 9: Global Smart Kitchen Market Revenue Million Forecast, by Product Type 2019 & 2032
- Table 10: Global Smart Kitchen Market Volume Billion Forecast, by Product Type 2019 & 2032
- Table 11: Global Smart Kitchen Market Revenue Million Forecast, by End-user Industry 2019 & 2032
- Table 12: Global Smart Kitchen Market Volume Billion Forecast, by End-user Industry 2019 & 2032
- Table 13: Global Smart Kitchen Market Revenue Million Forecast, by Country 2019 & 2032
- Table 14: Global Smart Kitchen Market Volume Billion Forecast, by Country 2019 & 2032
- Table 15: Global Smart Kitchen Market Revenue Million Forecast, by Product Type 2019 & 2032
- Table 16: Global Smart Kitchen Market Volume Billion Forecast, by Product Type 2019 & 2032
- Table 17: Global Smart Kitchen Market Revenue Million Forecast, by End-user Industry 2019 & 2032
- Table 18: Global Smart Kitchen Market Volume Billion Forecast, by End-user Industry 2019 & 2032
- Table 19: Global Smart Kitchen Market Revenue Million Forecast, by Country 2019 & 2032
- Table 20: Global Smart Kitchen Market Volume Billion Forecast, by Country 2019 & 2032
- Table 21: Global Smart Kitchen Market Revenue Million Forecast, by Product Type 2019 & 2032
- Table 22: Global Smart Kitchen Market Volume Billion Forecast, by Product Type 2019 & 2032
- Table 23: Global Smart Kitchen Market Revenue Million Forecast, by End-user Industry 2019 & 2032
- Table 24: Global Smart Kitchen Market Volume Billion Forecast, by End-user Industry 2019 & 2032
- Table 25: Global Smart Kitchen Market Revenue Million Forecast, by Country 2019 & 2032
- Table 26: Global Smart Kitchen Market Volume Billion Forecast, by Country 2019 & 2032
- Table 27: Global Smart Kitchen Market Revenue Million Forecast, by Product Type 2019 & 2032
- Table 28: Global Smart Kitchen Market Volume Billion Forecast, by Product Type 2019 & 2032
- Table 29: Global Smart Kitchen Market Revenue Million Forecast, by End-user Industry 2019 & 2032
- Table 30: Global Smart Kitchen Market Volume Billion Forecast, by End-user Industry 2019 & 2032
- Table 31: Global Smart Kitchen Market Revenue Million Forecast, by Country 2019 & 2032
- Table 32: Global Smart Kitchen Market Volume Billion Forecast, by Country 2019 & 2032
- Table 33: Global Smart Kitchen Market Revenue Million Forecast, by Product Type 2019 & 2032
- Table 34: Global Smart Kitchen Market Volume Billion Forecast, by Product Type 2019 & 2032
- Table 35: Global Smart Kitchen Market Revenue Million Forecast, by End-user Industry 2019 & 2032
- Table 36: Global Smart Kitchen Market Volume Billion Forecast, by End-user Industry 2019 & 2032
- Table 37: Global Smart Kitchen Market Revenue Million Forecast, by Country 2019 & 2032
- Table 38: Global Smart Kitchen Market Volume Billion Forecast, by Country 2019 & 2032
- Table 39: Global Smart Kitchen Market Revenue Million Forecast, by Product Type 2019 & 2032
- Table 40: Global Smart Kitchen Market Volume Billion Forecast, by Product Type 2019 & 2032
- Table 41: Global Smart Kitchen Market Revenue Million Forecast, by End-user Industry 2019 & 2032
- Table 42: Global Smart Kitchen Market Volume Billion Forecast, by End-user Industry 2019 & 2032
- Table 43: Global Smart Kitchen Market Revenue Million Forecast, by Country 2019 & 2032
- Table 44: Global Smart Kitchen Market Volume Billion Forecast, by Country 2019 & 2032
Frequently Asked Questions
1. What is the projected Compound Annual Growth Rate (CAGR) of the Smart Kitchen Market?
The projected CAGR is approximately 14.10%.
2. Which companies are prominent players in the Smart Kitchen Market?
Key companies in the market include Dacor Holdings Inc, Electrolux, LG Electronics, Samsung Electronics, Haier Inc (GE Appliances), Panasonic Corporation, Whirlpool Corporation, Miele & Cie KG, Groupe SEB, BSH Hausgeräte GmbH, Midea Group, Frigidaire, Liebherr Group, Brava Home Inc, Spinn Inc, Tovala, Meater (Apption Labs Limited), Cosori, COWAY CO LTD, Gourmia Inc.
3. What are the main segments of the Smart Kitchen Market?
The market segments include Product Type, End-user Industry.
4. Can you provide details about the market size?
The market size is estimated to be USD 18.75 Million as of 2022.
5. What are some drivers contributing to market growth?
Increasing Awareness toward Energy-Efficiency and Environmental Impact Drives the Market Demand; Surge in Urban Population and Interest toward Convenient Lifestyle Drives the Market Growth.
6. What are the notable trends driving market growth?
Residential End-User Segment is Expected to Hold Significant Market Share.
7. Are there any restraints impacting market growth?
Increasing Awareness toward Energy-Efficiency and Environmental Impact Drives the Market Demand; Surge in Urban Population and Interest toward Convenient Lifestyle Drives the Market Growth.
8. Can you provide examples of recent developments in the market?
January 2024: At CES 2024, Fresco and Panasonic unveiled their broadened collaboration. These two industry frontrunners are set to introduce a groundbreaking AI-driven cooking assistant for Panasonic's kitchen devices, kicking off with the HomeCHEF 4-in-1 multi-oven. Integrated within the Panasonic app, Fresco's AI assistant empowers home chefs to tailor recipes to their dietary needs, swap ingredients based on pantry stock, and effortlessly modify serving sizes and cooking parameters.
9. What pricing options are available for accessing the report?
Pricing options include single-user, multi-user, and enterprise licenses priced at USD 4750, USD 5250, and USD 8750 respectively.
10. Is the market size provided in terms of value or volume?
The market size is provided in terms of value, measured in Million and volume, measured in Billion.
11. Are there any specific market keywords associated with the report?
Yes, the market keyword associated with the report is "Smart Kitchen Market," which aids in identifying and referencing the specific market segment covered.
12. How do I determine which pricing option suits my needs best?
The pricing options vary based on user requirements and access needs. Individual users may opt for single-user licenses, while businesses requiring broader access may choose multi-user or enterprise licenses for cost-effective access to the report.
13. Are there any additional resources or data provided in the Smart Kitchen Market report?
While the report offers comprehensive insights, it's advisable to review the specific contents or supplementary materials provided to ascertain if additional resources or data are available.
14. How can I stay updated on further developments or reports in the Smart Kitchen Market?
To stay informed about further developments, trends, and reports in the Smart Kitchen Market, consider subscribing to industry newsletters, following relevant companies and organizations, or regularly checking reputable industry news sources and publications.
Methodology
Step 1 - Identification of Relevant Samples Size from Population Database


Step 2 - Approaches for Defining Global Market Size (Value, Volume* & Price*)

Note*: In applicable scenarios
Step 3 - Data Sources
Primary Research
- Web Analytics
- Survey Reports
- Research Institute
- Latest Research Reports
- Opinion Leaders
Secondary Research
- Annual Reports
- White Paper
- Latest Press Release
- Industry Association
- Paid Database
- Investor Presentations

Step 4 - Data Triangulation
Involves using different sources of information in order to increase the validity of a study
These sources are likely to be stakeholders in a program - participants, other researchers, program staff, other community members, and so on.
Then we put all data in single framework & apply various statistical tools to find out the dynamic on the market.
During the analysis stage, feedback from the stakeholder groups would be compared to determine areas of agreement as well as areas of divergence
