

Key Insights
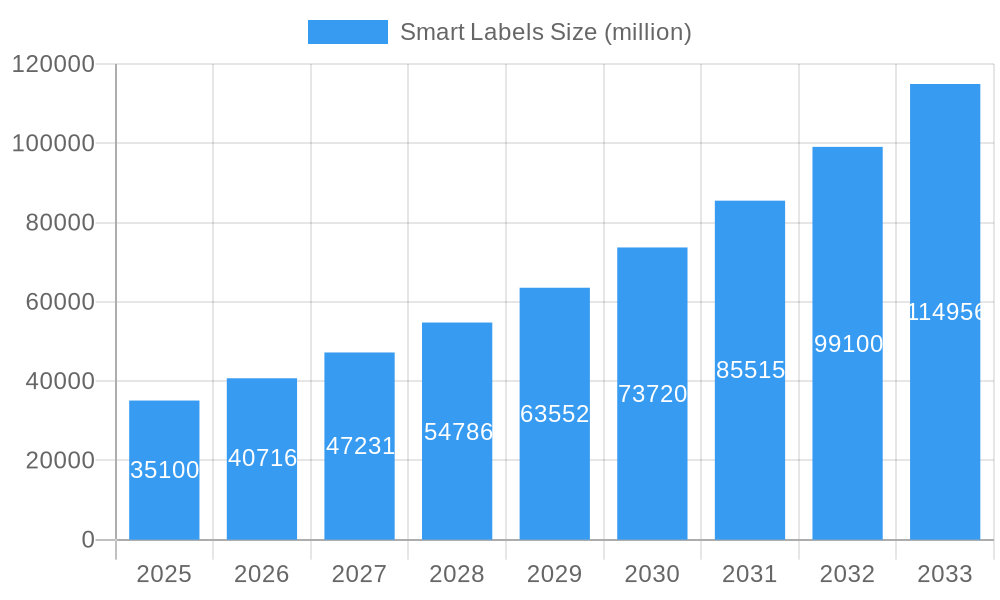
The global smart labels market, currently valued at $35.1 billion in 2025, is projected to experience robust growth, driven by a Compound Annual Growth Rate (CAGR) of 16% from 2025 to 2033. This expansion is fueled by several key factors. The rising adoption of smart labels across diverse industries, including retail, logistics, and healthcare, is a major catalyst. Retailers are increasingly leveraging smart labels to enhance inventory management, improve supply chain visibility, and enable real-time price updates and product tracking, leading to reduced losses and improved operational efficiency. The growing demand for counterfeit prevention and product authentication further bolsters market growth. Smart labels offer a secure and reliable solution for verifying product authenticity, protecting brand reputation, and preventing revenue loss from counterfeit products. Furthermore, advancements in RFID (Radio-Frequency Identification) technology and the decreasing cost of smart label production are making these solutions more accessible and cost-effective for businesses of all sizes. Technological advancements continue to drive innovation, with new features such as integrated sensors for temperature monitoring and location tracking enhancing the functionalities and applications of smart labels.
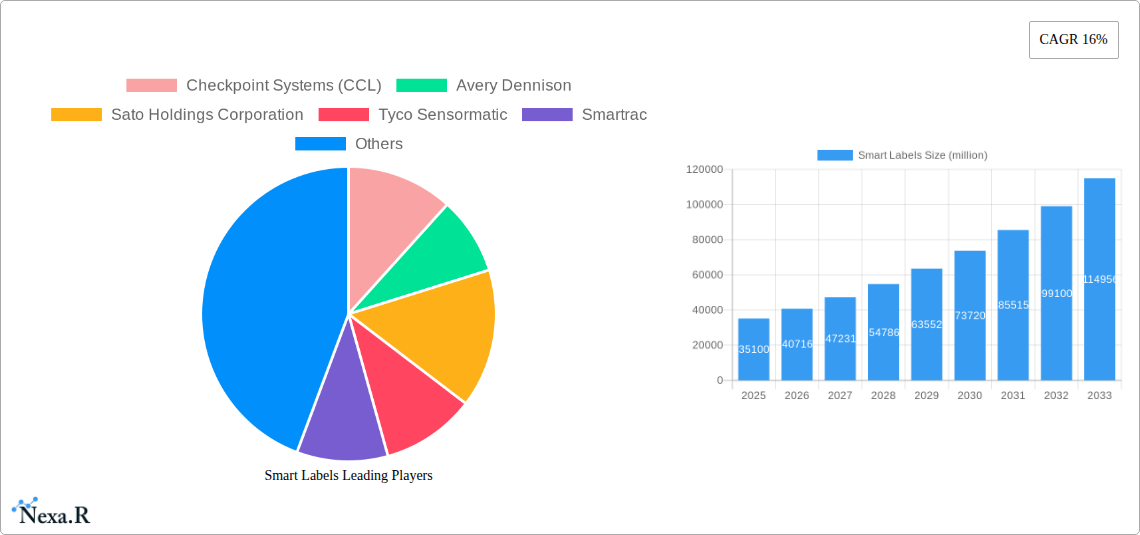
Smart Labels Market Size (In Billion)
The competitive landscape is marked by the presence of several key players, including Checkpoint Systems, Avery Dennison, and Sato Holdings Corporation, who are actively engaged in developing innovative smart label solutions and expanding their market reach. The market is segmented by technology (RFID, NFC, etc.), application (retail, healthcare, logistics, etc.), and geography. While regional data is unavailable, it is reasonable to expect significant growth in developing economies where supply chain optimization and improved product traceability are high priorities. Future growth will likely be influenced by the continued adoption of advanced technologies like IoT (Internet of Things) integration, which will further enhance the data capture and analytical capabilities of smart labels. The potential integration with blockchain technology could revolutionize product authenticity verification and supply chain transparency, driving further market expansion in the coming years.
Smart Labels Company Market Share
Smart Labels Market Report: 2019-2033
This comprehensive report provides a detailed analysis of the global Smart Labels market, encompassing market dynamics, growth trends, regional dominance, product landscape, key players, and future outlook. The study period covers 2019-2033, with 2025 as the base and estimated year. The forecast period spans 2025-2033, and the historical period includes 2019-2024. This report is an invaluable resource for industry professionals, investors, and strategic decision-makers seeking to understand and capitalize on the burgeoning opportunities within the smart label sector. The parent market is the broader labeling industry, while the child market is specifically RFID and electronic shelf labels within the smart label space.
Smart Labels Market Dynamics & Structure
The global smart labels market is characterized by moderate concentration, with key players such as Checkpoint Systems, Avery Dennison, and Sato Holdings Corporation holding significant market share (estimated at xx% combined in 2025). Technological innovation, particularly in RFID and NFC technologies, is a primary growth driver, while regulatory frameworks concerning data privacy and product traceability are shaping market dynamics. Competitive substitutes include traditional barcode labels, but smart labels offer superior functionalities. End-user demographics span diverse industries, including retail, logistics, healthcare, and manufacturing. M&A activity has been moderate (xx deals in 2019-2024), with larger players consolidating their positions through acquisitions of smaller, specialized firms. Innovation barriers include high initial investment costs for technology adoption and the need for robust infrastructure.
- Market Concentration: Moderately concentrated, with top 5 players holding xx% market share in 2025.
- Technological Innovation: RFID, NFC, and sensor integration driving growth.
- Regulatory Framework: Data privacy and traceability regulations influencing adoption.
- Competitive Substitutes: Traditional barcodes, but with limitations compared to smart labels.
- M&A Activity: xx deals recorded between 2019 and 2024, indicating consolidation.
- Innovation Barriers: High initial investment and infrastructure requirements.
Smart Labels Growth Trends & Insights
The global smart labels market is experiencing robust growth, driven by the increasing demand for improved supply chain visibility, enhanced product authentication, and real-time inventory management across various sectors. The market size reached xx million units in 2024 and is projected to reach xx million units by 2033, exhibiting a CAGR of xx% during the forecast period (2025-2033). Market penetration is currently at xx% in key regions and is expected to increase significantly. Technological disruptions, such as the integration of IoT capabilities and advanced analytics, are further accelerating growth. Consumer behavior shifts towards personalized experiences and demand for product transparency are also contributing factors.
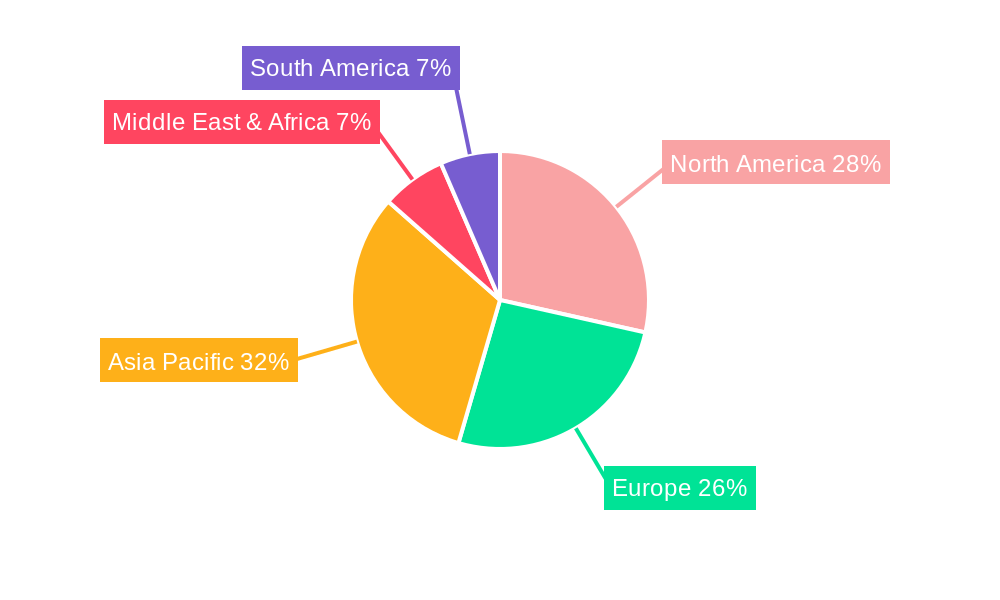
Dominant Regions, Countries, or Segments in Smart Labels
North America and Europe currently dominate the smart labels market, holding a combined market share of approximately xx% in 2025. This dominance is attributed to high levels of technological adoption, strong regulatory frameworks supporting traceability and product authentication, and well-developed supply chains. Asia-Pacific is expected to witness the fastest growth rate during the forecast period, driven by rising disposable incomes, expanding retail sectors, and increasing government investments in infrastructure.
- North America: High adoption rates, advanced technology infrastructure, strong regulatory support.
- Europe: High consumer awareness, focus on product traceability and sustainability.
- Asia-Pacific: Fastest growth rate driven by expanding retail and government initiatives.
- Market Share: North America and Europe hold xx% combined market share in 2025.
Smart Labels Product Landscape
Smart labels encompass a range of technologies, including RFID, NFC, and sensor-based solutions. Product innovations are focused on enhancing data storage capacity, improving read range, and integrating advanced functionalities such as temperature monitoring and geolocation tracking. Applications span diverse sectors, encompassing product authentication, inventory management, supply chain tracking, and consumer engagement. Key performance metrics include read rate, data retention, and durability. Unique selling propositions include improved efficiency, reduced costs, and enhanced security features.
Key Drivers, Barriers & Challenges in Smart Labels
Key Drivers: Increasing demand for supply chain visibility, stringent product authentication regulations, and the growth of e-commerce are key drivers. Technological advancements in RFID and NFC technologies are further fueling market expansion.
Challenges: High initial investment costs, integration complexity, and concerns regarding data security and privacy pose significant barriers to wider adoption. Supply chain disruptions can impact the availability of raw materials and components. Regulatory hurdles vary across regions, creating compliance challenges for businesses.
Emerging Opportunities in Smart Labels
The integration of smart labels with IoT devices and blockchain technology presents exciting opportunities for enhancing traceability and security. Untapped markets include niche sectors such as pharmaceuticals and high-value goods, requiring specialized solutions. Evolving consumer preferences towards personalized experiences are driving demand for interactive and responsive smart labels.
Growth Accelerators in the Smart Labels Industry
Strategic partnerships between technology providers and label manufacturers are accelerating innovation and market penetration. Technological breakthroughs in miniaturization and energy efficiency are making smart labels more cost-effective and user-friendly. Expanding into new geographic markets and developing innovative applications within emerging sectors will drive long-term growth.
Key Players Shaping the Smart Labels Market
- Checkpoint Systems (CCL)
- Avery Dennison
- Sato Holdings Corporation
- Tyco Sensormatic
- Smartrac
- SES (imagotag)
- Zebra
- Fujitsu
- Honeywell
- TAG Company
- Paragon ID
- Century
- Pricer
- Alien Technology
- Invengo Information Technology
- Multi-Color Corporation
- Samsung
- E Ink
- Displaydata
Notable Milestones in Smart Labels Sector
- 2020: Launch of next-generation RFID tags with improved read range and data capacity by Avery Dennison.
- 2021: Partnership between Checkpoint Systems and a major retailer to implement a large-scale RFID solution for inventory management.
- 2022: Acquisition of a smaller smart label manufacturer by Sato Holdings Corporation, expanding its product portfolio.
- 2023: Introduction of biodegradable and compostable smart label materials by several key players.
- 2024: Implementation of new data privacy regulations impacting the design and functionality of smart labels.
In-Depth Smart Labels Market Outlook
The smart labels market is poised for substantial growth over the next decade, driven by continuous technological advancements, increasing demand for supply chain transparency, and the expansion of e-commerce. Strategic opportunities exist for companies that can develop innovative applications, enhance data security, and establish robust supply chains. Focus on sustainability and the development of eco-friendly materials will be crucial for long-term market success.
Smart Labels Segmentation
-
1. Application
- 1.1. Automotive
- 1.2. Healthcare & Pharmaceutical
- 1.3. Logistic
- 1.4. Retail
- 1.5. Manufacturing
- 1.6. Others
-
2. Type
- 2.1. EAS Labels
- 2.2. RFID Labels
- 2.3. Sensing Labels
- 2.4. Electronic Shelf Labels
- 2.5. NFC Tags
Smart Labels Segmentation By Geography
-
1. North America
- 1.1. United States
- 1.2. Canada
- 1.3. Mexico
-
2. South America
- 2.1. Brazil
- 2.2. Argentina
- 2.3. Rest of South America
-
3. Europe
- 3.1. United Kingdom
- 3.2. Germany
- 3.3. France
- 3.4. Italy
- 3.5. Spain
- 3.6. Russia
- 3.7. Benelux
- 3.8. Nordics
- 3.9. Rest of Europe
-
4. Middle East & Africa
- 4.1. Turkey
- 4.2. Israel
- 4.3. GCC
- 4.4. North Africa
- 4.5. South Africa
- 4.6. Rest of Middle East & Africa
-
5. Asia Pacific
- 5.1. China
- 5.2. India
- 5.3. Japan
- 5.4. South Korea
- 5.5. ASEAN
- 5.6. Oceania
- 5.7. Rest of Asia Pacific
Smart Labels Regional Market Share
Geographic Coverage of Smart Labels
Smart Labels REPORT HIGHLIGHTS
| Aspects | Details |
|---|---|
| Study Period | 2020-2034 |
| Base Year | 2025 |
| Estimated Year | 2026 |
| Forecast Period | 2026-2034 |
| Historical Period | 2020-2025 |
| Growth Rate | CAGR of 10.9% from 2020-2034 |
| Segmentation |
|
Table of Contents
- 1. Introduction
- 1.1. Research Scope
- 1.2. Market Segmentation
- 1.3. Research Methodology
- 1.4. Definitions and Assumptions
- 2. Executive Summary
- 2.1. Introduction
- 3. Market Dynamics
- 3.1. Introduction
- 3.2. Market Drivers
- 3.3. Market Restrains
- 3.4. Market Trends
- 4. Market Factor Analysis
- 4.1. Porters Five Forces
- 4.2. Supply/Value Chain
- 4.3. PESTEL analysis
- 4.4. Market Entropy
- 4.5. Patent/Trademark Analysis
- 5. Global Smart Labels Analysis, Insights and Forecast, 2020-2032
- 5.1. Market Analysis, Insights and Forecast - by Application
- 5.1.1. Automotive
- 5.1.2. Healthcare & Pharmaceutical
- 5.1.3. Logistic
- 5.1.4. Retail
- 5.1.5. Manufacturing
- 5.1.6. Others
- 5.2. Market Analysis, Insights and Forecast - by Type
- 5.2.1. EAS Labels
- 5.2.2. RFID Labels
- 5.2.3. Sensing Labels
- 5.2.4. Electronic Shelf Labels
- 5.2.5. NFC Tags
- 5.3. Market Analysis, Insights and Forecast - by Region
- 5.3.1. North America
- 5.3.2. South America
- 5.3.3. Europe
- 5.3.4. Middle East & Africa
- 5.3.5. Asia Pacific
- 5.1. Market Analysis, Insights and Forecast - by Application
- 6. North America Smart Labels Analysis, Insights and Forecast, 2020-2032
- 6.1. Market Analysis, Insights and Forecast - by Application
- 6.1.1. Automotive
- 6.1.2. Healthcare & Pharmaceutical
- 6.1.3. Logistic
- 6.1.4. Retail
- 6.1.5. Manufacturing
- 6.1.6. Others
- 6.2. Market Analysis, Insights and Forecast - by Type
- 6.2.1. EAS Labels
- 6.2.2. RFID Labels
- 6.2.3. Sensing Labels
- 6.2.4. Electronic Shelf Labels
- 6.2.5. NFC Tags
- 6.1. Market Analysis, Insights and Forecast - by Application
- 7. South America Smart Labels Analysis, Insights and Forecast, 2020-2032
- 7.1. Market Analysis, Insights and Forecast - by Application
- 7.1.1. Automotive
- 7.1.2. Healthcare & Pharmaceutical
- 7.1.3. Logistic
- 7.1.4. Retail
- 7.1.5. Manufacturing
- 7.1.6. Others
- 7.2. Market Analysis, Insights and Forecast - by Type
- 7.2.1. EAS Labels
- 7.2.2. RFID Labels
- 7.2.3. Sensing Labels
- 7.2.4. Electronic Shelf Labels
- 7.2.5. NFC Tags
- 7.1. Market Analysis, Insights and Forecast - by Application
- 8. Europe Smart Labels Analysis, Insights and Forecast, 2020-2032
- 8.1. Market Analysis, Insights and Forecast - by Application
- 8.1.1. Automotive
- 8.1.2. Healthcare & Pharmaceutical
- 8.1.3. Logistic
- 8.1.4. Retail
- 8.1.5. Manufacturing
- 8.1.6. Others
- 8.2. Market Analysis, Insights and Forecast - by Type
- 8.2.1. EAS Labels
- 8.2.2. RFID Labels
- 8.2.3. Sensing Labels
- 8.2.4. Electronic Shelf Labels
- 8.2.5. NFC Tags
- 8.1. Market Analysis, Insights and Forecast - by Application
- 9. Middle East & Africa Smart Labels Analysis, Insights and Forecast, 2020-2032
- 9.1. Market Analysis, Insights and Forecast - by Application
- 9.1.1. Automotive
- 9.1.2. Healthcare & Pharmaceutical
- 9.1.3. Logistic
- 9.1.4. Retail
- 9.1.5. Manufacturing
- 9.1.6. Others
- 9.2. Market Analysis, Insights and Forecast - by Type
- 9.2.1. EAS Labels
- 9.2.2. RFID Labels
- 9.2.3. Sensing Labels
- 9.2.4. Electronic Shelf Labels
- 9.2.5. NFC Tags
- 9.1. Market Analysis, Insights and Forecast - by Application
- 10. Asia Pacific Smart Labels Analysis, Insights and Forecast, 2020-2032
- 10.1. Market Analysis, Insights and Forecast - by Application
- 10.1.1. Automotive
- 10.1.2. Healthcare & Pharmaceutical
- 10.1.3. Logistic
- 10.1.4. Retail
- 10.1.5. Manufacturing
- 10.1.6. Others
- 10.2. Market Analysis, Insights and Forecast - by Type
- 10.2.1. EAS Labels
- 10.2.2. RFID Labels
- 10.2.3. Sensing Labels
- 10.2.4. Electronic Shelf Labels
- 10.2.5. NFC Tags
- 10.1. Market Analysis, Insights and Forecast - by Application
- 11. Competitive Analysis
- 11.1. Global Market Share Analysis 2025
- 11.2. Company Profiles
- 11.2.1 Checkpoint Systems (CCL)
- 11.2.1.1. Overview
- 11.2.1.2. Products
- 11.2.1.3. SWOT Analysis
- 11.2.1.4. Recent Developments
- 11.2.1.5. Financials (Based on Availability)
- 11.2.2 Avery Dennison
- 11.2.2.1. Overview
- 11.2.2.2. Products
- 11.2.2.3. SWOT Analysis
- 11.2.2.4. Recent Developments
- 11.2.2.5. Financials (Based on Availability)
- 11.2.3 Sato Holdings Corporation
- 11.2.3.1. Overview
- 11.2.3.2. Products
- 11.2.3.3. SWOT Analysis
- 11.2.3.4. Recent Developments
- 11.2.3.5. Financials (Based on Availability)
- 11.2.4 Tyco Sensormatic
- 11.2.4.1. Overview
- 11.2.4.2. Products
- 11.2.4.3. SWOT Analysis
- 11.2.4.4. Recent Developments
- 11.2.4.5. Financials (Based on Availability)
- 11.2.5 Smartrac
- 11.2.5.1. Overview
- 11.2.5.2. Products
- 11.2.5.3. SWOT Analysis
- 11.2.5.4. Recent Developments
- 11.2.5.5. Financials (Based on Availability)
- 11.2.6 SES (imagotag)
- 11.2.6.1. Overview
- 11.2.6.2. Products
- 11.2.6.3. SWOT Analysis
- 11.2.6.4. Recent Developments
- 11.2.6.5. Financials (Based on Availability)
- 11.2.7 Zebra
- 11.2.7.1. Overview
- 11.2.7.2. Products
- 11.2.7.3. SWOT Analysis
- 11.2.7.4. Recent Developments
- 11.2.7.5. Financials (Based on Availability)
- 11.2.8 Fujitsu
- 11.2.8.1. Overview
- 11.2.8.2. Products
- 11.2.8.3. SWOT Analysis
- 11.2.8.4. Recent Developments
- 11.2.8.5. Financials (Based on Availability)
- 11.2.9 Honeywell
- 11.2.9.1. Overview
- 11.2.9.2. Products
- 11.2.9.3. SWOT Analysis
- 11.2.9.4. Recent Developments
- 11.2.9.5. Financials (Based on Availability)
- 11.2.10 TAG Company
- 11.2.10.1. Overview
- 11.2.10.2. Products
- 11.2.10.3. SWOT Analysis
- 11.2.10.4. Recent Developments
- 11.2.10.5. Financials (Based on Availability)
- 11.2.11 Paragon ID
- 11.2.11.1. Overview
- 11.2.11.2. Products
- 11.2.11.3. SWOT Analysis
- 11.2.11.4. Recent Developments
- 11.2.11.5. Financials (Based on Availability)
- 11.2.12 Century
- 11.2.12.1. Overview
- 11.2.12.2. Products
- 11.2.12.3. SWOT Analysis
- 11.2.12.4. Recent Developments
- 11.2.12.5. Financials (Based on Availability)
- 11.2.13 Pricer
- 11.2.13.1. Overview
- 11.2.13.2. Products
- 11.2.13.3. SWOT Analysis
- 11.2.13.4. Recent Developments
- 11.2.13.5. Financials (Based on Availability)
- 11.2.14 Alien Technology
- 11.2.14.1. Overview
- 11.2.14.2. Products
- 11.2.14.3. SWOT Analysis
- 11.2.14.4. Recent Developments
- 11.2.14.5. Financials (Based on Availability)
- 11.2.15 Invengo Information Technology
- 11.2.15.1. Overview
- 11.2.15.2. Products
- 11.2.15.3. SWOT Analysis
- 11.2.15.4. Recent Developments
- 11.2.15.5. Financials (Based on Availability)
- 11.2.16 Multi-Color Corporation
- 11.2.16.1. Overview
- 11.2.16.2. Products
- 11.2.16.3. SWOT Analysis
- 11.2.16.4. Recent Developments
- 11.2.16.5. Financials (Based on Availability)
- 11.2.17 Samsung
- 11.2.17.1. Overview
- 11.2.17.2. Products
- 11.2.17.3. SWOT Analysis
- 11.2.17.4. Recent Developments
- 11.2.17.5. Financials (Based on Availability)
- 11.2.18 E Ink
- 11.2.18.1. Overview
- 11.2.18.2. Products
- 11.2.18.3. SWOT Analysis
- 11.2.18.4. Recent Developments
- 11.2.18.5. Financials (Based on Availability)
- 11.2.19 Displaydata
- 11.2.19.1. Overview
- 11.2.19.2. Products
- 11.2.19.3. SWOT Analysis
- 11.2.19.4. Recent Developments
- 11.2.19.5. Financials (Based on Availability)
- 11.2.1 Checkpoint Systems (CCL)
List of Figures
- Figure 1: Global Smart Labels Revenue Breakdown (undefined, %) by Region 2025 & 2033
- Figure 2: Global Smart Labels Volume Breakdown (K, %) by Region 2025 & 2033
- Figure 3: North America Smart Labels Revenue (undefined), by Application 2025 & 2033
- Figure 4: North America Smart Labels Volume (K), by Application 2025 & 2033
- Figure 5: North America Smart Labels Revenue Share (%), by Application 2025 & 2033
- Figure 6: North America Smart Labels Volume Share (%), by Application 2025 & 2033
- Figure 7: North America Smart Labels Revenue (undefined), by Type 2025 & 2033
- Figure 8: North America Smart Labels Volume (K), by Type 2025 & 2033
- Figure 9: North America Smart Labels Revenue Share (%), by Type 2025 & 2033
- Figure 10: North America Smart Labels Volume Share (%), by Type 2025 & 2033
- Figure 11: North America Smart Labels Revenue (undefined), by Country 2025 & 2033
- Figure 12: North America Smart Labels Volume (K), by Country 2025 & 2033
- Figure 13: North America Smart Labels Revenue Share (%), by Country 2025 & 2033
- Figure 14: North America Smart Labels Volume Share (%), by Country 2025 & 2033
- Figure 15: South America Smart Labels Revenue (undefined), by Application 2025 & 2033
- Figure 16: South America Smart Labels Volume (K), by Application 2025 & 2033
- Figure 17: South America Smart Labels Revenue Share (%), by Application 2025 & 2033
- Figure 18: South America Smart Labels Volume Share (%), by Application 2025 & 2033
- Figure 19: South America Smart Labels Revenue (undefined), by Type 2025 & 2033
- Figure 20: South America Smart Labels Volume (K), by Type 2025 & 2033
- Figure 21: South America Smart Labels Revenue Share (%), by Type 2025 & 2033
- Figure 22: South America Smart Labels Volume Share (%), by Type 2025 & 2033
- Figure 23: South America Smart Labels Revenue (undefined), by Country 2025 & 2033
- Figure 24: South America Smart Labels Volume (K), by Country 2025 & 2033
- Figure 25: South America Smart Labels Revenue Share (%), by Country 2025 & 2033
- Figure 26: South America Smart Labels Volume Share (%), by Country 2025 & 2033
- Figure 27: Europe Smart Labels Revenue (undefined), by Application 2025 & 2033
- Figure 28: Europe Smart Labels Volume (K), by Application 2025 & 2033
- Figure 29: Europe Smart Labels Revenue Share (%), by Application 2025 & 2033
- Figure 30: Europe Smart Labels Volume Share (%), by Application 2025 & 2033
- Figure 31: Europe Smart Labels Revenue (undefined), by Type 2025 & 2033
- Figure 32: Europe Smart Labels Volume (K), by Type 2025 & 2033
- Figure 33: Europe Smart Labels Revenue Share (%), by Type 2025 & 2033
- Figure 34: Europe Smart Labels Volume Share (%), by Type 2025 & 2033
- Figure 35: Europe Smart Labels Revenue (undefined), by Country 2025 & 2033
- Figure 36: Europe Smart Labels Volume (K), by Country 2025 & 2033
- Figure 37: Europe Smart Labels Revenue Share (%), by Country 2025 & 2033
- Figure 38: Europe Smart Labels Volume Share (%), by Country 2025 & 2033
- Figure 39: Middle East & Africa Smart Labels Revenue (undefined), by Application 2025 & 2033
- Figure 40: Middle East & Africa Smart Labels Volume (K), by Application 2025 & 2033
- Figure 41: Middle East & Africa Smart Labels Revenue Share (%), by Application 2025 & 2033
- Figure 42: Middle East & Africa Smart Labels Volume Share (%), by Application 2025 & 2033
- Figure 43: Middle East & Africa Smart Labels Revenue (undefined), by Type 2025 & 2033
- Figure 44: Middle East & Africa Smart Labels Volume (K), by Type 2025 & 2033
- Figure 45: Middle East & Africa Smart Labels Revenue Share (%), by Type 2025 & 2033
- Figure 46: Middle East & Africa Smart Labels Volume Share (%), by Type 2025 & 2033
- Figure 47: Middle East & Africa Smart Labels Revenue (undefined), by Country 2025 & 2033
- Figure 48: Middle East & Africa Smart Labels Volume (K), by Country 2025 & 2033
- Figure 49: Middle East & Africa Smart Labels Revenue Share (%), by Country 2025 & 2033
- Figure 50: Middle East & Africa Smart Labels Volume Share (%), by Country 2025 & 2033
- Figure 51: Asia Pacific Smart Labels Revenue (undefined), by Application 2025 & 2033
- Figure 52: Asia Pacific Smart Labels Volume (K), by Application 2025 & 2033
- Figure 53: Asia Pacific Smart Labels Revenue Share (%), by Application 2025 & 2033
- Figure 54: Asia Pacific Smart Labels Volume Share (%), by Application 2025 & 2033
- Figure 55: Asia Pacific Smart Labels Revenue (undefined), by Type 2025 & 2033
- Figure 56: Asia Pacific Smart Labels Volume (K), by Type 2025 & 2033
- Figure 57: Asia Pacific Smart Labels Revenue Share (%), by Type 2025 & 2033
- Figure 58: Asia Pacific Smart Labels Volume Share (%), by Type 2025 & 2033
- Figure 59: Asia Pacific Smart Labels Revenue (undefined), by Country 2025 & 2033
- Figure 60: Asia Pacific Smart Labels Volume (K), by Country 2025 & 2033
- Figure 61: Asia Pacific Smart Labels Revenue Share (%), by Country 2025 & 2033
- Figure 62: Asia Pacific Smart Labels Volume Share (%), by Country 2025 & 2033
List of Tables
- Table 1: Global Smart Labels Revenue undefined Forecast, by Application 2020 & 2033
- Table 2: Global Smart Labels Volume K Forecast, by Application 2020 & 2033
- Table 3: Global Smart Labels Revenue undefined Forecast, by Type 2020 & 2033
- Table 4: Global Smart Labels Volume K Forecast, by Type 2020 & 2033
- Table 5: Global Smart Labels Revenue undefined Forecast, by Region 2020 & 2033
- Table 6: Global Smart Labels Volume K Forecast, by Region 2020 & 2033
- Table 7: Global Smart Labels Revenue undefined Forecast, by Application 2020 & 2033
- Table 8: Global Smart Labels Volume K Forecast, by Application 2020 & 2033
- Table 9: Global Smart Labels Revenue undefined Forecast, by Type 2020 & 2033
- Table 10: Global Smart Labels Volume K Forecast, by Type 2020 & 2033
- Table 11: Global Smart Labels Revenue undefined Forecast, by Country 2020 & 2033
- Table 12: Global Smart Labels Volume K Forecast, by Country 2020 & 2033
- Table 13: United States Smart Labels Revenue (undefined) Forecast, by Application 2020 & 2033
- Table 14: United States Smart Labels Volume (K) Forecast, by Application 2020 & 2033
- Table 15: Canada Smart Labels Revenue (undefined) Forecast, by Application 2020 & 2033
- Table 16: Canada Smart Labels Volume (K) Forecast, by Application 2020 & 2033
- Table 17: Mexico Smart Labels Revenue (undefined) Forecast, by Application 2020 & 2033
- Table 18: Mexico Smart Labels Volume (K) Forecast, by Application 2020 & 2033
- Table 19: Global Smart Labels Revenue undefined Forecast, by Application 2020 & 2033
- Table 20: Global Smart Labels Volume K Forecast, by Application 2020 & 2033
- Table 21: Global Smart Labels Revenue undefined Forecast, by Type 2020 & 2033
- Table 22: Global Smart Labels Volume K Forecast, by Type 2020 & 2033
- Table 23: Global Smart Labels Revenue undefined Forecast, by Country 2020 & 2033
- Table 24: Global Smart Labels Volume K Forecast, by Country 2020 & 2033
- Table 25: Brazil Smart Labels Revenue (undefined) Forecast, by Application 2020 & 2033
- Table 26: Brazil Smart Labels Volume (K) Forecast, by Application 2020 & 2033
- Table 27: Argentina Smart Labels Revenue (undefined) Forecast, by Application 2020 & 2033
- Table 28: Argentina Smart Labels Volume (K) Forecast, by Application 2020 & 2033
- Table 29: Rest of South America Smart Labels Revenue (undefined) Forecast, by Application 2020 & 2033
- Table 30: Rest of South America Smart Labels Volume (K) Forecast, by Application 2020 & 2033
- Table 31: Global Smart Labels Revenue undefined Forecast, by Application 2020 & 2033
- Table 32: Global Smart Labels Volume K Forecast, by Application 2020 & 2033
- Table 33: Global Smart Labels Revenue undefined Forecast, by Type 2020 & 2033
- Table 34: Global Smart Labels Volume K Forecast, by Type 2020 & 2033
- Table 35: Global Smart Labels Revenue undefined Forecast, by Country 2020 & 2033
- Table 36: Global Smart Labels Volume K Forecast, by Country 2020 & 2033
- Table 37: United Kingdom Smart Labels Revenue (undefined) Forecast, by Application 2020 & 2033
- Table 38: United Kingdom Smart Labels Volume (K) Forecast, by Application 2020 & 2033
- Table 39: Germany Smart Labels Revenue (undefined) Forecast, by Application 2020 & 2033
- Table 40: Germany Smart Labels Volume (K) Forecast, by Application 2020 & 2033
- Table 41: France Smart Labels Revenue (undefined) Forecast, by Application 2020 & 2033
- Table 42: France Smart Labels Volume (K) Forecast, by Application 2020 & 2033
- Table 43: Italy Smart Labels Revenue (undefined) Forecast, by Application 2020 & 2033
- Table 44: Italy Smart Labels Volume (K) Forecast, by Application 2020 & 2033
- Table 45: Spain Smart Labels Revenue (undefined) Forecast, by Application 2020 & 2033
- Table 46: Spain Smart Labels Volume (K) Forecast, by Application 2020 & 2033
- Table 47: Russia Smart Labels Revenue (undefined) Forecast, by Application 2020 & 2033
- Table 48: Russia Smart Labels Volume (K) Forecast, by Application 2020 & 2033
- Table 49: Benelux Smart Labels Revenue (undefined) Forecast, by Application 2020 & 2033
- Table 50: Benelux Smart Labels Volume (K) Forecast, by Application 2020 & 2033
- Table 51: Nordics Smart Labels Revenue (undefined) Forecast, by Application 2020 & 2033
- Table 52: Nordics Smart Labels Volume (K) Forecast, by Application 2020 & 2033
- Table 53: Rest of Europe Smart Labels Revenue (undefined) Forecast, by Application 2020 & 2033
- Table 54: Rest of Europe Smart Labels Volume (K) Forecast, by Application 2020 & 2033
- Table 55: Global Smart Labels Revenue undefined Forecast, by Application 2020 & 2033
- Table 56: Global Smart Labels Volume K Forecast, by Application 2020 & 2033
- Table 57: Global Smart Labels Revenue undefined Forecast, by Type 2020 & 2033
- Table 58: Global Smart Labels Volume K Forecast, by Type 2020 & 2033
- Table 59: Global Smart Labels Revenue undefined Forecast, by Country 2020 & 2033
- Table 60: Global Smart Labels Volume K Forecast, by Country 2020 & 2033
- Table 61: Turkey Smart Labels Revenue (undefined) Forecast, by Application 2020 & 2033
- Table 62: Turkey Smart Labels Volume (K) Forecast, by Application 2020 & 2033
- Table 63: Israel Smart Labels Revenue (undefined) Forecast, by Application 2020 & 2033
- Table 64: Israel Smart Labels Volume (K) Forecast, by Application 2020 & 2033
- Table 65: GCC Smart Labels Revenue (undefined) Forecast, by Application 2020 & 2033
- Table 66: GCC Smart Labels Volume (K) Forecast, by Application 2020 & 2033
- Table 67: North Africa Smart Labels Revenue (undefined) Forecast, by Application 2020 & 2033
- Table 68: North Africa Smart Labels Volume (K) Forecast, by Application 2020 & 2033
- Table 69: South Africa Smart Labels Revenue (undefined) Forecast, by Application 2020 & 2033
- Table 70: South Africa Smart Labels Volume (K) Forecast, by Application 2020 & 2033
- Table 71: Rest of Middle East & Africa Smart Labels Revenue (undefined) Forecast, by Application 2020 & 2033
- Table 72: Rest of Middle East & Africa Smart Labels Volume (K) Forecast, by Application 2020 & 2033
- Table 73: Global Smart Labels Revenue undefined Forecast, by Application 2020 & 2033
- Table 74: Global Smart Labels Volume K Forecast, by Application 2020 & 2033
- Table 75: Global Smart Labels Revenue undefined Forecast, by Type 2020 & 2033
- Table 76: Global Smart Labels Volume K Forecast, by Type 2020 & 2033
- Table 77: Global Smart Labels Revenue undefined Forecast, by Country 2020 & 2033
- Table 78: Global Smart Labels Volume K Forecast, by Country 2020 & 2033
- Table 79: China Smart Labels Revenue (undefined) Forecast, by Application 2020 & 2033
- Table 80: China Smart Labels Volume (K) Forecast, by Application 2020 & 2033
- Table 81: India Smart Labels Revenue (undefined) Forecast, by Application 2020 & 2033
- Table 82: India Smart Labels Volume (K) Forecast, by Application 2020 & 2033
- Table 83: Japan Smart Labels Revenue (undefined) Forecast, by Application 2020 & 2033
- Table 84: Japan Smart Labels Volume (K) Forecast, by Application 2020 & 2033
- Table 85: South Korea Smart Labels Revenue (undefined) Forecast, by Application 2020 & 2033
- Table 86: South Korea Smart Labels Volume (K) Forecast, by Application 2020 & 2033
- Table 87: ASEAN Smart Labels Revenue (undefined) Forecast, by Application 2020 & 2033
- Table 88: ASEAN Smart Labels Volume (K) Forecast, by Application 2020 & 2033
- Table 89: Oceania Smart Labels Revenue (undefined) Forecast, by Application 2020 & 2033
- Table 90: Oceania Smart Labels Volume (K) Forecast, by Application 2020 & 2033
- Table 91: Rest of Asia Pacific Smart Labels Revenue (undefined) Forecast, by Application 2020 & 2033
- Table 92: Rest of Asia Pacific Smart Labels Volume (K) Forecast, by Application 2020 & 2033
Frequently Asked Questions
1. What is the projected Compound Annual Growth Rate (CAGR) of the Smart Labels?
The projected CAGR is approximately 10.9%.
2. Which companies are prominent players in the Smart Labels?
Key companies in the market include Checkpoint Systems (CCL), Avery Dennison, Sato Holdings Corporation, Tyco Sensormatic, Smartrac, SES (imagotag), Zebra, Fujitsu, Honeywell, TAG Company, Paragon ID, Century, Pricer, Alien Technology, Invengo Information Technology, Multi-Color Corporation, Samsung, E Ink, Displaydata.
3. What are the main segments of the Smart Labels?
The market segments include Application, Type.
4. Can you provide details about the market size?
The market size is estimated to be USD XXX N/A as of 2022.
5. What are some drivers contributing to market growth?
N/A
6. What are the notable trends driving market growth?
N/A
7. Are there any restraints impacting market growth?
N/A
8. Can you provide examples of recent developments in the market?
N/A
9. What pricing options are available for accessing the report?
Pricing options include single-user, multi-user, and enterprise licenses priced at USD 3950.00, USD 5925.00, and USD 7900.00 respectively.
10. Is the market size provided in terms of value or volume?
The market size is provided in terms of value, measured in N/A and volume, measured in K.
11. Are there any specific market keywords associated with the report?
Yes, the market keyword associated with the report is "Smart Labels," which aids in identifying and referencing the specific market segment covered.
12. How do I determine which pricing option suits my needs best?
The pricing options vary based on user requirements and access needs. Individual users may opt for single-user licenses, while businesses requiring broader access may choose multi-user or enterprise licenses for cost-effective access to the report.
13. Are there any additional resources or data provided in the Smart Labels report?
While the report offers comprehensive insights, it's advisable to review the specific contents or supplementary materials provided to ascertain if additional resources or data are available.
14. How can I stay updated on further developments or reports in the Smart Labels?
To stay informed about further developments, trends, and reports in the Smart Labels, consider subscribing to industry newsletters, following relevant companies and organizations, or regularly checking reputable industry news sources and publications.
Methodology
Step 1 - Identification of Relevant Samples Size from Population Database


Step 2 - Approaches for Defining Global Market Size (Value, Volume* & Price*)

Note*: In applicable scenarios
Step 3 - Data Sources
Primary Research
- Web Analytics
- Survey Reports
- Research Institute
- Latest Research Reports
- Opinion Leaders
Secondary Research
- Annual Reports
- White Paper
- Latest Press Release
- Industry Association
- Paid Database
- Investor Presentations

Step 4 - Data Triangulation
Involves using different sources of information in order to increase the validity of a study
These sources are likely to be stakeholders in a program - participants, other researchers, program staff, other community members, and so on.
Then we put all data in single framework & apply various statistical tools to find out the dynamic on the market.
During the analysis stage, feedback from the stakeholder groups would be compared to determine areas of agreement as well as areas of divergence