

Key Insights
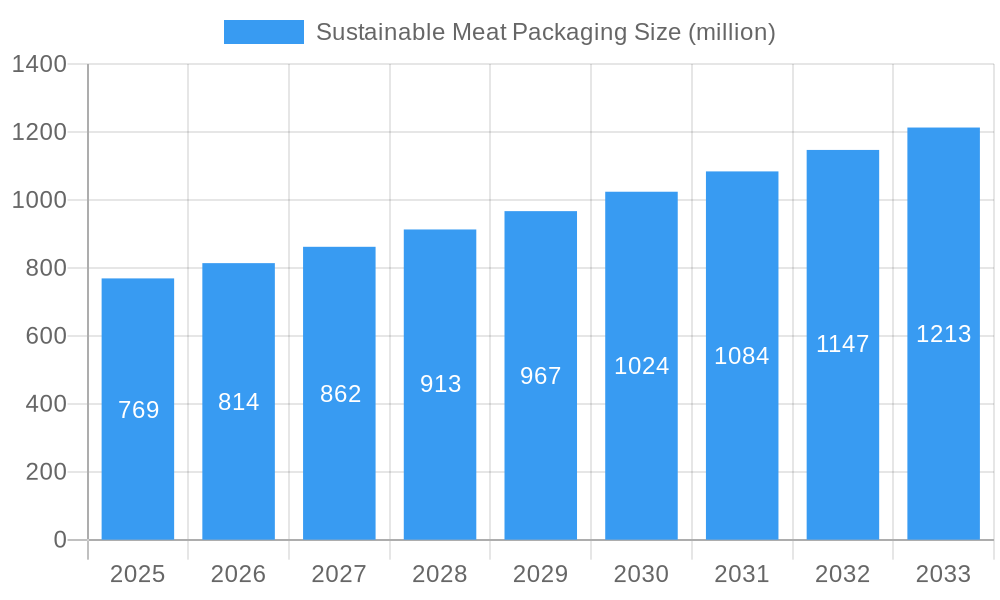
The sustainable meat packaging market, valued at $769 million in 2025, is projected to experience robust growth, driven by increasing consumer awareness of environmental issues and the escalating demand for eco-friendly alternatives to traditional packaging materials. A Compound Annual Growth Rate (CAGR) of 5.6% from 2025 to 2033 indicates a significant expansion of this market, reaching an estimated $1.2 billion by 2033. Key drivers include the growing popularity of plant-based meat alternatives, stringent government regulations aimed at reducing plastic waste, and the rising adoption of sustainable sourcing practices within the meat industry. Trends such as the increasing use of biodegradable and compostable materials, innovative packaging designs to extend shelf life while minimizing environmental impact, and the development of smart packaging solutions for improved traceability and reduced food waste are shaping the market landscape. While challenges remain, including the higher cost of sustainable materials compared to conventional options and the need for improved infrastructure for recycling and composting, these are being progressively addressed through technological advancements and industry collaborations. Leading companies like Amcor, Sealed Air, and Plantic Technologies are actively investing in research and development to offer innovative solutions that meet both sustainability and performance requirements.
Sustainable Meat Packaging Market Size (In Million)
The competitive landscape is characterized by a diverse range of players, encompassing both large multinational corporations and smaller specialized firms. Successful companies are focusing on developing a portfolio of sustainable packaging options to cater to different meat products and consumer preferences. Regional variations in consumer demand, regulatory frameworks, and infrastructure will influence market growth patterns, with North America and Europe expected to dominate the market initially, followed by gradual expansion in Asia-Pacific and other regions as sustainability awareness grows and infrastructure develops. The market will likely see further consolidation as larger companies acquire smaller firms with specialized technologies or market presence. This will enhance innovation and accelerate the adoption of sustainable meat packaging solutions across the global food industry.
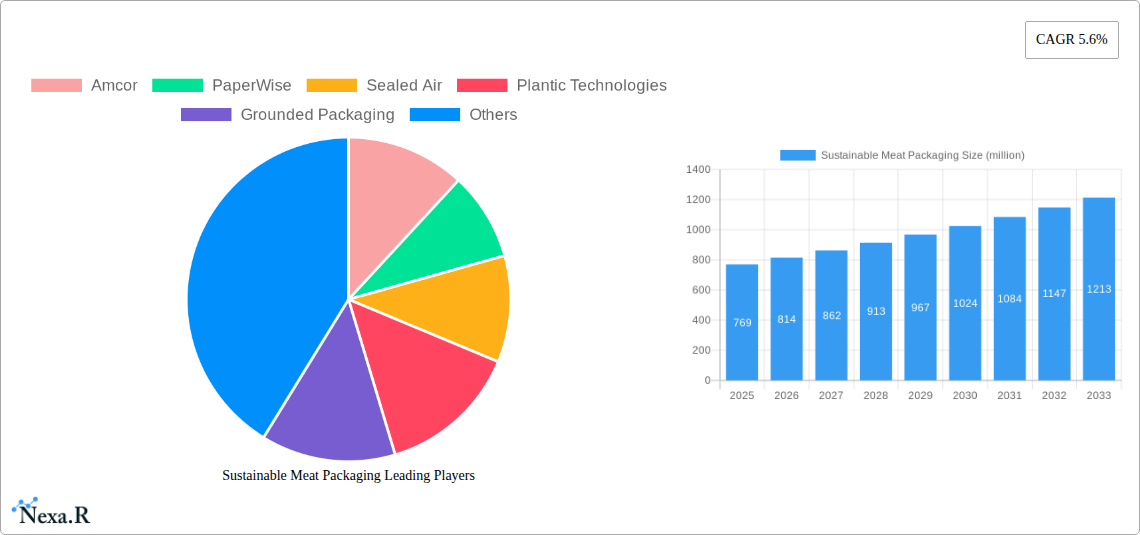
Sustainable Meat Packaging Company Market Share
Sustainable Meat Packaging Market Report: 2019-2033
This comprehensive report provides a detailed analysis of the sustainable meat packaging market, encompassing market dynamics, growth trends, regional analysis, product landscape, key players, and future outlook. The study period covers 2019-2033, with a base year of 2025 and a forecast period of 2025-2033. The report is essential for industry professionals, investors, and stakeholders seeking to understand and capitalize on opportunities within this rapidly evolving market. The total market size in 2025 is estimated at xx million units.
Sustainable Meat Packaging Market Dynamics & Structure
The sustainable meat packaging market is characterized by increasing consumer demand for eco-friendly alternatives, stringent regulations, and significant technological advancements. Market concentration is moderate, with several key players holding substantial shares. The market is driven by innovation in biodegradable and compostable materials, alongside a growing focus on reducing plastic waste. Regulatory frameworks, such as extended producer responsibility (EPR) schemes, are pushing companies to adopt sustainable packaging solutions. Competitive substitutes include traditional plastic packaging and alternative protein packaging. The market also shows increasing interest in mergers and acquisitions (M&A) activities focused on enhancing product portfolios and market reach.
- Market Concentration: Moderately concentrated, with top 5 players holding approximately xx% market share in 2025.
- Technological Innovation: Significant advancements in biodegradable polymers, compostable films, and recycled content materials.
- Regulatory Landscape: Stringent regulations on plastic waste and increasing adoption of EPR schemes driving market growth.
- Competitive Substitutes: Traditional plastic packaging, alternative protein packaging materials.
- M&A Activity: xx M&A deals recorded in the historical period (2019-2024), with an anticipated increase in the forecast period. Deals primarily focused on expanding product offerings and geographical reach.
- End-User Demographics: Growing demand from environmentally conscious consumers and retailers committed to sustainability initiatives.
Sustainable Meat Packaging Growth Trends & Insights
The sustainable meat packaging market exhibits a strong growth trajectory, fueled by increasing environmental awareness and regulatory pressures. The market size is projected to experience significant expansion during the forecast period (2025-2033), driven by factors such as rising consumer demand for sustainable products, technological innovations in packaging materials, and stricter environmental regulations. Adoption rates are increasing steadily, with a CAGR of xx% anticipated from 2025 to 2033. The shift towards plant-based meat alternatives further fuels market growth, demanding sustainable and efficient packaging solutions. Technological disruptions such as advancements in biodegradable and compostable materials are revolutionizing the packaging landscape. Consumer behavior is evolving rapidly, with a significant increase in demand for eco-friendly packaging options, thereby driving market growth.
- Market Size Evolution: From xx million units in 2019 to an estimated xx million units in 2025, projected to reach xx million units by 2033.
- CAGR (2025-2033): xx%
- Market Penetration: xx% in 2025, projected to increase to xx% by 2033.
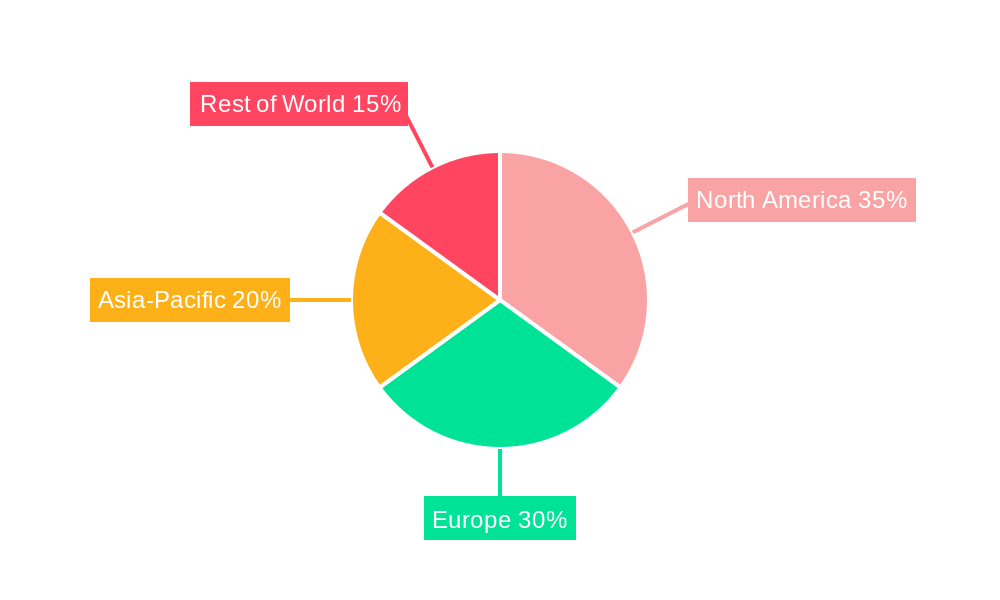
Dominant Regions, Countries, or Segments in Sustainable Meat Packaging
North America and Europe currently lead the sustainable meat packaging market, driven by stringent environmental regulations, high consumer awareness, and significant investments in sustainable technologies. However, Asia-Pacific is expected to demonstrate substantial growth in the coming years due to the expanding meat consumption market and increasing environmental concerns. The growth is spurred by factors such as rising disposable incomes, increasing awareness of environmental issues, and government initiatives promoting sustainable packaging solutions.
- Key Drivers in North America: Stricter environmental regulations, high consumer awareness, and readily available sustainable packaging materials.
- Key Drivers in Europe: Similar to North America, with added emphasis on the EU's circular economy initiatives.
- Key Drivers in Asia-Pacific: Rapidly expanding meat consumption, increasing environmental concerns, and government support for sustainable packaging.
- Market Share: North America holds approximately xx% market share in 2025, followed by Europe at xx% and Asia-Pacific at xx%.
Sustainable Meat Packaging Product Landscape
The sustainable meat packaging market offers a diverse range of products, including biodegradable films, compostable trays, and recycled paper-based packaging. Innovations focus on enhancing barrier properties, extending shelf life, and improving recyclability. These advancements cater to the specific needs of various meat products, from fresh cuts to processed meats. Key selling points include enhanced sustainability, reduced environmental impact, and compliance with regulatory standards. Technological advancements such as active and intelligent packaging are being explored to improve product safety and shelf-life.
Key Drivers, Barriers & Challenges in Sustainable Meat Packaging
Key Drivers:
- Increasing consumer demand for eco-friendly packaging.
- Stricter government regulations on plastic waste.
- Growth in plant-based meat alternatives.
- Technological advancements in biodegradable and compostable materials.
Key Challenges & Restraints:
- Higher cost of sustainable materials compared to traditional plastics.
- Performance limitations of some sustainable packaging solutions (e.g., barrier properties, shelf-life).
- Supply chain complexities in sourcing sustainable materials.
- Lack of standardized recycling infrastructure for sustainable packaging.
Emerging Opportunities in Sustainable Meat Packaging
Emerging opportunities lie in the development of innovative materials with enhanced barrier properties and improved compostability, expanding into new markets (e.g., developing countries), and focusing on customized packaging solutions for specific meat products. The integration of smart packaging technologies (e.g., time-temperature indicators) also presents significant potential. Further, catering to the growing demand for sustainable packaging from smaller meat producers and local butchers presents significant market potential.
Growth Accelerators in the Sustainable Meat Packaging Industry
Technological breakthroughs in bio-based polymers and advanced recycling technologies are key catalysts for long-term growth. Strategic partnerships between packaging manufacturers and meat producers are crucial for driving adoption. Expanding into emerging markets with growing meat consumption and promoting sustainable packaging practices through public awareness campaigns are crucial for achieving broader market penetration.
Key Players Shaping the Sustainable Meat Packaging Market
- Amcor
- PaperWise
- Sealed Air
- Plantic Technologies
- Grounded Packaging
- Solidus Packaging
- SP Group
- Butchers-Sundries
- Duropac
- Smart Packaging Solutions
- Amerplast
- ITC Packaging
- Eco-Products
- Mannok Pack
- Coveris Holdings
Notable Milestones in Sustainable Meat Packaging Sector
- 2020: Amcor launches a new range of recyclable meat trays.
- 2021: Sealed Air introduces a compostable film for meat packaging.
- 2022: Several key players announce partnerships to improve sustainable packaging supply chains.
- 2023: New regulations on plastic waste come into effect in several countries.
In-Depth Sustainable Meat Packaging Market Outlook
The future of the sustainable meat packaging market is bright, driven by continuous technological advancements, growing consumer awareness, and tightening environmental regulations. Significant opportunities exist for companies that can develop innovative, cost-effective, and high-performing sustainable packaging solutions. Strategic partnerships and investments in R&D will be crucial for success in this dynamic market. The market is expected to experience robust growth, driven by the factors outlined in this report, creating lucrative opportunities for both established players and new entrants.
Sustainable Meat Packaging Segmentation
-
1. Application
- 1.1. Fresh Meat Packaging
- 1.2. Processed Meat Packaging
- 1.3. Fish & Seafood
- 1.4. Others
-
2. Types
- 2.1. Tray
- 2.2. Lidding Film
- 2.3. Skin Packaging
- 2.4. Shrink Bag
- 2.5. Others
Sustainable Meat Packaging Segmentation By Geography
-
1. North America
- 1.1. United States
- 1.2. Canada
- 1.3. Mexico
-
2. South America
- 2.1. Brazil
- 2.2. Argentina
- 2.3. Rest of South America
-
3. Europe
- 3.1. United Kingdom
- 3.2. Germany
- 3.3. France
- 3.4. Italy
- 3.5. Spain
- 3.6. Russia
- 3.7. Benelux
- 3.8. Nordics
- 3.9. Rest of Europe
-
4. Middle East & Africa
- 4.1. Turkey
- 4.2. Israel
- 4.3. GCC
- 4.4. North Africa
- 4.5. South Africa
- 4.6. Rest of Middle East & Africa
-
5. Asia Pacific
- 5.1. China
- 5.2. India
- 5.3. Japan
- 5.4. South Korea
- 5.5. ASEAN
- 5.6. Oceania
- 5.7. Rest of Asia Pacific
Sustainable Meat Packaging Regional Market Share
Geographic Coverage of Sustainable Meat Packaging
Sustainable Meat Packaging REPORT HIGHLIGHTS
| Aspects | Details |
|---|---|
| Study Period | 2020-2034 |
| Base Year | 2025 |
| Estimated Year | 2026 |
| Forecast Period | 2026-2034 |
| Historical Period | 2020-2025 |
| Growth Rate | CAGR of 5.6% from 2020-2034 |
| Segmentation |
|
Table of Contents
- 1. Introduction
- 1.1. Research Scope
- 1.2. Market Segmentation
- 1.3. Research Methodology
- 1.4. Definitions and Assumptions
- 2. Executive Summary
- 2.1. Introduction
- 3. Market Dynamics
- 3.1. Introduction
- 3.2. Market Drivers
- 3.3. Market Restrains
- 3.4. Market Trends
- 4. Market Factor Analysis
- 4.1. Porters Five Forces
- 4.2. Supply/Value Chain
- 4.3. PESTEL analysis
- 4.4. Market Entropy
- 4.5. Patent/Trademark Analysis
- 5. Global Sustainable Meat Packaging Analysis, Insights and Forecast, 2020-2032
- 5.1. Market Analysis, Insights and Forecast - by Application
- 5.1.1. Fresh Meat Packaging
- 5.1.2. Processed Meat Packaging
- 5.1.3. Fish & Seafood
- 5.1.4. Others
- 5.2. Market Analysis, Insights and Forecast - by Types
- 5.2.1. Tray
- 5.2.2. Lidding Film
- 5.2.3. Skin Packaging
- 5.2.4. Shrink Bag
- 5.2.5. Others
- 5.3. Market Analysis, Insights and Forecast - by Region
- 5.3.1. North America
- 5.3.2. South America
- 5.3.3. Europe
- 5.3.4. Middle East & Africa
- 5.3.5. Asia Pacific
- 5.1. Market Analysis, Insights and Forecast - by Application
- 6. North America Sustainable Meat Packaging Analysis, Insights and Forecast, 2020-2032
- 6.1. Market Analysis, Insights and Forecast - by Application
- 6.1.1. Fresh Meat Packaging
- 6.1.2. Processed Meat Packaging
- 6.1.3. Fish & Seafood
- 6.1.4. Others
- 6.2. Market Analysis, Insights and Forecast - by Types
- 6.2.1. Tray
- 6.2.2. Lidding Film
- 6.2.3. Skin Packaging
- 6.2.4. Shrink Bag
- 6.2.5. Others
- 6.1. Market Analysis, Insights and Forecast - by Application
- 7. South America Sustainable Meat Packaging Analysis, Insights and Forecast, 2020-2032
- 7.1. Market Analysis, Insights and Forecast - by Application
- 7.1.1. Fresh Meat Packaging
- 7.1.2. Processed Meat Packaging
- 7.1.3. Fish & Seafood
- 7.1.4. Others
- 7.2. Market Analysis, Insights and Forecast - by Types
- 7.2.1. Tray
- 7.2.2. Lidding Film
- 7.2.3. Skin Packaging
- 7.2.4. Shrink Bag
- 7.2.5. Others
- 7.1. Market Analysis, Insights and Forecast - by Application
- 8. Europe Sustainable Meat Packaging Analysis, Insights and Forecast, 2020-2032
- 8.1. Market Analysis, Insights and Forecast - by Application
- 8.1.1. Fresh Meat Packaging
- 8.1.2. Processed Meat Packaging
- 8.1.3. Fish & Seafood
- 8.1.4. Others
- 8.2. Market Analysis, Insights and Forecast - by Types
- 8.2.1. Tray
- 8.2.2. Lidding Film
- 8.2.3. Skin Packaging
- 8.2.4. Shrink Bag
- 8.2.5. Others
- 8.1. Market Analysis, Insights and Forecast - by Application
- 9. Middle East & Africa Sustainable Meat Packaging Analysis, Insights and Forecast, 2020-2032
- 9.1. Market Analysis, Insights and Forecast - by Application
- 9.1.1. Fresh Meat Packaging
- 9.1.2. Processed Meat Packaging
- 9.1.3. Fish & Seafood
- 9.1.4. Others
- 9.2. Market Analysis, Insights and Forecast - by Types
- 9.2.1. Tray
- 9.2.2. Lidding Film
- 9.2.3. Skin Packaging
- 9.2.4. Shrink Bag
- 9.2.5. Others
- 9.1. Market Analysis, Insights and Forecast - by Application
- 10. Asia Pacific Sustainable Meat Packaging Analysis, Insights and Forecast, 2020-2032
- 10.1. Market Analysis, Insights and Forecast - by Application
- 10.1.1. Fresh Meat Packaging
- 10.1.2. Processed Meat Packaging
- 10.1.3. Fish & Seafood
- 10.1.4. Others
- 10.2. Market Analysis, Insights and Forecast - by Types
- 10.2.1. Tray
- 10.2.2. Lidding Film
- 10.2.3. Skin Packaging
- 10.2.4. Shrink Bag
- 10.2.5. Others
- 10.1. Market Analysis, Insights and Forecast - by Application
- 11. Competitive Analysis
- 11.1. Global Market Share Analysis 2025
- 11.2. Company Profiles
- 11.2.1 Amcor
- 11.2.1.1. Overview
- 11.2.1.2. Products
- 11.2.1.3. SWOT Analysis
- 11.2.1.4. Recent Developments
- 11.2.1.5. Financials (Based on Availability)
- 11.2.2 PaperWise
- 11.2.2.1. Overview
- 11.2.2.2. Products
- 11.2.2.3. SWOT Analysis
- 11.2.2.4. Recent Developments
- 11.2.2.5. Financials (Based on Availability)
- 11.2.3 Sealed Air
- 11.2.3.1. Overview
- 11.2.3.2. Products
- 11.2.3.3. SWOT Analysis
- 11.2.3.4. Recent Developments
- 11.2.3.5. Financials (Based on Availability)
- 11.2.4 Plantic Technologies
- 11.2.4.1. Overview
- 11.2.4.2. Products
- 11.2.4.3. SWOT Analysis
- 11.2.4.4. Recent Developments
- 11.2.4.5. Financials (Based on Availability)
- 11.2.5 Grounded Packaging
- 11.2.5.1. Overview
- 11.2.5.2. Products
- 11.2.5.3. SWOT Analysis
- 11.2.5.4. Recent Developments
- 11.2.5.5. Financials (Based on Availability)
- 11.2.6 Solidus Packaging
- 11.2.6.1. Overview
- 11.2.6.2. Products
- 11.2.6.3. SWOT Analysis
- 11.2.6.4. Recent Developments
- 11.2.6.5. Financials (Based on Availability)
- 11.2.7 SP Group
- 11.2.7.1. Overview
- 11.2.7.2. Products
- 11.2.7.3. SWOT Analysis
- 11.2.7.4. Recent Developments
- 11.2.7.5. Financials (Based on Availability)
- 11.2.8 Butchers-Sundries
- 11.2.8.1. Overview
- 11.2.8.2. Products
- 11.2.8.3. SWOT Analysis
- 11.2.8.4. Recent Developments
- 11.2.8.5. Financials (Based on Availability)
- 11.2.9 Duropac
- 11.2.9.1. Overview
- 11.2.9.2. Products
- 11.2.9.3. SWOT Analysis
- 11.2.9.4. Recent Developments
- 11.2.9.5. Financials (Based on Availability)
- 11.2.10 Smart Packaging Solutions
- 11.2.10.1. Overview
- 11.2.10.2. Products
- 11.2.10.3. SWOT Analysis
- 11.2.10.4. Recent Developments
- 11.2.10.5. Financials (Based on Availability)
- 11.2.11 Amerplast
- 11.2.11.1. Overview
- 11.2.11.2. Products
- 11.2.11.3. SWOT Analysis
- 11.2.11.4. Recent Developments
- 11.2.11.5. Financials (Based on Availability)
- 11.2.12 ITC Packaging
- 11.2.12.1. Overview
- 11.2.12.2. Products
- 11.2.12.3. SWOT Analysis
- 11.2.12.4. Recent Developments
- 11.2.12.5. Financials (Based on Availability)
- 11.2.13 Eco-Products
- 11.2.13.1. Overview
- 11.2.13.2. Products
- 11.2.13.3. SWOT Analysis
- 11.2.13.4. Recent Developments
- 11.2.13.5. Financials (Based on Availability)
- 11.2.14 Mannok Pack
- 11.2.14.1. Overview
- 11.2.14.2. Products
- 11.2.14.3. SWOT Analysis
- 11.2.14.4. Recent Developments
- 11.2.14.5. Financials (Based on Availability)
- 11.2.15 Coveris Holdings
- 11.2.15.1. Overview
- 11.2.15.2. Products
- 11.2.15.3. SWOT Analysis
- 11.2.15.4. Recent Developments
- 11.2.15.5. Financials (Based on Availability)
- 11.2.1 Amcor
List of Figures
- Figure 1: Global Sustainable Meat Packaging Revenue Breakdown (million, %) by Region 2025 & 2033
- Figure 2: Global Sustainable Meat Packaging Volume Breakdown (K, %) by Region 2025 & 2033
- Figure 3: North America Sustainable Meat Packaging Revenue (million), by Application 2025 & 2033
- Figure 4: North America Sustainable Meat Packaging Volume (K), by Application 2025 & 2033
- Figure 5: North America Sustainable Meat Packaging Revenue Share (%), by Application 2025 & 2033
- Figure 6: North America Sustainable Meat Packaging Volume Share (%), by Application 2025 & 2033
- Figure 7: North America Sustainable Meat Packaging Revenue (million), by Types 2025 & 2033
- Figure 8: North America Sustainable Meat Packaging Volume (K), by Types 2025 & 2033
- Figure 9: North America Sustainable Meat Packaging Revenue Share (%), by Types 2025 & 2033
- Figure 10: North America Sustainable Meat Packaging Volume Share (%), by Types 2025 & 2033
- Figure 11: North America Sustainable Meat Packaging Revenue (million), by Country 2025 & 2033
- Figure 12: North America Sustainable Meat Packaging Volume (K), by Country 2025 & 2033
- Figure 13: North America Sustainable Meat Packaging Revenue Share (%), by Country 2025 & 2033
- Figure 14: North America Sustainable Meat Packaging Volume Share (%), by Country 2025 & 2033
- Figure 15: South America Sustainable Meat Packaging Revenue (million), by Application 2025 & 2033
- Figure 16: South America Sustainable Meat Packaging Volume (K), by Application 2025 & 2033
- Figure 17: South America Sustainable Meat Packaging Revenue Share (%), by Application 2025 & 2033
- Figure 18: South America Sustainable Meat Packaging Volume Share (%), by Application 2025 & 2033
- Figure 19: South America Sustainable Meat Packaging Revenue (million), by Types 2025 & 2033
- Figure 20: South America Sustainable Meat Packaging Volume (K), by Types 2025 & 2033
- Figure 21: South America Sustainable Meat Packaging Revenue Share (%), by Types 2025 & 2033
- Figure 22: South America Sustainable Meat Packaging Volume Share (%), by Types 2025 & 2033
- Figure 23: South America Sustainable Meat Packaging Revenue (million), by Country 2025 & 2033
- Figure 24: South America Sustainable Meat Packaging Volume (K), by Country 2025 & 2033
- Figure 25: South America Sustainable Meat Packaging Revenue Share (%), by Country 2025 & 2033
- Figure 26: South America Sustainable Meat Packaging Volume Share (%), by Country 2025 & 2033
- Figure 27: Europe Sustainable Meat Packaging Revenue (million), by Application 2025 & 2033
- Figure 28: Europe Sustainable Meat Packaging Volume (K), by Application 2025 & 2033
- Figure 29: Europe Sustainable Meat Packaging Revenue Share (%), by Application 2025 & 2033
- Figure 30: Europe Sustainable Meat Packaging Volume Share (%), by Application 2025 & 2033
- Figure 31: Europe Sustainable Meat Packaging Revenue (million), by Types 2025 & 2033
- Figure 32: Europe Sustainable Meat Packaging Volume (K), by Types 2025 & 2033
- Figure 33: Europe Sustainable Meat Packaging Revenue Share (%), by Types 2025 & 2033
- Figure 34: Europe Sustainable Meat Packaging Volume Share (%), by Types 2025 & 2033
- Figure 35: Europe Sustainable Meat Packaging Revenue (million), by Country 2025 & 2033
- Figure 36: Europe Sustainable Meat Packaging Volume (K), by Country 2025 & 2033
- Figure 37: Europe Sustainable Meat Packaging Revenue Share (%), by Country 2025 & 2033
- Figure 38: Europe Sustainable Meat Packaging Volume Share (%), by Country 2025 & 2033
- Figure 39: Middle East & Africa Sustainable Meat Packaging Revenue (million), by Application 2025 & 2033
- Figure 40: Middle East & Africa Sustainable Meat Packaging Volume (K), by Application 2025 & 2033
- Figure 41: Middle East & Africa Sustainable Meat Packaging Revenue Share (%), by Application 2025 & 2033
- Figure 42: Middle East & Africa Sustainable Meat Packaging Volume Share (%), by Application 2025 & 2033
- Figure 43: Middle East & Africa Sustainable Meat Packaging Revenue (million), by Types 2025 & 2033
- Figure 44: Middle East & Africa Sustainable Meat Packaging Volume (K), by Types 2025 & 2033
- Figure 45: Middle East & Africa Sustainable Meat Packaging Revenue Share (%), by Types 2025 & 2033
- Figure 46: Middle East & Africa Sustainable Meat Packaging Volume Share (%), by Types 2025 & 2033
- Figure 47: Middle East & Africa Sustainable Meat Packaging Revenue (million), by Country 2025 & 2033
- Figure 48: Middle East & Africa Sustainable Meat Packaging Volume (K), by Country 2025 & 2033
- Figure 49: Middle East & Africa Sustainable Meat Packaging Revenue Share (%), by Country 2025 & 2033
- Figure 50: Middle East & Africa Sustainable Meat Packaging Volume Share (%), by Country 2025 & 2033
- Figure 51: Asia Pacific Sustainable Meat Packaging Revenue (million), by Application 2025 & 2033
- Figure 52: Asia Pacific Sustainable Meat Packaging Volume (K), by Application 2025 & 2033
- Figure 53: Asia Pacific Sustainable Meat Packaging Revenue Share (%), by Application 2025 & 2033
- Figure 54: Asia Pacific Sustainable Meat Packaging Volume Share (%), by Application 2025 & 2033
- Figure 55: Asia Pacific Sustainable Meat Packaging Revenue (million), by Types 2025 & 2033
- Figure 56: Asia Pacific Sustainable Meat Packaging Volume (K), by Types 2025 & 2033
- Figure 57: Asia Pacific Sustainable Meat Packaging Revenue Share (%), by Types 2025 & 2033
- Figure 58: Asia Pacific Sustainable Meat Packaging Volume Share (%), by Types 2025 & 2033
- Figure 59: Asia Pacific Sustainable Meat Packaging Revenue (million), by Country 2025 & 2033
- Figure 60: Asia Pacific Sustainable Meat Packaging Volume (K), by Country 2025 & 2033
- Figure 61: Asia Pacific Sustainable Meat Packaging Revenue Share (%), by Country 2025 & 2033
- Figure 62: Asia Pacific Sustainable Meat Packaging Volume Share (%), by Country 2025 & 2033
List of Tables
- Table 1: Global Sustainable Meat Packaging Revenue million Forecast, by Application 2020 & 2033
- Table 2: Global Sustainable Meat Packaging Volume K Forecast, by Application 2020 & 2033
- Table 3: Global Sustainable Meat Packaging Revenue million Forecast, by Types 2020 & 2033
- Table 4: Global Sustainable Meat Packaging Volume K Forecast, by Types 2020 & 2033
- Table 5: Global Sustainable Meat Packaging Revenue million Forecast, by Region 2020 & 2033
- Table 6: Global Sustainable Meat Packaging Volume K Forecast, by Region 2020 & 2033
- Table 7: Global Sustainable Meat Packaging Revenue million Forecast, by Application 2020 & 2033
- Table 8: Global Sustainable Meat Packaging Volume K Forecast, by Application 2020 & 2033
- Table 9: Global Sustainable Meat Packaging Revenue million Forecast, by Types 2020 & 2033
- Table 10: Global Sustainable Meat Packaging Volume K Forecast, by Types 2020 & 2033
- Table 11: Global Sustainable Meat Packaging Revenue million Forecast, by Country 2020 & 2033
- Table 12: Global Sustainable Meat Packaging Volume K Forecast, by Country 2020 & 2033
- Table 13: United States Sustainable Meat Packaging Revenue (million) Forecast, by Application 2020 & 2033
- Table 14: United States Sustainable Meat Packaging Volume (K) Forecast, by Application 2020 & 2033
- Table 15: Canada Sustainable Meat Packaging Revenue (million) Forecast, by Application 2020 & 2033
- Table 16: Canada Sustainable Meat Packaging Volume (K) Forecast, by Application 2020 & 2033
- Table 17: Mexico Sustainable Meat Packaging Revenue (million) Forecast, by Application 2020 & 2033
- Table 18: Mexico Sustainable Meat Packaging Volume (K) Forecast, by Application 2020 & 2033
- Table 19: Global Sustainable Meat Packaging Revenue million Forecast, by Application 2020 & 2033
- Table 20: Global Sustainable Meat Packaging Volume K Forecast, by Application 2020 & 2033
- Table 21: Global Sustainable Meat Packaging Revenue million Forecast, by Types 2020 & 2033
- Table 22: Global Sustainable Meat Packaging Volume K Forecast, by Types 2020 & 2033
- Table 23: Global Sustainable Meat Packaging Revenue million Forecast, by Country 2020 & 2033
- Table 24: Global Sustainable Meat Packaging Volume K Forecast, by Country 2020 & 2033
- Table 25: Brazil Sustainable Meat Packaging Revenue (million) Forecast, by Application 2020 & 2033
- Table 26: Brazil Sustainable Meat Packaging Volume (K) Forecast, by Application 2020 & 2033
- Table 27: Argentina Sustainable Meat Packaging Revenue (million) Forecast, by Application 2020 & 2033
- Table 28: Argentina Sustainable Meat Packaging Volume (K) Forecast, by Application 2020 & 2033
- Table 29: Rest of South America Sustainable Meat Packaging Revenue (million) Forecast, by Application 2020 & 2033
- Table 30: Rest of South America Sustainable Meat Packaging Volume (K) Forecast, by Application 2020 & 2033
- Table 31: Global Sustainable Meat Packaging Revenue million Forecast, by Application 2020 & 2033
- Table 32: Global Sustainable Meat Packaging Volume K Forecast, by Application 2020 & 2033
- Table 33: Global Sustainable Meat Packaging Revenue million Forecast, by Types 2020 & 2033
- Table 34: Global Sustainable Meat Packaging Volume K Forecast, by Types 2020 & 2033
- Table 35: Global Sustainable Meat Packaging Revenue million Forecast, by Country 2020 & 2033
- Table 36: Global Sustainable Meat Packaging Volume K Forecast, by Country 2020 & 2033
- Table 37: United Kingdom Sustainable Meat Packaging Revenue (million) Forecast, by Application 2020 & 2033
- Table 38: United Kingdom Sustainable Meat Packaging Volume (K) Forecast, by Application 2020 & 2033
- Table 39: Germany Sustainable Meat Packaging Revenue (million) Forecast, by Application 2020 & 2033
- Table 40: Germany Sustainable Meat Packaging Volume (K) Forecast, by Application 2020 & 2033
- Table 41: France Sustainable Meat Packaging Revenue (million) Forecast, by Application 2020 & 2033
- Table 42: France Sustainable Meat Packaging Volume (K) Forecast, by Application 2020 & 2033
- Table 43: Italy Sustainable Meat Packaging Revenue (million) Forecast, by Application 2020 & 2033
- Table 44: Italy Sustainable Meat Packaging Volume (K) Forecast, by Application 2020 & 2033
- Table 45: Spain Sustainable Meat Packaging Revenue (million) Forecast, by Application 2020 & 2033
- Table 46: Spain Sustainable Meat Packaging Volume (K) Forecast, by Application 2020 & 2033
- Table 47: Russia Sustainable Meat Packaging Revenue (million) Forecast, by Application 2020 & 2033
- Table 48: Russia Sustainable Meat Packaging Volume (K) Forecast, by Application 2020 & 2033
- Table 49: Benelux Sustainable Meat Packaging Revenue (million) Forecast, by Application 2020 & 2033
- Table 50: Benelux Sustainable Meat Packaging Volume (K) Forecast, by Application 2020 & 2033
- Table 51: Nordics Sustainable Meat Packaging Revenue (million) Forecast, by Application 2020 & 2033
- Table 52: Nordics Sustainable Meat Packaging Volume (K) Forecast, by Application 2020 & 2033
- Table 53: Rest of Europe Sustainable Meat Packaging Revenue (million) Forecast, by Application 2020 & 2033
- Table 54: Rest of Europe Sustainable Meat Packaging Volume (K) Forecast, by Application 2020 & 2033
- Table 55: Global Sustainable Meat Packaging Revenue million Forecast, by Application 2020 & 2033
- Table 56: Global Sustainable Meat Packaging Volume K Forecast, by Application 2020 & 2033
- Table 57: Global Sustainable Meat Packaging Revenue million Forecast, by Types 2020 & 2033
- Table 58: Global Sustainable Meat Packaging Volume K Forecast, by Types 2020 & 2033
- Table 59: Global Sustainable Meat Packaging Revenue million Forecast, by Country 2020 & 2033
- Table 60: Global Sustainable Meat Packaging Volume K Forecast, by Country 2020 & 2033
- Table 61: Turkey Sustainable Meat Packaging Revenue (million) Forecast, by Application 2020 & 2033
- Table 62: Turkey Sustainable Meat Packaging Volume (K) Forecast, by Application 2020 & 2033
- Table 63: Israel Sustainable Meat Packaging Revenue (million) Forecast, by Application 2020 & 2033
- Table 64: Israel Sustainable Meat Packaging Volume (K) Forecast, by Application 2020 & 2033
- Table 65: GCC Sustainable Meat Packaging Revenue (million) Forecast, by Application 2020 & 2033
- Table 66: GCC Sustainable Meat Packaging Volume (K) Forecast, by Application 2020 & 2033
- Table 67: North Africa Sustainable Meat Packaging Revenue (million) Forecast, by Application 2020 & 2033
- Table 68: North Africa Sustainable Meat Packaging Volume (K) Forecast, by Application 2020 & 2033
- Table 69: South Africa Sustainable Meat Packaging Revenue (million) Forecast, by Application 2020 & 2033
- Table 70: South Africa Sustainable Meat Packaging Volume (K) Forecast, by Application 2020 & 2033
- Table 71: Rest of Middle East & Africa Sustainable Meat Packaging Revenue (million) Forecast, by Application 2020 & 2033
- Table 72: Rest of Middle East & Africa Sustainable Meat Packaging Volume (K) Forecast, by Application 2020 & 2033
- Table 73: Global Sustainable Meat Packaging Revenue million Forecast, by Application 2020 & 2033
- Table 74: Global Sustainable Meat Packaging Volume K Forecast, by Application 2020 & 2033
- Table 75: Global Sustainable Meat Packaging Revenue million Forecast, by Types 2020 & 2033
- Table 76: Global Sustainable Meat Packaging Volume K Forecast, by Types 2020 & 2033
- Table 77: Global Sustainable Meat Packaging Revenue million Forecast, by Country 2020 & 2033
- Table 78: Global Sustainable Meat Packaging Volume K Forecast, by Country 2020 & 2033
- Table 79: China Sustainable Meat Packaging Revenue (million) Forecast, by Application 2020 & 2033
- Table 80: China Sustainable Meat Packaging Volume (K) Forecast, by Application 2020 & 2033
- Table 81: India Sustainable Meat Packaging Revenue (million) Forecast, by Application 2020 & 2033
- Table 82: India Sustainable Meat Packaging Volume (K) Forecast, by Application 2020 & 2033
- Table 83: Japan Sustainable Meat Packaging Revenue (million) Forecast, by Application 2020 & 2033
- Table 84: Japan Sustainable Meat Packaging Volume (K) Forecast, by Application 2020 & 2033
- Table 85: South Korea Sustainable Meat Packaging Revenue (million) Forecast, by Application 2020 & 2033
- Table 86: South Korea Sustainable Meat Packaging Volume (K) Forecast, by Application 2020 & 2033
- Table 87: ASEAN Sustainable Meat Packaging Revenue (million) Forecast, by Application 2020 & 2033
- Table 88: ASEAN Sustainable Meat Packaging Volume (K) Forecast, by Application 2020 & 2033
- Table 89: Oceania Sustainable Meat Packaging Revenue (million) Forecast, by Application 2020 & 2033
- Table 90: Oceania Sustainable Meat Packaging Volume (K) Forecast, by Application 2020 & 2033
- Table 91: Rest of Asia Pacific Sustainable Meat Packaging Revenue (million) Forecast, by Application 2020 & 2033
- Table 92: Rest of Asia Pacific Sustainable Meat Packaging Volume (K) Forecast, by Application 2020 & 2033
Frequently Asked Questions
1. What is the projected Compound Annual Growth Rate (CAGR) of the Sustainable Meat Packaging?
The projected CAGR is approximately 5.6%.
2. Which companies are prominent players in the Sustainable Meat Packaging?
Key companies in the market include Amcor, PaperWise, Sealed Air, Plantic Technologies, Grounded Packaging, Solidus Packaging, SP Group, Butchers-Sundries, Duropac, Smart Packaging Solutions, Amerplast, ITC Packaging, Eco-Products, Mannok Pack, Coveris Holdings.
3. What are the main segments of the Sustainable Meat Packaging?
The market segments include Application, Types.
4. Can you provide details about the market size?
The market size is estimated to be USD 769 million as of 2022.
5. What are some drivers contributing to market growth?
N/A
6. What are the notable trends driving market growth?
N/A
7. Are there any restraints impacting market growth?
N/A
8. Can you provide examples of recent developments in the market?
N/A
9. What pricing options are available for accessing the report?
Pricing options include single-user, multi-user, and enterprise licenses priced at USD 4350.00, USD 6525.00, and USD 8700.00 respectively.
10. Is the market size provided in terms of value or volume?
The market size is provided in terms of value, measured in million and volume, measured in K.
11. Are there any specific market keywords associated with the report?
Yes, the market keyword associated with the report is "Sustainable Meat Packaging," which aids in identifying and referencing the specific market segment covered.
12. How do I determine which pricing option suits my needs best?
The pricing options vary based on user requirements and access needs. Individual users may opt for single-user licenses, while businesses requiring broader access may choose multi-user or enterprise licenses for cost-effective access to the report.
13. Are there any additional resources or data provided in the Sustainable Meat Packaging report?
While the report offers comprehensive insights, it's advisable to review the specific contents or supplementary materials provided to ascertain if additional resources or data are available.
14. How can I stay updated on further developments or reports in the Sustainable Meat Packaging?
To stay informed about further developments, trends, and reports in the Sustainable Meat Packaging, consider subscribing to industry newsletters, following relevant companies and organizations, or regularly checking reputable industry news sources and publications.
Methodology
Step 1 - Identification of Relevant Samples Size from Population Database


Step 2 - Approaches for Defining Global Market Size (Value, Volume* & Price*)

Note*: In applicable scenarios
Step 3 - Data Sources
Primary Research
- Web Analytics
- Survey Reports
- Research Institute
- Latest Research Reports
- Opinion Leaders
Secondary Research
- Annual Reports
- White Paper
- Latest Press Release
- Industry Association
- Paid Database
- Investor Presentations

Step 4 - Data Triangulation
Involves using different sources of information in order to increase the validity of a study
These sources are likely to be stakeholders in a program - participants, other researchers, program staff, other community members, and so on.
Then we put all data in single framework & apply various statistical tools to find out the dynamic on the market.
During the analysis stage, feedback from the stakeholder groups would be compared to determine areas of agreement as well as areas of divergence