

Key Insights
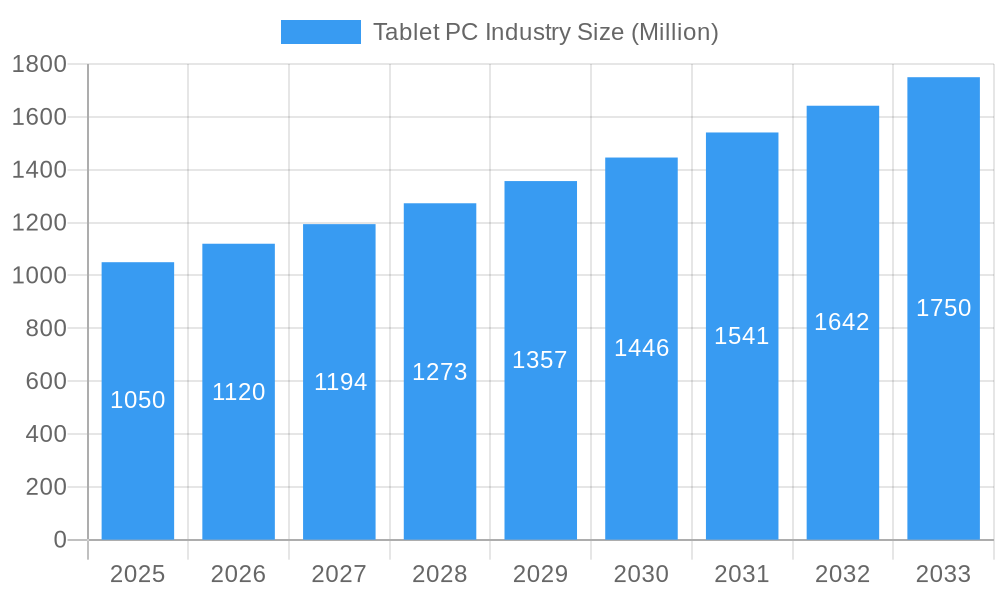
The global Tablet PC market, valued at $1.05 billion in 2025, is projected to experience robust growth, driven by increasing demand across diverse end-user industries. A Compound Annual Growth Rate (CAGR) of 6.38% from 2025 to 2033 indicates a significant expansion of this market. Key drivers include the rising adoption of ruggedized tablets in demanding environments like manufacturing, energy, and logistics, where durability and performance are paramount. The preference for mobile computing solutions, coupled with advancements in processing power, battery life, and connectivity, further fuels market growth. Segmentation by type (fully rugged, semi-rugged, ultra-rugged), operating system (Windows, Android), and end-user industry reveals varying growth trajectories. For instance, the fully rugged segment is likely to experience higher growth due to its suitability for harsh conditions, while the Android operating system's affordability and adaptability could contribute to increased market penetration. Geographic expansion is another contributing factor, with regions like Asia Pacific anticipated to showcase strong growth potential due to increasing industrialization and technological advancements. However, potential restraints could include the increasing popularity of smartphones and laptops which offer similar functionalities, as well as economic fluctuations which may impact capital expenditure in certain sectors.
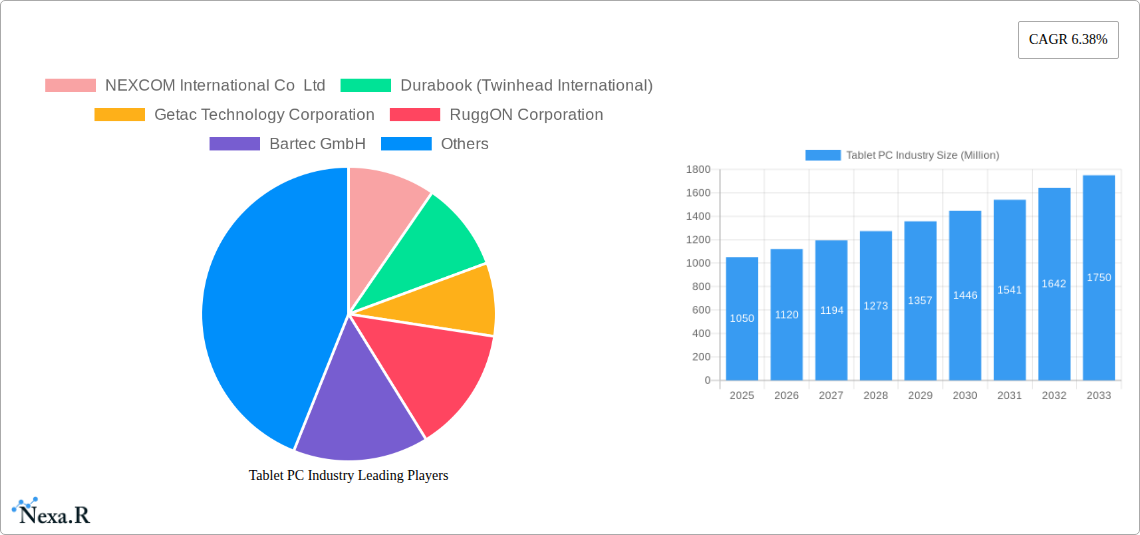
Tablet PC Industry Market Size (In Billion)
Leading players like NEXCOM, Durabook, Getac, and Zebra Technologies are strategically investing in research and development to enhance product capabilities and expand their market share. The competitive landscape is characterized by both established players and emerging companies vying for dominance. The integration of advanced features like 5G connectivity, improved security measures, and specialized software solutions are expected to further shape the market landscape in the coming years. This dynamic interplay of technological advancements, industry-specific requirements, and competitive pressures will continue to shape the trajectory of the global Tablet PC market.
Tablet PC Industry Company Market Share
Tablet PC Industry: A Comprehensive Market Report (2019-2033)
This in-depth report provides a comprehensive analysis of the Tablet PC industry, encompassing market dynamics, growth trends, regional dominance, product landscape, key players, and future outlook. With a focus on both parent (mobile computing devices) and child (ruggedized tablets) markets, this report is essential for industry professionals, investors, and strategic decision-makers. The study period covers 2019-2033, with 2025 as the base and estimated year. The forecast period is 2025-2033, and the historical period is 2019-2024. Expected market size values are presented in Million units.
Tablet PC Industry Market Dynamics & Structure
The Tablet PC market, while mature in its consumer segment, experiences dynamic growth within the ruggedized and specialized sectors. Market concentration is moderate, with a few major players holding significant shares, but numerous niche players catering to specific needs. Technological innovation, particularly in processing power, durability, and connectivity, is a crucial driver. Regulatory frameworks concerning data security and device compliance across various industries influence market adoption. Competitive product substitutes include specialized laptops and handheld devices, particularly in specific applications. End-user demographics are diverse, spanning manufacturing, logistics, and government agencies, each with unique needs driving technological and feature requirements. M&A activity in the space is relatively modest, with xx deals recorded between 2019 and 2024, reflecting a trend towards strategic partnerships and organic growth.
- Market Concentration: Moderate, with top 5 players holding approximately xx% market share in 2024.
- Technological Innovation: Focus on improved processing power, enhanced durability (water, shock, dust resistance), and advanced connectivity (5G, satellite).
- Regulatory Frameworks: Compliance with data security standards (e.g., HIPAA, GDPR) and industry-specific regulations significantly impacts adoption.
- Competitive Substitutes: Specialized laptops, handheld devices, and custom solutions compete based on specific application requirements.
- End-User Demographics: Manufacturing, energy, logistics, and government agencies are key end-user segments, each demanding specialized features.
- M&A Trends: xx M&A deals between 2019 and 2024 indicate a preference for organic growth and strategic collaborations rather than large-scale acquisitions.
Tablet PC Industry Growth Trends & Insights
The Tablet PC market demonstrates a complex growth trajectory. While the consumer segment exhibits maturity, the ruggedized and specialized sectors show significant growth potential. The market size expanded from xx million units in 2019 to xx million units in 2024, projecting a CAGR of xx% during the historical period. Adoption rates are particularly high in industries requiring robust devices, with significant growth expected in regions with expanding infrastructure projects and a focus on digital transformation. Technological disruptions, such as the introduction of 5G and improved battery technologies, are accelerating adoption. Consumer behavior shifts toward increased mobility and remote work further fuel market expansion. This is further enhanced by the growing demand for robust, versatile and secure devices across various industries. Market penetration within key sectors remains relatively low, creating significant growth opportunities.
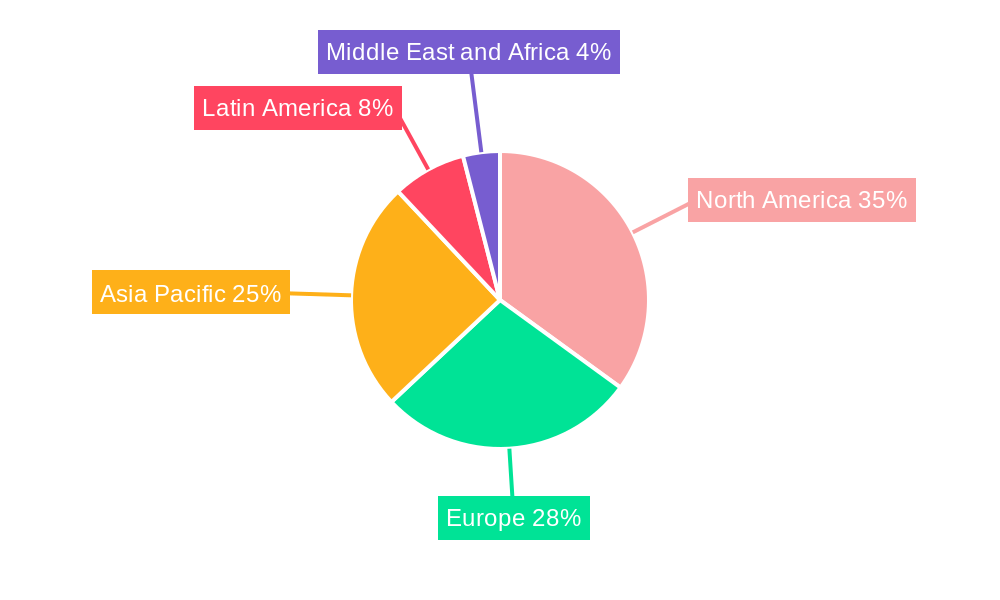
Dominant Regions, Countries, or Segments in Tablet PC Industry
North America and Europe currently dominate the Tablet PC market, driven by strong demand from the manufacturing, transportation, and energy sectors. However, Asia-Pacific is projected to experience the fastest growth in the forecast period due to rising infrastructure spending and industrialization. Within segments, fully rugged tablets maintain the largest market share, followed by semi-rugged and ultra-rugged models. The Windows operating system continues to dominate the market; however, Android is gaining traction in specific niche applications. The manufacturing, energy and power, and transportation and logistics sectors are currently the largest end-user industries.
Key Drivers:
- North America & Europe: Established industrial infrastructure, high technological adoption rates, and stringent regulatory requirements.
- Asia-Pacific: Rapid industrialization, substantial infrastructure development, and increasing government investments in digitalization.
- Fully Rugged Tablets: Superior durability and reliability critical for demanding field applications.
- Windows OS: Established ecosystem of software and applications caters to business needs.
- Manufacturing, Energy & Logistics: High demand for durable, data-capable devices for field operations and data collection.
Dominance Factors:
- Market Share: North America and Europe hold the largest market share currently, followed by Asia-Pacific which shows the highest growth potential.
- Growth Potential: Asia-Pacific exhibits the highest growth potential due to its developing infrastructure and industrial expansion.
Tablet PC Industry Product Landscape
The Tablet PC market showcases a diverse product landscape. Products range from compact, lightweight semi-rugged tablets suitable for office and light fieldwork to extremely robust ultra-rugged models designed to withstand extreme environments. Key features include advanced processing power (Intel Core processors, etc.), high-resolution sunlight-readable displays, and enhanced connectivity options. Unique selling propositions include specialized features for specific industries (e.g., thermal imaging for maintenance, GPS tracking for logistics). Technological advancements focus on increased durability, longer battery life, and improved security features.
Key Drivers, Barriers & Challenges in Tablet PC Industry
Key Drivers:
- Increasing demand for mobile computing solutions across various industries.
- Technological advancements leading to more robust and versatile devices.
- Growing need for data capture and real-time analytics in the field.
- Government initiatives promoting digital transformation and infrastructure development.
Key Challenges:
- High initial investment costs can limit adoption in smaller businesses.
- Supply chain disruptions can impact production and availability.
- Intense competition necessitates constant product innovation and cost optimization.
- Regulatory compliance in different regions adds to complexity and cost.
Emerging Opportunities in Tablet PC Industry
- Expansion into untapped markets, particularly in developing economies.
- Development of specialized applications for specific industries (e.g., healthcare, agriculture).
- Integration of advanced technologies like AI and machine learning for enhanced functionality.
- Growing demand for secure and ruggedized devices for remote workers and field services.
Growth Accelerators in the Tablet PC Industry
Technological innovation, strategic partnerships, and market expansion strategies are critical for accelerating growth. Development of lighter, more powerful, and energy-efficient devices will be key. Strategic collaborations between hardware and software providers will enhance functionality and expand market reach. Focus on emerging markets and specific niche applications will unlock significant growth potential.
Key Players Shaping the Tablet PC Industry Market
- NEXCOM International Co Ltd
- Durabook (Twinhead International)
- Getac Technology Corporation
- RuggON Corporation
- Bartec GmbH
- Mobile Worxs
- Samsung Electronics Co Ltd
- Siemens AG
- Mobile Demand LLC
- Winmate Inc
- Zebra Technologies Corp
- Advantech Corporation
- AAEON Technology Inc
- ARBOR Technology Co Ltd
- Panasonic Corporation
- Dell Technologies
Notable Milestones in Tablet PC Industry Sector
- September 2022: Durabook launches the R8, an 8" fully rugged tablet featuring 12th generation Intel Core processors.
- August 2022: Juniper Systems announces the Mesa Pro Rugged Tablet, expanding its offerings to the 10-inch segment.
In-Depth Tablet PC Industry Market Outlook
The Tablet PC market is poised for continued growth, driven by technological advancements, increasing adoption across various sectors, and the expansion into new markets. Strategic investments in research and development, coupled with effective marketing and distribution strategies, will be crucial for success. The focus on specialized applications and tailored solutions will determine market leadership in the coming years. The long-term outlook is positive, with significant potential for market expansion and increased market penetration.
Tablet PC Industry Segmentation
-
1. Type
- 1.1. Fully Rugged
- 1.2. Semi-Rugged
- 1.3. Ultra Rugged
-
2. Operating System
- 2.1. Windows
- 2.2. Android
-
3. End-User Industry
- 3.1. Manufacturing
- 3.2. Energy and Power
- 3.3. Oil and Gas
- 3.4. Transportation and Logistics
- 3.5. Automotive
- 3.6. Agriculture and Farming
- 3.7. Other End-User Industries
Tablet PC Industry Segmentation By Geography
- 1. North America
- 2. Europe
- 3. Asia Pacific
- 4. Latin America
- 5. Middle East and Africa
Tablet PC Industry Regional Market Share
Geographic Coverage of Tablet PC Industry
Tablet PC Industry REPORT HIGHLIGHTS
| Aspects | Details |
|---|---|
| Study Period | 2020-2034 |
| Base Year | 2025 |
| Estimated Year | 2026 |
| Forecast Period | 2026-2034 |
| Historical Period | 2020-2025 |
| Growth Rate | CAGR of 6.38% from 2020-2034 |
| Segmentation |
|
Table of Contents
- 1. Introduction
- 1.1. Research Scope
- 1.2. Market Segmentation
- 1.3. Research Objective
- 1.4. Definitions and Assumptions
- 2. Executive Summary
- 2.1. Market Snapshot
- 3. Market Dynamics
- 3.1. Market Drivers
- 3.2. Market Restrains
- 3.3. Market Trends
- 3.4. Market Opportunities
- 4. Market Factor Analysis
- 4.1. Porters Five Forces
- 4.1.1. Bargaining Power of Suppliers
- 4.1.2. Bargaining Power of Buyers
- 4.1.3. Threat of New Entrants
- 4.1.4. Threat of Substitutes
- 4.1.5. Competitive Rivalry
- 4.2. PESTEL analysis
- 4.3. BCG Analysis
- 4.3.1. Stars (High Growth, High Market Share)
- 4.3.2. Cash Cows (Low Growth, High Market Share)
- 4.3.3. Question Mark (High Growth, Low Market Share)
- 4.3.4. Dogs (Low Growth, Low Market Share)
- 4.4. Ansoff Matrix Analysis
- 4.5. Supply Chain Analysis
- 4.6. Regulatory Landscape
- 4.7. Current Market Potential and Opportunity Assessment (TAM–SAM–SOM Framework)
- 4.8. NRP Analyst Note
- 4.1. Porters Five Forces
- 5. Market Analysis, Insights and Forecast 2021-2033
- 5.1. Market Analysis, Insights and Forecast - by Type
- 5.1.1. Fully Rugged
- 5.1.2. Semi-Rugged
- 5.1.3. Ultra Rugged
- 5.2. Market Analysis, Insights and Forecast - by Operating System
- 5.2.1. Windows
- 5.2.2. Android
- 5.3. Market Analysis, Insights and Forecast - by End-User Industry
- 5.3.1. Manufacturing
- 5.3.2. Energy and Power
- 5.3.3. Oil and Gas
- 5.3.4. Transportation and Logistics
- 5.3.5. Automotive
- 5.3.6. Agriculture and Farming
- 5.3.7. Other End-User Industries
- 5.4. Market Analysis, Insights and Forecast - by Region
- 5.4.1. North America
- 5.4.2. Europe
- 5.4.3. Asia Pacific
- 5.4.4. Latin America
- 5.4.5. Middle East and Africa
- 5.1. Market Analysis, Insights and Forecast - by Type
- 6. Global Tablet PC Industry Analysis, Insights and Forecast, 2021-2033
- 6.1. Market Analysis, Insights and Forecast - by Type
- 6.1.1. Fully Rugged
- 6.1.2. Semi-Rugged
- 6.1.3. Ultra Rugged
- 6.2. Market Analysis, Insights and Forecast - by Operating System
- 6.2.1. Windows
- 6.2.2. Android
- 6.3. Market Analysis, Insights and Forecast - by End-User Industry
- 6.3.1. Manufacturing
- 6.3.2. Energy and Power
- 6.3.3. Oil and Gas
- 6.3.4. Transportation and Logistics
- 6.3.5. Automotive
- 6.3.6. Agriculture and Farming
- 6.3.7. Other End-User Industries
- 6.1. Market Analysis, Insights and Forecast - by Type
- 7. North America Tablet PC Industry Analysis, Insights and Forecast, 2020-2032
- 7.1. Market Analysis, Insights and Forecast - by Type
- 7.1.1. Fully Rugged
- 7.1.2. Semi-Rugged
- 7.1.3. Ultra Rugged
- 7.2. Market Analysis, Insights and Forecast - by Operating System
- 7.2.1. Windows
- 7.2.2. Android
- 7.3. Market Analysis, Insights and Forecast - by End-User Industry
- 7.3.1. Manufacturing
- 7.3.2. Energy and Power
- 7.3.3. Oil and Gas
- 7.3.4. Transportation and Logistics
- 7.3.5. Automotive
- 7.3.6. Agriculture and Farming
- 7.3.7. Other End-User Industries
- 7.1. Market Analysis, Insights and Forecast - by Type
- 8. Europe Tablet PC Industry Analysis, Insights and Forecast, 2020-2032
- 8.1. Market Analysis, Insights and Forecast - by Type
- 8.1.1. Fully Rugged
- 8.1.2. Semi-Rugged
- 8.1.3. Ultra Rugged
- 8.2. Market Analysis, Insights and Forecast - by Operating System
- 8.2.1. Windows
- 8.2.2. Android
- 8.3. Market Analysis, Insights and Forecast - by End-User Industry
- 8.3.1. Manufacturing
- 8.3.2. Energy and Power
- 8.3.3. Oil and Gas
- 8.3.4. Transportation and Logistics
- 8.3.5. Automotive
- 8.3.6. Agriculture and Farming
- 8.3.7. Other End-User Industries
- 8.1. Market Analysis, Insights and Forecast - by Type
- 9. Asia Pacific Tablet PC Industry Analysis, Insights and Forecast, 2020-2032
- 9.1. Market Analysis, Insights and Forecast - by Type
- 9.1.1. Fully Rugged
- 9.1.2. Semi-Rugged
- 9.1.3. Ultra Rugged
- 9.2. Market Analysis, Insights and Forecast - by Operating System
- 9.2.1. Windows
- 9.2.2. Android
- 9.3. Market Analysis, Insights and Forecast - by End-User Industry
- 9.3.1. Manufacturing
- 9.3.2. Energy and Power
- 9.3.3. Oil and Gas
- 9.3.4. Transportation and Logistics
- 9.3.5. Automotive
- 9.3.6. Agriculture and Farming
- 9.3.7. Other End-User Industries
- 9.1. Market Analysis, Insights and Forecast - by Type
- 10. Latin America Tablet PC Industry Analysis, Insights and Forecast, 2020-2032
- 10.1. Market Analysis, Insights and Forecast - by Type
- 10.1.1. Fully Rugged
- 10.1.2. Semi-Rugged
- 10.1.3. Ultra Rugged
- 10.2. Market Analysis, Insights and Forecast - by Operating System
- 10.2.1. Windows
- 10.2.2. Android
- 10.3. Market Analysis, Insights and Forecast - by End-User Industry
- 10.3.1. Manufacturing
- 10.3.2. Energy and Power
- 10.3.3. Oil and Gas
- 10.3.4. Transportation and Logistics
- 10.3.5. Automotive
- 10.3.6. Agriculture and Farming
- 10.3.7. Other End-User Industries
- 10.1. Market Analysis, Insights and Forecast - by Type
- 11. Middle East and Africa Tablet PC Industry Analysis, Insights and Forecast, 2020-2032
- 11.1. Market Analysis, Insights and Forecast - by Type
- 11.1.1. Fully Rugged
- 11.1.2. Semi-Rugged
- 11.1.3. Ultra Rugged
- 11.2. Market Analysis, Insights and Forecast - by Operating System
- 11.2.1. Windows
- 11.2.2. Android
- 11.3. Market Analysis, Insights and Forecast - by End-User Industry
- 11.3.1. Manufacturing
- 11.3.2. Energy and Power
- 11.3.3. Oil and Gas
- 11.3.4. Transportation and Logistics
- 11.3.5. Automotive
- 11.3.6. Agriculture and Farming
- 11.3.7. Other End-User Industries
- 11.1. Market Analysis, Insights and Forecast - by Type
- 12. Competitive Analysis
- 12.1. Company Profiles
- 12.1.1 NEXCOM International Co Ltd
- 12.1.1.1. Company Overview
- 12.1.1.2. Products
- 12.1.1.3. Company Financials
- 12.1.1.4. SWOT Analysis
- 12.1.2 Durabook (Twinhead International)
- 12.1.2.1. Company Overview
- 12.1.2.2. Products
- 12.1.2.3. Company Financials
- 12.1.2.4. SWOT Analysis
- 12.1.3 Getac Technology Corporation
- 12.1.3.1. Company Overview
- 12.1.3.2. Products
- 12.1.3.3. Company Financials
- 12.1.3.4. SWOT Analysis
- 12.1.4 RuggON Corporation
- 12.1.4.1. Company Overview
- 12.1.4.2. Products
- 12.1.4.3. Company Financials
- 12.1.4.4. SWOT Analysis
- 12.1.5 Bartec GmbH
- 12.1.5.1. Company Overview
- 12.1.5.2. Products
- 12.1.5.3. Company Financials
- 12.1.5.4. SWOT Analysis
- 12.1.6 Mobile Worxs*List Not Exhaustive
- 12.1.6.1. Company Overview
- 12.1.6.2. Products
- 12.1.6.3. Company Financials
- 12.1.6.4. SWOT Analysis
- 12.1.7 Samsung Electronics Co Ltd
- 12.1.7.1. Company Overview
- 12.1.7.2. Products
- 12.1.7.3. Company Financials
- 12.1.7.4. SWOT Analysis
- 12.1.8 Siemens AG
- 12.1.8.1. Company Overview
- 12.1.8.2. Products
- 12.1.8.3. Company Financials
- 12.1.8.4. SWOT Analysis
- 12.1.9 Mobile Demand LLC
- 12.1.9.1. Company Overview
- 12.1.9.2. Products
- 12.1.9.3. Company Financials
- 12.1.9.4. SWOT Analysis
- 12.1.10 Winmate Inc
- 12.1.10.1. Company Overview
- 12.1.10.2. Products
- 12.1.10.3. Company Financials
- 12.1.10.4. SWOT Analysis
- 12.1.11 Zebra Technologies Corp
- 12.1.11.1. Company Overview
- 12.1.11.2. Products
- 12.1.11.3. Company Financials
- 12.1.11.4. SWOT Analysis
- 12.1.12 Advantech Corporation
- 12.1.12.1. Company Overview
- 12.1.12.2. Products
- 12.1.12.3. Company Financials
- 12.1.12.4. SWOT Analysis
- 12.1.13 AAEON Technology Inc
- 12.1.13.1. Company Overview
- 12.1.13.2. Products
- 12.1.13.3. Company Financials
- 12.1.13.4. SWOT Analysis
- 12.1.14 ARBOR Technology Co Ltd
- 12.1.14.1. Company Overview
- 12.1.14.2. Products
- 12.1.14.3. Company Financials
- 12.1.14.4. SWOT Analysis
- 12.1.15 Panasonic Corporation
- 12.1.15.1. Company Overview
- 12.1.15.2. Products
- 12.1.15.3. Company Financials
- 12.1.15.4. SWOT Analysis
- 12.1.16 Dell Technologies
- 12.1.16.1. Company Overview
- 12.1.16.2. Products
- 12.1.16.3. Company Financials
- 12.1.16.4. SWOT Analysis
- 12.1.1 NEXCOM International Co Ltd
- 12.2. Market Entropy
- 12.2.1 Company's Key Areas Served
- 12.2.2 Recent Developments
- 12.3. Company Market Share Analysis 2025
- 12.3.1 Top 5 Companies Market Share Analysis
- 12.3.2 Top 3 Companies Market Share Analysis
- 12.4. List of Potential Customers
- 13. Research Methodology
List of Figures
- Figure 1: Global Tablet PC Industry Revenue Breakdown (Million, %) by Region 2025 & 2033
- Figure 2: North America Tablet PC Industry Revenue (Million), by Type 2025 & 2033
- Figure 3: North America Tablet PC Industry Revenue Share (%), by Type 2025 & 2033
- Figure 4: North America Tablet PC Industry Revenue (Million), by Operating System 2025 & 2033
- Figure 5: North America Tablet PC Industry Revenue Share (%), by Operating System 2025 & 2033
- Figure 6: North America Tablet PC Industry Revenue (Million), by End-User Industry 2025 & 2033
- Figure 7: North America Tablet PC Industry Revenue Share (%), by End-User Industry 2025 & 2033
- Figure 8: North America Tablet PC Industry Revenue (Million), by Country 2025 & 2033
- Figure 9: North America Tablet PC Industry Revenue Share (%), by Country 2025 & 2033
- Figure 10: Europe Tablet PC Industry Revenue (Million), by Type 2025 & 2033
- Figure 11: Europe Tablet PC Industry Revenue Share (%), by Type 2025 & 2033
- Figure 12: Europe Tablet PC Industry Revenue (Million), by Operating System 2025 & 2033
- Figure 13: Europe Tablet PC Industry Revenue Share (%), by Operating System 2025 & 2033
- Figure 14: Europe Tablet PC Industry Revenue (Million), by End-User Industry 2025 & 2033
- Figure 15: Europe Tablet PC Industry Revenue Share (%), by End-User Industry 2025 & 2033
- Figure 16: Europe Tablet PC Industry Revenue (Million), by Country 2025 & 2033
- Figure 17: Europe Tablet PC Industry Revenue Share (%), by Country 2025 & 2033
- Figure 18: Asia Pacific Tablet PC Industry Revenue (Million), by Type 2025 & 2033
- Figure 19: Asia Pacific Tablet PC Industry Revenue Share (%), by Type 2025 & 2033
- Figure 20: Asia Pacific Tablet PC Industry Revenue (Million), by Operating System 2025 & 2033
- Figure 21: Asia Pacific Tablet PC Industry Revenue Share (%), by Operating System 2025 & 2033
- Figure 22: Asia Pacific Tablet PC Industry Revenue (Million), by End-User Industry 2025 & 2033
- Figure 23: Asia Pacific Tablet PC Industry Revenue Share (%), by End-User Industry 2025 & 2033
- Figure 24: Asia Pacific Tablet PC Industry Revenue (Million), by Country 2025 & 2033
- Figure 25: Asia Pacific Tablet PC Industry Revenue Share (%), by Country 2025 & 2033
- Figure 26: Latin America Tablet PC Industry Revenue (Million), by Type 2025 & 2033
- Figure 27: Latin America Tablet PC Industry Revenue Share (%), by Type 2025 & 2033
- Figure 28: Latin America Tablet PC Industry Revenue (Million), by Operating System 2025 & 2033
- Figure 29: Latin America Tablet PC Industry Revenue Share (%), by Operating System 2025 & 2033
- Figure 30: Latin America Tablet PC Industry Revenue (Million), by End-User Industry 2025 & 2033
- Figure 31: Latin America Tablet PC Industry Revenue Share (%), by End-User Industry 2025 & 2033
- Figure 32: Latin America Tablet PC Industry Revenue (Million), by Country 2025 & 2033
- Figure 33: Latin America Tablet PC Industry Revenue Share (%), by Country 2025 & 2033
- Figure 34: Middle East and Africa Tablet PC Industry Revenue (Million), by Type 2025 & 2033
- Figure 35: Middle East and Africa Tablet PC Industry Revenue Share (%), by Type 2025 & 2033
- Figure 36: Middle East and Africa Tablet PC Industry Revenue (Million), by Operating System 2025 & 2033
- Figure 37: Middle East and Africa Tablet PC Industry Revenue Share (%), by Operating System 2025 & 2033
- Figure 38: Middle East and Africa Tablet PC Industry Revenue (Million), by End-User Industry 2025 & 2033
- Figure 39: Middle East and Africa Tablet PC Industry Revenue Share (%), by End-User Industry 2025 & 2033
- Figure 40: Middle East and Africa Tablet PC Industry Revenue (Million), by Country 2025 & 2033
- Figure 41: Middle East and Africa Tablet PC Industry Revenue Share (%), by Country 2025 & 2033
List of Tables
- Table 1: Global Tablet PC Industry Revenue Million Forecast, by Type 2020 & 2033
- Table 2: Global Tablet PC Industry Revenue Million Forecast, by Operating System 2020 & 2033
- Table 3: Global Tablet PC Industry Revenue Million Forecast, by End-User Industry 2020 & 2033
- Table 4: Global Tablet PC Industry Revenue Million Forecast, by Region 2020 & 2033
- Table 5: Global Tablet PC Industry Revenue Million Forecast, by Type 2020 & 2033
- Table 6: Global Tablet PC Industry Revenue Million Forecast, by Operating System 2020 & 2033
- Table 7: Global Tablet PC Industry Revenue Million Forecast, by End-User Industry 2020 & 2033
- Table 8: Global Tablet PC Industry Revenue Million Forecast, by Country 2020 & 2033
- Table 9: Global Tablet PC Industry Revenue Million Forecast, by Type 2020 & 2033
- Table 10: Global Tablet PC Industry Revenue Million Forecast, by Operating System 2020 & 2033
- Table 11: Global Tablet PC Industry Revenue Million Forecast, by End-User Industry 2020 & 2033
- Table 12: Global Tablet PC Industry Revenue Million Forecast, by Country 2020 & 2033
- Table 13: Global Tablet PC Industry Revenue Million Forecast, by Type 2020 & 2033
- Table 14: Global Tablet PC Industry Revenue Million Forecast, by Operating System 2020 & 2033
- Table 15: Global Tablet PC Industry Revenue Million Forecast, by End-User Industry 2020 & 2033
- Table 16: Global Tablet PC Industry Revenue Million Forecast, by Country 2020 & 2033
- Table 17: Global Tablet PC Industry Revenue Million Forecast, by Type 2020 & 2033
- Table 18: Global Tablet PC Industry Revenue Million Forecast, by Operating System 2020 & 2033
- Table 19: Global Tablet PC Industry Revenue Million Forecast, by End-User Industry 2020 & 2033
- Table 20: Global Tablet PC Industry Revenue Million Forecast, by Country 2020 & 2033
- Table 21: Global Tablet PC Industry Revenue Million Forecast, by Type 2020 & 2033
- Table 22: Global Tablet PC Industry Revenue Million Forecast, by Operating System 2020 & 2033
- Table 23: Global Tablet PC Industry Revenue Million Forecast, by End-User Industry 2020 & 2033
- Table 24: Global Tablet PC Industry Revenue Million Forecast, by Country 2020 & 2033
Frequently Asked Questions
1. What is the projected Compound Annual Growth Rate (CAGR) of the Tablet PC Industry?
The projected CAGR is approximately 6.38%.
2. Which companies are prominent players in the Tablet PC Industry?
Key companies in the market include NEXCOM International Co Ltd, Durabook (Twinhead International), Getac Technology Corporation, RuggON Corporation, Bartec GmbH, Mobile Worxs*List Not Exhaustive, Samsung Electronics Co Ltd, Siemens AG, Mobile Demand LLC, Winmate Inc, Zebra Technologies Corp, Advantech Corporation, AAEON Technology Inc, ARBOR Technology Co Ltd, Panasonic Corporation, Dell Technologies.
3. What are the main segments of the Tablet PC Industry?
The market segments include Type, Operating System, End-User Industry.
4. Can you provide details about the market size?
The market size is estimated to be USD 1.05 Million as of 2022.
5. What are some drivers contributing to market growth?
Increased Demand for Rugged Industrial Handheld Computing Devices in Manufacturing Sector; Product Innovation and Design Robustness.
6. What are the notable trends driving market growth?
Transport & Logistics Holds Significant Share in Industrial Tablet PC Market.
7. Are there any restraints impacting market growth?
Shorter Operating Range of WiGig Products.
8. Can you provide examples of recent developments in the market?
September 2022: Durabook, the rugged mobile solutions provider owned by Twinhead International Corporation, announced the launch of its R8, an 8" fully rugged tablet featuring 12th generation Intel Core processors for powerful performance. It is designed to meet the increasing demands of field service workers operating across some of the most challenging sectors, including manufacturing, transportation, logistics, field services, and utility industries, as well as law enforcement departments and government agencies.
9. What pricing options are available for accessing the report?
Pricing options include single-user, multi-user, and enterprise licenses priced at USD 4750, USD 5250, and USD 8750 respectively.
10. Is the market size provided in terms of value or volume?
The market size is provided in terms of value, measured in Million.
11. Are there any specific market keywords associated with the report?
Yes, the market keyword associated with the report is "Tablet PC Industry," which aids in identifying and referencing the specific market segment covered.
12. How do I determine which pricing option suits my needs best?
The pricing options vary based on user requirements and access needs. Individual users may opt for single-user licenses, while businesses requiring broader access may choose multi-user or enterprise licenses for cost-effective access to the report.
13. Are there any additional resources or data provided in the Tablet PC Industry report?
While the report offers comprehensive insights, it's advisable to review the specific contents or supplementary materials provided to ascertain if additional resources or data are available.
14. How can I stay updated on further developments or reports in the Tablet PC Industry?
To stay informed about further developments, trends, and reports in the Tablet PC Industry, consider subscribing to industry newsletters, following relevant companies and organizations, or regularly checking reputable industry news sources and publications.
Methodology
Step 1 - Identification of Relevant Samples Size from Population Database


Step 2 - Approaches for Defining Global Market Size (Value, Volume* & Price*)

Note*: In applicable scenarios
Step 3 - Data Sources
Primary Research
- Web Analytics
- Survey Reports
- Research Institute
- Latest Research Reports
- Opinion Leaders
Secondary Research
- Annual Reports
- White Paper
- Latest Press Release
- Industry Association
- Paid Database
- Investor Presentations

Step 4 - Data Triangulation
Involves using different sources of information in order to increase the validity of a study
These sources are likely to be stakeholders in a program - participants, other researchers, program staff, other community members, and so on.
Then we put all data in single framework & apply various statistical tools to find out the dynamic on the market.
During the analysis stage, feedback from the stakeholder groups would be compared to determine areas of agreement as well as areas of divergence