

Key Insights
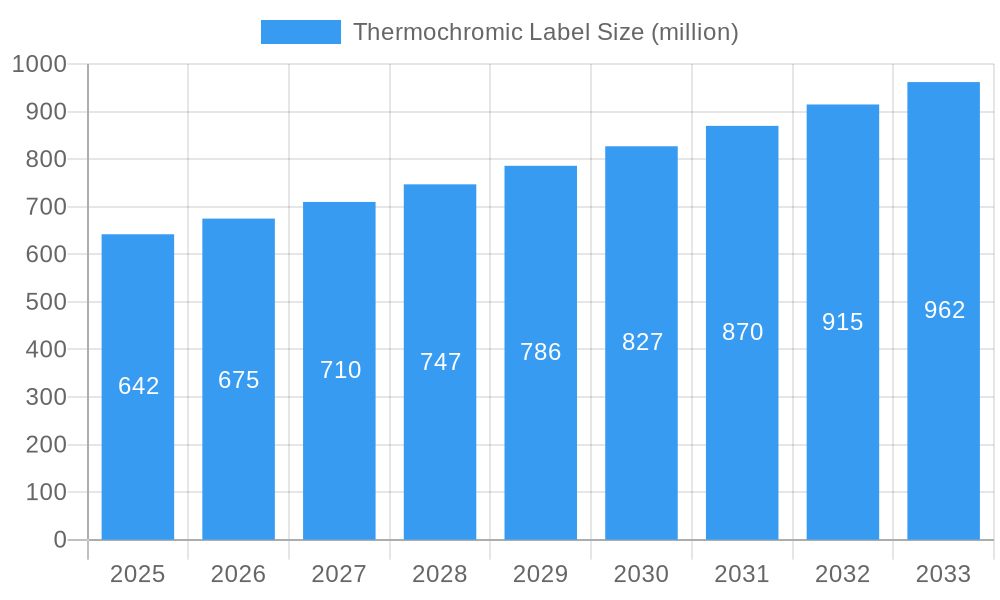
The thermochromic label market, valued at $642 million in 2025, is projected to experience robust growth, driven by increasing demand across diverse sectors. The Compound Annual Growth Rate (CAGR) of 5.1% from 2025 to 2033 indicates a significant expansion potential. This growth is fueled by several key factors. Firstly, the rising adoption of thermochromic labels in temperature-sensitive product packaging enhances product safety and brand trust, particularly in the food and pharmaceutical industries. Secondly, the growing consumer awareness of product authenticity and the need for anti-counterfeiting measures boosts the demand for security features offered by these labels. Furthermore, advancements in thermochromic ink technology, leading to improved color clarity, durability, and wider application possibilities, are contributing to market expansion. Companies like Siltech, B&H Colour Change, and Multi-Color Corporation are key players, continually innovating and expanding their product offerings to cater to evolving market needs. Geographical expansion into emerging markets with increasing disposable income and demand for sophisticated packaging solutions also presents substantial growth opportunities.
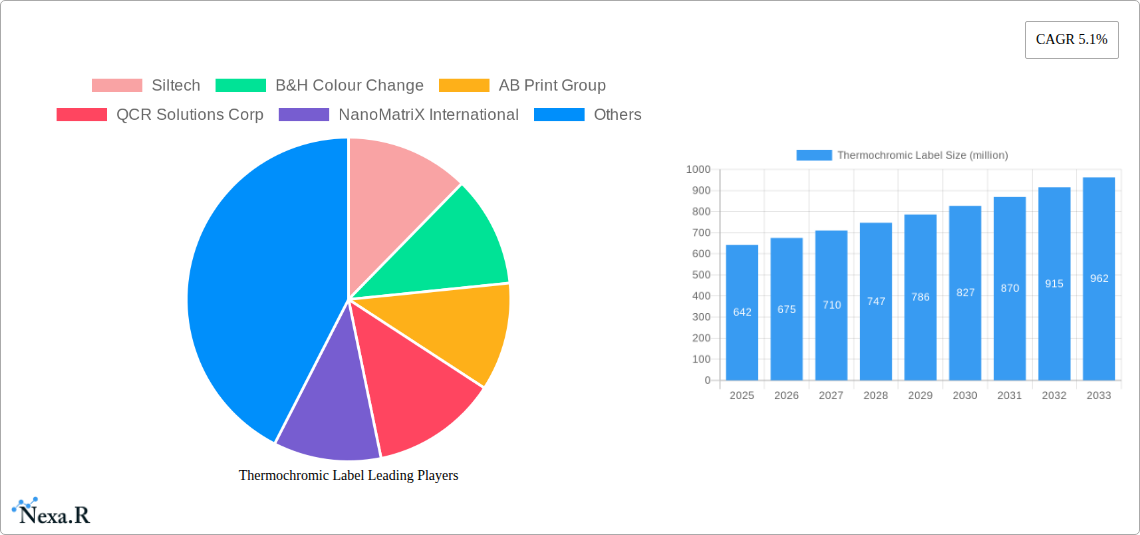
Thermochromic Label Market Size (In Million)
However, certain challenges remain. The relatively higher cost of thermochromic labels compared to conventional labels might restrict widespread adoption, especially in price-sensitive markets. Furthermore, the need for specialized printing techniques and equipment could pose a barrier to entry for smaller players. Despite these restraints, the overall market outlook remains positive, with strong growth anticipated across various segments, driven by continuous technological advancements and the increasing demand for enhanced product security and brand protection in a competitive marketplace. The forecast period of 2025-2033 promises further market consolidation and innovation, ultimately benefiting both producers and consumers.
Thermochromic Label Company Market Share
This comprehensive report provides a detailed analysis of the global thermochromic label market, encompassing market dynamics, growth trends, regional insights, competitive landscape, and future outlook. The study period covers 2019-2033, with 2025 as the base year and estimated year. The forecast period spans 2025-2033, and the historical period includes 2019-2024. This report is crucial for industry professionals, investors, and strategists seeking to understand and capitalize on the opportunities within this dynamic market. The report utilizes data from various sources and analysis to provide concrete and actionable insights.
Thermochromic Label Market Dynamics & Structure
This section analyzes the market's competitive landscape, technological advancements, regulatory influences, and market trends, offering a comprehensive understanding of the thermochromic label industry's structure. The global thermochromic label market, estimated at xx million units in 2025, is characterized by moderate concentration with key players holding significant market share. The market is witnessing considerable technological innovation, particularly in the development of improved color-changing materials and printing techniques. Stringent regulatory frameworks regarding label materials and safety are influencing market dynamics, along with the emergence of competitive substitutes such as other temperature-sensitive labeling technologies. End-user demographics are shifting, with increasing demand from diverse industries.
- Market Concentration: Moderately concentrated, with top 5 players holding approximately xx% of market share in 2025.
- Technological Innovation: Focus on enhancing color change speed, durability, and color range of thermochromic inks.
- Regulatory Framework: Compliance with food safety regulations and environmental standards is crucial.
- Competitive Substitutes: Pressure from alternative technologies like pressure-sensitive and colorimetric indicators.
- End-User Demographics: Growing demand across food & beverage, pharmaceuticals, logistics, and personal care.
- M&A Trends: xx M&A deals recorded between 2019 and 2024, indicating consolidation within the market.
Thermochromic Label Growth Trends & Insights
The global thermochromic label market is experiencing substantial growth, driven by factors such as increasing demand for tamper-evident packaging, rising consumer awareness of product freshness, and technological advancements leading to enhanced product performance. The market size has shown a compound annual growth rate (CAGR) of xx% during the historical period (2019-2024) and is projected to grow at a CAGR of xx% during the forecast period (2025-2033), reaching xx million units by 2033. This growth is fueled by increasing adoption rates across various industries, particularly in emerging economies. Technological disruptions in ink formulation and printing techniques are further accelerating market expansion. Changing consumer behavior, with a growing preference for convenient and informative packaging, is another key driver. Market penetration in key segments remains relatively low, indicating significant growth potential.
Dominant Regions, Countries, or Segments in Thermochromic Label
North America currently holds the largest market share in the global thermochromic label market, followed by Europe and Asia-Pacific. This dominance is attributed to several factors, including robust industrial infrastructure, high consumer spending, and early adoption of innovative technologies. However, Asia-Pacific is poised for significant growth due to expanding manufacturing sectors and rising disposable incomes.
- North America: Strong established market with high adoption rates across various industries.
- Europe: Significant market presence, driven by demand from the food and beverage sector.
- Asia-Pacific: High growth potential due to rapid industrialization and increasing consumer demand.
- Key Drivers: Government initiatives promoting sustainable packaging, advancements in printing technologies, and rising awareness of product safety.
Thermochromic Label Product Landscape
Thermochromic labels are evolving beyond simple temperature indicators. Innovations focus on improving color change reversibility, enhancing color vibrancy, and expanding applications. New product developments include labels with multiple color transitions, extended temperature ranges, and enhanced durability. These advancements are driving market growth by providing more sophisticated and reliable solutions for various applications. Unique selling propositions include improved accuracy, longer shelf life, and enhanced consumer experience.
Key Drivers, Barriers & Challenges in Thermochromic Label
Key Drivers: The market is propelled by the growing need for tamper-evident packaging, increasing demand for product freshness indicators, and advancements in thermochromic ink technology. Government regulations promoting sustainable packaging also contribute to market growth. The rising popularity of e-commerce and the demand for secure delivery of temperature-sensitive products also boost demand.
Key Challenges: High initial investment costs, limitations in color range and durability of certain thermochromic inks, and supply chain disruptions are significant challenges. Regulatory compliance and competition from other labeling technologies create further pressures. The impact of these challenges is estimated to reduce market growth by approximately xx% in the forecast period.
Emerging Opportunities in Thermochromic Label
Untapped markets such as the healthcare and logistics sectors represent significant growth opportunities. Innovative applications, such as integrated security features and personalized labels, are attracting increasing interest. Evolving consumer preferences toward eco-friendly packaging materials present further opportunities.
Growth Accelerators in the Thermochromic Label Industry
Technological breakthroughs in ink formulations, expansion of application areas to new industries, strategic partnerships between label manufacturers and technology providers, and effective marketing strategies focused on product benefits are key factors driving long-term growth in the thermochromic label industry.
Key Players Shaping the Thermochromic Label Market
- Siltech
- B&H Colour Change
- AB Print Group
- QCR Solutions Corp
- NanoMatriX International
- Hammer Packaging
- Multi-Color Corporation
- Eltronis
- Derksen
- E. TEXTINT
- CTI
- Pakmarkas
- Graficas Varias
- Gravic Group
- Aro Group
Notable Milestones in Thermochromic Label Sector
- 2020: Introduction of a new generation of thermochromic inks with enhanced durability by Siltech.
- 2022: Multi-Color Corporation acquires a smaller thermochromic label manufacturer, expanding its market presence.
- 2023: Several companies launch new thermochromic labels with integrated RFID technology for enhanced supply chain management.
In-Depth Thermochromic Label Market Outlook
The thermochromic label market is expected to witness sustained growth driven by continuous innovation, expansion into new markets, and the increasing need for secure and informative product packaging. Strategic partnerships and investments in research and development will play a pivotal role in shaping the future of this market. The potential for integration with other technologies like smart packaging solutions further enhances the market's long-term outlook.
Thermochromic Label Segmentation
-
1. Application
- 1.1. Pharmaceutical
- 1.2. Food and Beverages
- 1.3. Cosmetics
- 1.4. Others
-
2. Type
- 2.1. Reversible
- 2.2. Irreversible
Thermochromic Label Segmentation By Geography
-
1. North America
- 1.1. United States
- 1.2. Canada
- 1.3. Mexico
-
2. South America
- 2.1. Brazil
- 2.2. Argentina
- 2.3. Rest of South America
-
3. Europe
- 3.1. United Kingdom
- 3.2. Germany
- 3.3. France
- 3.4. Italy
- 3.5. Spain
- 3.6. Russia
- 3.7. Benelux
- 3.8. Nordics
- 3.9. Rest of Europe
-
4. Middle East & Africa
- 4.1. Turkey
- 4.2. Israel
- 4.3. GCC
- 4.4. North Africa
- 4.5. South Africa
- 4.6. Rest of Middle East & Africa
-
5. Asia Pacific
- 5.1. China
- 5.2. India
- 5.3. Japan
- 5.4. South Korea
- 5.5. ASEAN
- 5.6. Oceania
- 5.7. Rest of Asia Pacific

Thermochromic Label Regional Market Share
Geographic Coverage of Thermochromic Label
Thermochromic Label REPORT HIGHLIGHTS
| Aspects | Details |
|---|---|
| Study Period | 2020-2034 |
| Base Year | 2025 |
| Estimated Year | 2026 |
| Forecast Period | 2026-2034 |
| Historical Period | 2020-2025 |
| Growth Rate | CAGR of 7% from 2020-2034 |
| Segmentation |
|
Table of Contents
- 1. Introduction
- 1.1. Research Scope
- 1.2. Market Segmentation
- 1.3. Research Methodology
- 1.4. Definitions and Assumptions
- 2. Executive Summary
- 2.1. Introduction
- 3. Market Dynamics
- 3.1. Introduction
- 3.2. Market Drivers
- 3.3. Market Restrains
- 3.4. Market Trends
- 4. Market Factor Analysis
- 4.1. Porters Five Forces
- 4.2. Supply/Value Chain
- 4.3. PESTEL analysis
- 4.4. Market Entropy
- 4.5. Patent/Trademark Analysis
- 5. Global Thermochromic Label Analysis, Insights and Forecast, 2020-2032
- 5.1. Market Analysis, Insights and Forecast - by Application
- 5.1.1. Pharmaceutical
- 5.1.2. Food and Beverages
- 5.1.3. Cosmetics
- 5.1.4. Others
- 5.2. Market Analysis, Insights and Forecast - by Type
- 5.2.1. Reversible
- 5.2.2. Irreversible
- 5.3. Market Analysis, Insights and Forecast - by Region
- 5.3.1. North America
- 5.3.2. South America
- 5.3.3. Europe
- 5.3.4. Middle East & Africa
- 5.3.5. Asia Pacific
- 5.1. Market Analysis, Insights and Forecast - by Application
- 6. North America Thermochromic Label Analysis, Insights and Forecast, 2020-2032
- 6.1. Market Analysis, Insights and Forecast - by Application
- 6.1.1. Pharmaceutical
- 6.1.2. Food and Beverages
- 6.1.3. Cosmetics
- 6.1.4. Others
- 6.2. Market Analysis, Insights and Forecast - by Type
- 6.2.1. Reversible
- 6.2.2. Irreversible
- 6.1. Market Analysis, Insights and Forecast - by Application
- 7. South America Thermochromic Label Analysis, Insights and Forecast, 2020-2032
- 7.1. Market Analysis, Insights and Forecast - by Application
- 7.1.1. Pharmaceutical
- 7.1.2. Food and Beverages
- 7.1.3. Cosmetics
- 7.1.4. Others
- 7.2. Market Analysis, Insights and Forecast - by Type
- 7.2.1. Reversible
- 7.2.2. Irreversible
- 7.1. Market Analysis, Insights and Forecast - by Application
- 8. Europe Thermochromic Label Analysis, Insights and Forecast, 2020-2032
- 8.1. Market Analysis, Insights and Forecast - by Application
- 8.1.1. Pharmaceutical
- 8.1.2. Food and Beverages
- 8.1.3. Cosmetics
- 8.1.4. Others
- 8.2. Market Analysis, Insights and Forecast - by Type
- 8.2.1. Reversible
- 8.2.2. Irreversible
- 8.1. Market Analysis, Insights and Forecast - by Application
- 9. Middle East & Africa Thermochromic Label Analysis, Insights and Forecast, 2020-2032
- 9.1. Market Analysis, Insights and Forecast - by Application
- 9.1.1. Pharmaceutical
- 9.1.2. Food and Beverages
- 9.1.3. Cosmetics
- 9.1.4. Others
- 9.2. Market Analysis, Insights and Forecast - by Type
- 9.2.1. Reversible
- 9.2.2. Irreversible
- 9.1. Market Analysis, Insights and Forecast - by Application
- 10. Asia Pacific Thermochromic Label Analysis, Insights and Forecast, 2020-2032
- 10.1. Market Analysis, Insights and Forecast - by Application
- 10.1.1. Pharmaceutical
- 10.1.2. Food and Beverages
- 10.1.3. Cosmetics
- 10.1.4. Others
- 10.2. Market Analysis, Insights and Forecast - by Type
- 10.2.1. Reversible
- 10.2.2. Irreversible
- 10.1. Market Analysis, Insights and Forecast - by Application
- 11. Competitive Analysis
- 11.1. Global Market Share Analysis 2025
- 11.2. Company Profiles
- 11.2.1 Siltech
- 11.2.1.1. Overview
- 11.2.1.2. Products
- 11.2.1.3. SWOT Analysis
- 11.2.1.4. Recent Developments
- 11.2.1.5. Financials (Based on Availability)
- 11.2.2 B&H Colour Change
- 11.2.2.1. Overview
- 11.2.2.2. Products
- 11.2.2.3. SWOT Analysis
- 11.2.2.4. Recent Developments
- 11.2.2.5. Financials (Based on Availability)
- 11.2.3 AB Print Group
- 11.2.3.1. Overview
- 11.2.3.2. Products
- 11.2.3.3. SWOT Analysis
- 11.2.3.4. Recent Developments
- 11.2.3.5. Financials (Based on Availability)
- 11.2.4 QCR Solutions Corp
- 11.2.4.1. Overview
- 11.2.4.2. Products
- 11.2.4.3. SWOT Analysis
- 11.2.4.4. Recent Developments
- 11.2.4.5. Financials (Based on Availability)
- 11.2.5 NanoMatriX International
- 11.2.5.1. Overview
- 11.2.5.2. Products
- 11.2.5.3. SWOT Analysis
- 11.2.5.4. Recent Developments
- 11.2.5.5. Financials (Based on Availability)
- 11.2.6 Hammer Packaging
- 11.2.6.1. Overview
- 11.2.6.2. Products
- 11.2.6.3. SWOT Analysis
- 11.2.6.4. Recent Developments
- 11.2.6.5. Financials (Based on Availability)
- 11.2.7 Multi-Color Corporation
- 11.2.7.1. Overview
- 11.2.7.2. Products
- 11.2.7.3. SWOT Analysis
- 11.2.7.4. Recent Developments
- 11.2.7.5. Financials (Based on Availability)
- 11.2.8 Eltronis
- 11.2.8.1. Overview
- 11.2.8.2. Products
- 11.2.8.3. SWOT Analysis
- 11.2.8.4. Recent Developments
- 11.2.8.5. Financials (Based on Availability)
- 11.2.9 Derksen
- 11.2.9.1. Overview
- 11.2.9.2. Products
- 11.2.9.3. SWOT Analysis
- 11.2.9.4. Recent Developments
- 11.2.9.5. Financials (Based on Availability)
- 11.2.10 E. TEXTINT
- 11.2.10.1. Overview
- 11.2.10.2. Products
- 11.2.10.3. SWOT Analysis
- 11.2.10.4. Recent Developments
- 11.2.10.5. Financials (Based on Availability)
- 11.2.11 CTI
- 11.2.11.1. Overview
- 11.2.11.2. Products
- 11.2.11.3. SWOT Analysis
- 11.2.11.4. Recent Developments
- 11.2.11.5. Financials (Based on Availability)
- 11.2.12 Pakmarkas
- 11.2.12.1. Overview
- 11.2.12.2. Products
- 11.2.12.3. SWOT Analysis
- 11.2.12.4. Recent Developments
- 11.2.12.5. Financials (Based on Availability)
- 11.2.13 Graficas Varias
- 11.2.13.1. Overview
- 11.2.13.2. Products
- 11.2.13.3. SWOT Analysis
- 11.2.13.4. Recent Developments
- 11.2.13.5. Financials (Based on Availability)
- 11.2.14 Gravic Group
- 11.2.14.1. Overview
- 11.2.14.2. Products
- 11.2.14.3. SWOT Analysis
- 11.2.14.4. Recent Developments
- 11.2.14.5. Financials (Based on Availability)
- 11.2.15 Aro Group
- 11.2.15.1. Overview
- 11.2.15.2. Products
- 11.2.15.3. SWOT Analysis
- 11.2.15.4. Recent Developments
- 11.2.15.5. Financials (Based on Availability)
- 11.2.1 Siltech
List of Figures
- Figure 1: Global Thermochromic Label Revenue Breakdown (undefined, %) by Region 2025 & 2033
- Figure 2: Global Thermochromic Label Volume Breakdown (K, %) by Region 2025 & 2033
- Figure 3: North America Thermochromic Label Revenue (undefined), by Application 2025 & 2033
- Figure 4: North America Thermochromic Label Volume (K), by Application 2025 & 2033
- Figure 5: North America Thermochromic Label Revenue Share (%), by Application 2025 & 2033
- Figure 6: North America Thermochromic Label Volume Share (%), by Application 2025 & 2033
- Figure 7: North America Thermochromic Label Revenue (undefined), by Type 2025 & 2033
- Figure 8: North America Thermochromic Label Volume (K), by Type 2025 & 2033
- Figure 9: North America Thermochromic Label Revenue Share (%), by Type 2025 & 2033
- Figure 10: North America Thermochromic Label Volume Share (%), by Type 2025 & 2033
- Figure 11: North America Thermochromic Label Revenue (undefined), by Country 2025 & 2033
- Figure 12: North America Thermochromic Label Volume (K), by Country 2025 & 2033
- Figure 13: North America Thermochromic Label Revenue Share (%), by Country 2025 & 2033
- Figure 14: North America Thermochromic Label Volume Share (%), by Country 2025 & 2033
- Figure 15: South America Thermochromic Label Revenue (undefined), by Application 2025 & 2033
- Figure 16: South America Thermochromic Label Volume (K), by Application 2025 & 2033
- Figure 17: South America Thermochromic Label Revenue Share (%), by Application 2025 & 2033
- Figure 18: South America Thermochromic Label Volume Share (%), by Application 2025 & 2033
- Figure 19: South America Thermochromic Label Revenue (undefined), by Type 2025 & 2033
- Figure 20: South America Thermochromic Label Volume (K), by Type 2025 & 2033
- Figure 21: South America Thermochromic Label Revenue Share (%), by Type 2025 & 2033
- Figure 22: South America Thermochromic Label Volume Share (%), by Type 2025 & 2033
- Figure 23: South America Thermochromic Label Revenue (undefined), by Country 2025 & 2033
- Figure 24: South America Thermochromic Label Volume (K), by Country 2025 & 2033
- Figure 25: South America Thermochromic Label Revenue Share (%), by Country 2025 & 2033
- Figure 26: South America Thermochromic Label Volume Share (%), by Country 2025 & 2033
- Figure 27: Europe Thermochromic Label Revenue (undefined), by Application 2025 & 2033
- Figure 28: Europe Thermochromic Label Volume (K), by Application 2025 & 2033
- Figure 29: Europe Thermochromic Label Revenue Share (%), by Application 2025 & 2033
- Figure 30: Europe Thermochromic Label Volume Share (%), by Application 2025 & 2033
- Figure 31: Europe Thermochromic Label Revenue (undefined), by Type 2025 & 2033
- Figure 32: Europe Thermochromic Label Volume (K), by Type 2025 & 2033
- Figure 33: Europe Thermochromic Label Revenue Share (%), by Type 2025 & 2033
- Figure 34: Europe Thermochromic Label Volume Share (%), by Type 2025 & 2033
- Figure 35: Europe Thermochromic Label Revenue (undefined), by Country 2025 & 2033
- Figure 36: Europe Thermochromic Label Volume (K), by Country 2025 & 2033
- Figure 37: Europe Thermochromic Label Revenue Share (%), by Country 2025 & 2033
- Figure 38: Europe Thermochromic Label Volume Share (%), by Country 2025 & 2033
- Figure 39: Middle East & Africa Thermochromic Label Revenue (undefined), by Application 2025 & 2033
- Figure 40: Middle East & Africa Thermochromic Label Volume (K), by Application 2025 & 2033
- Figure 41: Middle East & Africa Thermochromic Label Revenue Share (%), by Application 2025 & 2033
- Figure 42: Middle East & Africa Thermochromic Label Volume Share (%), by Application 2025 & 2033
- Figure 43: Middle East & Africa Thermochromic Label Revenue (undefined), by Type 2025 & 2033
- Figure 44: Middle East & Africa Thermochromic Label Volume (K), by Type 2025 & 2033
- Figure 45: Middle East & Africa Thermochromic Label Revenue Share (%), by Type 2025 & 2033
- Figure 46: Middle East & Africa Thermochromic Label Volume Share (%), by Type 2025 & 2033
- Figure 47: Middle East & Africa Thermochromic Label Revenue (undefined), by Country 2025 & 2033
- Figure 48: Middle East & Africa Thermochromic Label Volume (K), by Country 2025 & 2033
- Figure 49: Middle East & Africa Thermochromic Label Revenue Share (%), by Country 2025 & 2033
- Figure 50: Middle East & Africa Thermochromic Label Volume Share (%), by Country 2025 & 2033
- Figure 51: Asia Pacific Thermochromic Label Revenue (undefined), by Application 2025 & 2033
- Figure 52: Asia Pacific Thermochromic Label Volume (K), by Application 2025 & 2033
- Figure 53: Asia Pacific Thermochromic Label Revenue Share (%), by Application 2025 & 2033
- Figure 54: Asia Pacific Thermochromic Label Volume Share (%), by Application 2025 & 2033
- Figure 55: Asia Pacific Thermochromic Label Revenue (undefined), by Type 2025 & 2033
- Figure 56: Asia Pacific Thermochromic Label Volume (K), by Type 2025 & 2033
- Figure 57: Asia Pacific Thermochromic Label Revenue Share (%), by Type 2025 & 2033
- Figure 58: Asia Pacific Thermochromic Label Volume Share (%), by Type 2025 & 2033
- Figure 59: Asia Pacific Thermochromic Label Revenue (undefined), by Country 2025 & 2033
- Figure 60: Asia Pacific Thermochromic Label Volume (K), by Country 2025 & 2033
- Figure 61: Asia Pacific Thermochromic Label Revenue Share (%), by Country 2025 & 2033
- Figure 62: Asia Pacific Thermochromic Label Volume Share (%), by Country 2025 & 2033
List of Tables
- Table 1: Global Thermochromic Label Revenue undefined Forecast, by Application 2020 & 2033
- Table 2: Global Thermochromic Label Volume K Forecast, by Application 2020 & 2033
- Table 3: Global Thermochromic Label Revenue undefined Forecast, by Type 2020 & 2033
- Table 4: Global Thermochromic Label Volume K Forecast, by Type 2020 & 2033
- Table 5: Global Thermochromic Label Revenue undefined Forecast, by Region 2020 & 2033
- Table 6: Global Thermochromic Label Volume K Forecast, by Region 2020 & 2033
- Table 7: Global Thermochromic Label Revenue undefined Forecast, by Application 2020 & 2033
- Table 8: Global Thermochromic Label Volume K Forecast, by Application 2020 & 2033
- Table 9: Global Thermochromic Label Revenue undefined Forecast, by Type 2020 & 2033
- Table 10: Global Thermochromic Label Volume K Forecast, by Type 2020 & 2033
- Table 11: Global Thermochromic Label Revenue undefined Forecast, by Country 2020 & 2033
- Table 12: Global Thermochromic Label Volume K Forecast, by Country 2020 & 2033
- Table 13: United States Thermochromic Label Revenue (undefined) Forecast, by Application 2020 & 2033
- Table 14: United States Thermochromic Label Volume (K) Forecast, by Application 2020 & 2033
- Table 15: Canada Thermochromic Label Revenue (undefined) Forecast, by Application 2020 & 2033
- Table 16: Canada Thermochromic Label Volume (K) Forecast, by Application 2020 & 2033
- Table 17: Mexico Thermochromic Label Revenue (undefined) Forecast, by Application 2020 & 2033
- Table 18: Mexico Thermochromic Label Volume (K) Forecast, by Application 2020 & 2033
- Table 19: Global Thermochromic Label Revenue undefined Forecast, by Application 2020 & 2033
- Table 20: Global Thermochromic Label Volume K Forecast, by Application 2020 & 2033
- Table 21: Global Thermochromic Label Revenue undefined Forecast, by Type 2020 & 2033
- Table 22: Global Thermochromic Label Volume K Forecast, by Type 2020 & 2033
- Table 23: Global Thermochromic Label Revenue undefined Forecast, by Country 2020 & 2033
- Table 24: Global Thermochromic Label Volume K Forecast, by Country 2020 & 2033
- Table 25: Brazil Thermochromic Label Revenue (undefined) Forecast, by Application 2020 & 2033
- Table 26: Brazil Thermochromic Label Volume (K) Forecast, by Application 2020 & 2033
- Table 27: Argentina Thermochromic Label Revenue (undefined) Forecast, by Application 2020 & 2033
- Table 28: Argentina Thermochromic Label Volume (K) Forecast, by Application 2020 & 2033
- Table 29: Rest of South America Thermochromic Label Revenue (undefined) Forecast, by Application 2020 & 2033
- Table 30: Rest of South America Thermochromic Label Volume (K) Forecast, by Application 2020 & 2033
- Table 31: Global Thermochromic Label Revenue undefined Forecast, by Application 2020 & 2033
- Table 32: Global Thermochromic Label Volume K Forecast, by Application 2020 & 2033
- Table 33: Global Thermochromic Label Revenue undefined Forecast, by Type 2020 & 2033
- Table 34: Global Thermochromic Label Volume K Forecast, by Type 2020 & 2033
- Table 35: Global Thermochromic Label Revenue undefined Forecast, by Country 2020 & 2033
- Table 36: Global Thermochromic Label Volume K Forecast, by Country 2020 & 2033
- Table 37: United Kingdom Thermochromic Label Revenue (undefined) Forecast, by Application 2020 & 2033
- Table 38: United Kingdom Thermochromic Label Volume (K) Forecast, by Application 2020 & 2033
- Table 39: Germany Thermochromic Label Revenue (undefined) Forecast, by Application 2020 & 2033
- Table 40: Germany Thermochromic Label Volume (K) Forecast, by Application 2020 & 2033
- Table 41: France Thermochromic Label Revenue (undefined) Forecast, by Application 2020 & 2033
- Table 42: France Thermochromic Label Volume (K) Forecast, by Application 2020 & 2033
- Table 43: Italy Thermochromic Label Revenue (undefined) Forecast, by Application 2020 & 2033
- Table 44: Italy Thermochromic Label Volume (K) Forecast, by Application 2020 & 2033
- Table 45: Spain Thermochromic Label Revenue (undefined) Forecast, by Application 2020 & 2033
- Table 46: Spain Thermochromic Label Volume (K) Forecast, by Application 2020 & 2033
- Table 47: Russia Thermochromic Label Revenue (undefined) Forecast, by Application 2020 & 2033
- Table 48: Russia Thermochromic Label Volume (K) Forecast, by Application 2020 & 2033
- Table 49: Benelux Thermochromic Label Revenue (undefined) Forecast, by Application 2020 & 2033
- Table 50: Benelux Thermochromic Label Volume (K) Forecast, by Application 2020 & 2033
- Table 51: Nordics Thermochromic Label Revenue (undefined) Forecast, by Application 2020 & 2033
- Table 52: Nordics Thermochromic Label Volume (K) Forecast, by Application 2020 & 2033
- Table 53: Rest of Europe Thermochromic Label Revenue (undefined) Forecast, by Application 2020 & 2033
- Table 54: Rest of Europe Thermochromic Label Volume (K) Forecast, by Application 2020 & 2033
- Table 55: Global Thermochromic Label Revenue undefined Forecast, by Application 2020 & 2033
- Table 56: Global Thermochromic Label Volume K Forecast, by Application 2020 & 2033
- Table 57: Global Thermochromic Label Revenue undefined Forecast, by Type 2020 & 2033
- Table 58: Global Thermochromic Label Volume K Forecast, by Type 2020 & 2033
- Table 59: Global Thermochromic Label Revenue undefined Forecast, by Country 2020 & 2033
- Table 60: Global Thermochromic Label Volume K Forecast, by Country 2020 & 2033
- Table 61: Turkey Thermochromic Label Revenue (undefined) Forecast, by Application 2020 & 2033
- Table 62: Turkey Thermochromic Label Volume (K) Forecast, by Application 2020 & 2033
- Table 63: Israel Thermochromic Label Revenue (undefined) Forecast, by Application 2020 & 2033
- Table 64: Israel Thermochromic Label Volume (K) Forecast, by Application 2020 & 2033
- Table 65: GCC Thermochromic Label Revenue (undefined) Forecast, by Application 2020 & 2033
- Table 66: GCC Thermochromic Label Volume (K) Forecast, by Application 2020 & 2033
- Table 67: North Africa Thermochromic Label Revenue (undefined) Forecast, by Application 2020 & 2033
- Table 68: North Africa Thermochromic Label Volume (K) Forecast, by Application 2020 & 2033
- Table 69: South Africa Thermochromic Label Revenue (undefined) Forecast, by Application 2020 & 2033
- Table 70: South Africa Thermochromic Label Volume (K) Forecast, by Application 2020 & 2033
- Table 71: Rest of Middle East & Africa Thermochromic Label Revenue (undefined) Forecast, by Application 2020 & 2033
- Table 72: Rest of Middle East & Africa Thermochromic Label Volume (K) Forecast, by Application 2020 & 2033
- Table 73: Global Thermochromic Label Revenue undefined Forecast, by Application 2020 & 2033
- Table 74: Global Thermochromic Label Volume K Forecast, by Application 2020 & 2033
- Table 75: Global Thermochromic Label Revenue undefined Forecast, by Type 2020 & 2033
- Table 76: Global Thermochromic Label Volume K Forecast, by Type 2020 & 2033
- Table 77: Global Thermochromic Label Revenue undefined Forecast, by Country 2020 & 2033
- Table 78: Global Thermochromic Label Volume K Forecast, by Country 2020 & 2033
- Table 79: China Thermochromic Label Revenue (undefined) Forecast, by Application 2020 & 2033
- Table 80: China Thermochromic Label Volume (K) Forecast, by Application 2020 & 2033
- Table 81: India Thermochromic Label Revenue (undefined) Forecast, by Application 2020 & 2033
- Table 82: India Thermochromic Label Volume (K) Forecast, by Application 2020 & 2033
- Table 83: Japan Thermochromic Label Revenue (undefined) Forecast, by Application 2020 & 2033
- Table 84: Japan Thermochromic Label Volume (K) Forecast, by Application 2020 & 2033
- Table 85: South Korea Thermochromic Label Revenue (undefined) Forecast, by Application 2020 & 2033
- Table 86: South Korea Thermochromic Label Volume (K) Forecast, by Application 2020 & 2033
- Table 87: ASEAN Thermochromic Label Revenue (undefined) Forecast, by Application 2020 & 2033
- Table 88: ASEAN Thermochromic Label Volume (K) Forecast, by Application 2020 & 2033
- Table 89: Oceania Thermochromic Label Revenue (undefined) Forecast, by Application 2020 & 2033
- Table 90: Oceania Thermochromic Label Volume (K) Forecast, by Application 2020 & 2033
- Table 91: Rest of Asia Pacific Thermochromic Label Revenue (undefined) Forecast, by Application 2020 & 2033
- Table 92: Rest of Asia Pacific Thermochromic Label Volume (K) Forecast, by Application 2020 & 2033
Frequently Asked Questions
1. What is the projected Compound Annual Growth Rate (CAGR) of the Thermochromic Label?
The projected CAGR is approximately 7%.
2. Which companies are prominent players in the Thermochromic Label?
Key companies in the market include Siltech, B&H Colour Change, AB Print Group, QCR Solutions Corp, NanoMatriX International, Hammer Packaging, Multi-Color Corporation, Eltronis, Derksen, E. TEXTINT, CTI, Pakmarkas, Graficas Varias, Gravic Group, Aro Group.
3. What are the main segments of the Thermochromic Label?
The market segments include Application, Type.
4. Can you provide details about the market size?
The market size is estimated to be USD XXX N/A as of 2022.
5. What are some drivers contributing to market growth?
N/A
6. What are the notable trends driving market growth?
N/A
7. Are there any restraints impacting market growth?
N/A
8. Can you provide examples of recent developments in the market?
N/A
9. What pricing options are available for accessing the report?
Pricing options include single-user, multi-user, and enterprise licenses priced at USD 3950.00, USD 5925.00, and USD 7900.00 respectively.
10. Is the market size provided in terms of value or volume?
The market size is provided in terms of value, measured in N/A and volume, measured in K.
11. Are there any specific market keywords associated with the report?
Yes, the market keyword associated with the report is "Thermochromic Label," which aids in identifying and referencing the specific market segment covered.
12. How do I determine which pricing option suits my needs best?
The pricing options vary based on user requirements and access needs. Individual users may opt for single-user licenses, while businesses requiring broader access may choose multi-user or enterprise licenses for cost-effective access to the report.
13. Are there any additional resources or data provided in the Thermochromic Label report?
While the report offers comprehensive insights, it's advisable to review the specific contents or supplementary materials provided to ascertain if additional resources or data are available.
14. How can I stay updated on further developments or reports in the Thermochromic Label?
To stay informed about further developments, trends, and reports in the Thermochromic Label, consider subscribing to industry newsletters, following relevant companies and organizations, or regularly checking reputable industry news sources and publications.
Methodology
Step 1 - Identification of Relevant Samples Size from Population Database


Step 2 - Approaches for Defining Global Market Size (Value, Volume* & Price*)

Note*: In applicable scenarios
Step 3 - Data Sources
Primary Research
- Web Analytics
- Survey Reports
- Research Institute
- Latest Research Reports
- Opinion Leaders
Secondary Research
- Annual Reports
- White Paper
- Latest Press Release
- Industry Association
- Paid Database
- Investor Presentations

Step 4 - Data Triangulation
Involves using different sources of information in order to increase the validity of a study
These sources are likely to be stakeholders in a program - participants, other researchers, program staff, other community members, and so on.
Then we put all data in single framework & apply various statistical tools to find out the dynamic on the market.
During the analysis stage, feedback from the stakeholder groups would be compared to determine areas of agreement as well as areas of divergence