

Key Insights
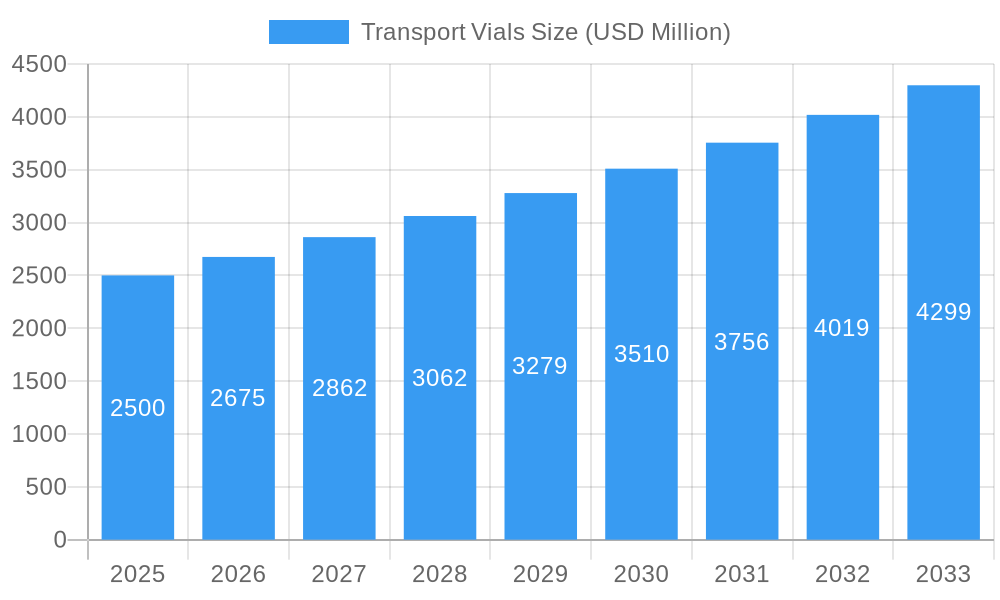
The global Transport Vials market is projected to reach $2.5 billion in 2025, exhibiting a robust Compound Annual Growth Rate (CAGR) of 7% through 2033. This substantial growth is primarily fueled by the escalating demand for safe and reliable containment solutions across critical sectors like pharmaceutical manufacturing, research laboratories, and healthcare institutions. The increasing prevalence of chronic diseases, coupled with advancements in drug discovery and development, necessitates the secure transportation and storage of sensitive biological samples, vaccines, and therapeutic agents. Furthermore, stringent regulatory frameworks governing the pharmaceutical supply chain are also a significant driver, compelling manufacturers to adopt high-quality, certified transport vials that ensure product integrity and prevent contamination. The pharmaceutical companies segment is expected to be a dominant force, driven by an expanding pipeline of biologics and advanced therapies, which often require specialized and highly sterile vial solutions.
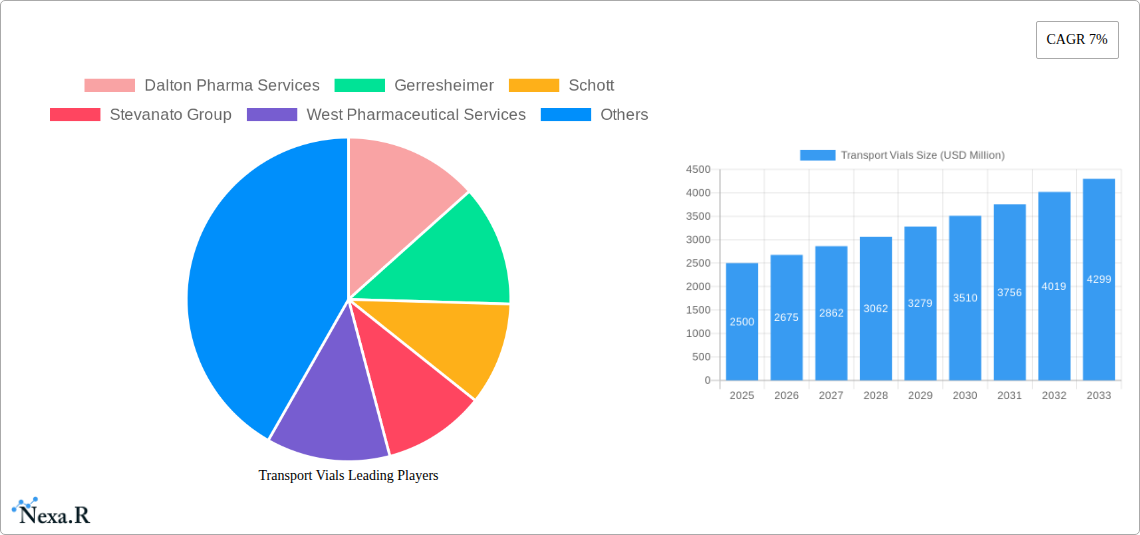
Transport Vials Market Size (In Billion)
The market is characterized by a notable trend towards innovation, with manufacturers focusing on developing vials with enhanced features such as improved sealing mechanisms, tamper-evident designs, and specialized materials that offer superior chemical resistance and thermal stability. The 20ml vial segment is anticipated to witness considerable traction due to its versatility in handling various sample volumes and its widespread adoption in diagnostic and research applications. While the market presents significant opportunities, certain restraints, such as the increasing cost of raw materials and the complex manufacturing processes required for high-quality glass vials, could pose challenges. However, ongoing technological advancements and strategic collaborations among key players are expected to mitigate these challenges, ensuring sustained market expansion and the continued availability of essential transport vial solutions for the global life sciences industry.
Transport Vials Company Market Share
Comprehensive Report: Transport Vials Market Analysis (2019-2033)
This report offers an in-depth analysis of the global Transport Vials market, a critical component in the healthcare and pharmaceutical supply chain. Leveraging extensive data and expert insights, this study provides a forward-looking perspective on market dynamics, growth drivers, emerging trends, and competitive landscapes. The report is structured to deliver actionable intelligence for stakeholders seeking to understand and capitalize on opportunities within this vital sector.
Transport Vials Market Dynamics & Structure
The global Transport Vials market is characterized by a moderate to high degree of concentration, with established players like Gerresheimer, Schott, and Stevanato Group holding significant market shares. Technological innovation is a key driver, particularly in the development of advanced materials for enhanced chemical resistance and tamper-evident features, crucial for safeguarding sensitive biological samples and pharmaceutical products. Regulatory frameworks, such as those established by the FDA and EMA, play a pivotal role in dictating product quality, manufacturing standards, and material traceability, thus influencing market entry and product development. Competitive product substitutes, while limited in their ability to fully replicate the specialized functions of transport vials, include various forms of specialized containers and multi-layered packaging solutions. End-user demographics are increasingly shifting towards research laboratories and pharmaceutical companies with a growing demand for sterile, high-purity, and specialized vials for advanced research and clinical trials. Mergers and acquisitions (M&A) trends are evident, driven by the pursuit of expanding product portfolios, enhancing manufacturing capabilities, and achieving economies of scale. The estimated M&A deal volume for the forecast period is expected to be in the range of 5-8 billion units. Innovation barriers include the stringent regulatory approval processes and the high cost of R&D for novel materials and specialized vial designs.
- Market Concentration: Moderate to High, driven by a few key global manufacturers.
- Technological Innovation: Focus on material science, tamper-evidence, and sterility assurance.
- Regulatory Frameworks: Stringent adherence to FDA, EMA, and other national standards.
- End-User Demographics: Growing demand from pharmaceutical and research sectors.
- M&A Trends: Strategic acquisitions to enhance market reach and product offerings.
Transport Vials Growth Trends & Insights
The global Transport Vials market is projected to experience robust growth, driven by an escalating demand for secure and reliable containment solutions across the pharmaceutical, biotechnology, and diagnostic industries. The market size is estimated to have reached $6.5 billion units in the base year of 2025, with a projected Compound Annual Growth Rate (CAGR) of approximately 5.8% during the forecast period of 2025-2033. This growth trajectory is underpinned by increasing healthcare expenditure globally, a surge in the development of novel therapeutics and biologics requiring specialized packaging, and the expanding scope of clinical trials and research activities. Adoption rates for advanced transport vials, featuring enhanced protection against breakage, contamination, and temperature excursions, are steadily rising as end-users prioritize sample integrity and regulatory compliance. Technological disruptions, such as the integration of RFID technology for enhanced track-and-trace capabilities and the development of smart vials with real-time monitoring features, are poised to redefine market standards and create new avenues for growth. Consumer behavior shifts are evident, with a growing preference for customized vial solutions that cater to specific application needs, alongside an increased emphasis on sustainable and eco-friendly packaging materials. The market penetration of specialized transport vials is expected to deepen significantly as their benefits in ensuring sample viability and reducing loss are increasingly recognized.
The historical period of 2019-2024 witnessed steady market expansion, fueled by the growing pharmaceutical pipeline and the increasing prevalence of chronic diseases necessitating advanced diagnostic and treatment approaches. The COVID-19 pandemic, while presenting supply chain challenges, also accelerated the demand for specialized vials for vaccine and diagnostic kit transportation, further solidifying their importance.
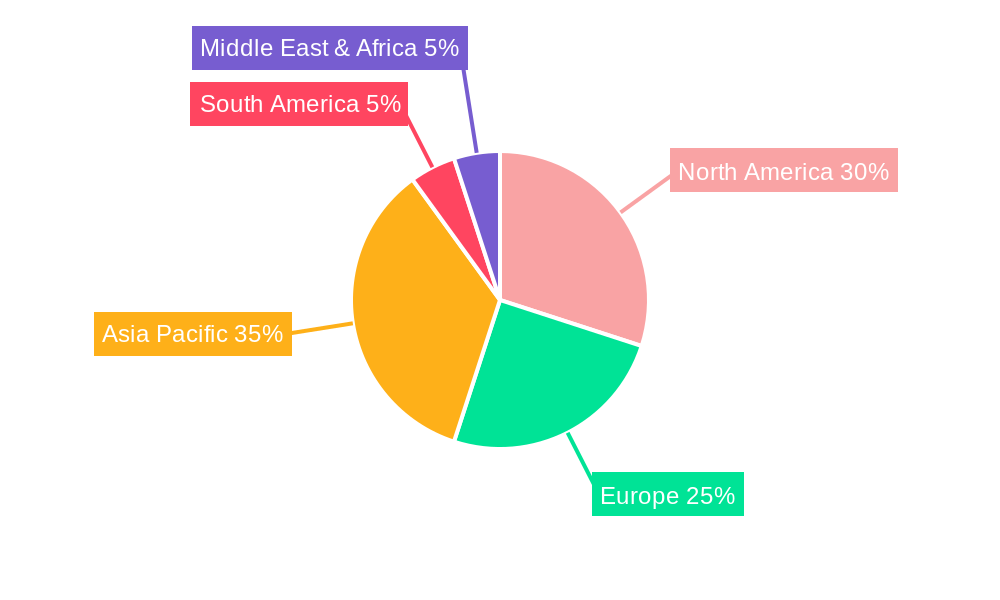
Dominant Regions, Countries, or Segments in Transport Vials
The Pharmaceutical Companies segment is anticipated to be the dominant force driving growth in the global Transport Vials market. This dominance is fueled by the escalating research and development activities, the manufacturing of a vast array of pharmaceutical products, and the stringent requirements for the safe and secure transportation of sensitive drug substances, intermediates, and finished products. Pharmaceutical companies necessitate vials that offer superior chemical inertness, excellent sealing capabilities, and robust protection against environmental factors to maintain product efficacy and prevent contamination throughout the supply chain. The projected market share for this segment is estimated to be around 45-50% of the total market by 2033.
North America, particularly the United States, is expected to emerge as a leading country in terms of market value and volume. This leadership is attributed to the presence of a highly developed pharmaceutical and biotechnology industry, a robust healthcare infrastructure, significant government funding for research, and stringent regulatory oversight that mandates high-quality packaging solutions. The region's commitment to innovation and the high adoption rate of advanced containment technologies further bolster its market position.
Within the Application segment, Research Laboratories are also a significant contributor, driven by ongoing scientific discoveries, the demand for precise sample handling in academic and industrial research, and the increasing complexity of biological assays. The need for sterile, inert, and traceable vials for storing and transporting precious biological samples, reagents, and genetic materials is paramount.
The 20ml vial type is expected to witness substantial growth and hold a significant market share due to its versatility in handling various sample volumes commonly encountered in pharmaceutical research, clinical diagnostics, and laboratory testing. Its size strikes a balance between sufficient capacity for common tests and ease of handling and storage, making it a preferred choice for many applications.
- Dominant Application Segment: Pharmaceutical Companies, driven by R&D and stringent product integrity needs.
- Leading Country: United States, due to its advanced pharmaceutical and biotech ecosystem.
- Key Drivers: Economic policies supporting healthcare innovation, robust R&D expenditure, and stringent quality standards.
- Market Share & Growth Potential: Pharmaceutical companies hold a substantial share, with ongoing expansion due to new drug development.
Transport Vials Product Landscape
The transport vials product landscape is characterized by continuous innovation focused on enhancing material properties, functionality, and user convenience. Key product innovations include the development of Type I borosilicate glass vials offering exceptional chemical resistance and thermal stability, crucial for sensitive pharmaceutical compounds. Advancements in closure systems, such as specialized stoppers and seals, are critical for ensuring tamper-evidence and sterility assurance. Furthermore, the market is witnessing the emergence of vials with enhanced surface treatments to minimize protein adsorption and improve drug stability. Unique selling propositions revolve around superior inertness, advanced barrier properties against moisture and oxygen, and compliance with stringent pharmacopoeial standards. Technological advancements are also leading to the development of vials with integrated functionalities, such as barcoding for enhanced traceability and specialized coatings for improved cryogenic storage.
Key Drivers, Barriers & Challenges in Transport Vials
Key Drivers:
The transport vials market is primarily propelled by the burgeoning pharmaceutical and biotechnology sectors, necessitating secure and sterile containment for drug substances, biologics, and diagnostic samples. The increasing complexity of drug development, including the rise of personalized medicine and cell and gene therapies, demands highly specialized and inert vials. Advancements in diagnostic technologies and the growing global prevalence of chronic diseases further amplify the demand for reliable sample transport solutions. Stringent regulatory requirements across major markets mandate high-quality packaging to ensure product integrity and patient safety, thereby driving the adoption of premium transport vials.
Barriers & Challenges:
Significant barriers include the high cost of manufacturing advanced vials, particularly those made from specialized glass or featuring complex functionalities. The stringent and lengthy regulatory approval processes for new vial materials and designs can impede innovation timelines. Supply chain disruptions, exacerbated by geopolitical events or natural disasters, can impact the availability of raw materials and finished products, leading to increased lead times and costs. Intense competition from established players and emerging manufacturers offering cost-effective alternatives can also present challenges, especially in less regulated markets. Fluctuations in the cost of raw materials, such as borosilicate glass, can directly impact profit margins.
Emerging Opportunities in Transport Vials
Emerging opportunities lie in the development of sustainable and eco-friendly transport vial solutions, catering to the growing environmental consciousness within the industry. The untapped potential of emerging economies in Asia and Latin America, with their expanding healthcare infrastructure and increasing pharmaceutical production, presents significant growth avenues. Innovations in smart vials, incorporating IoT capabilities for real-time temperature monitoring, humidity tracking, and tamper detection, offer a high-value proposition for sensitive biological samples and high-value pharmaceuticals. The increasing demand for customized vial solutions tailored to specific drug formulations or research applications also represents a niche yet lucrative market. Furthermore, the growing field of cell and gene therapy requires highly specialized vials with exceptional purity and inertness, creating a significant opportunity for manufacturers capable of meeting these demanding requirements.
Growth Accelerators in the Transport Vials Industry
The transport vials industry is experiencing significant growth acceleration driven by several key factors. Technological breakthroughs in material science are enabling the development of vials with superior chemical inertness, enhanced barrier properties, and improved resistance to extreme temperatures, crucial for the stable storage and transport of advanced biologics and vaccines. Strategic partnerships between vial manufacturers and pharmaceutical companies are fostering co-development of specialized packaging solutions tailored to specific drug products, ensuring optimal stability and efficacy. Market expansion strategies, particularly in emerging economies with rapidly growing healthcare sectors, are creating new demand centers. The increasing investment in biopharmaceutical research and development, leading to a more robust pipeline of complex therapeutics, directly translates into a higher demand for advanced and reliable transport vials.
Key Players Shaping the Transport Vials Market
- Dalton Pharma Services
- Gerresheimer
- Schott
- Stevanato Group
- West Pharmaceutical Services
- Phoenix Glass
- Pacific Vial Manufacturing
- Shandong Pharmaceutical Glass
- Anhui Huaxin Medicinal Glass Products
- Pioneer Impex
- SGD Pharma Group
- PGP Glass Company
Notable Milestones in Transport Vials Sector
- 2021 (Q3): Gerresheimer launches a new range of advanced tamper-evident closures for pharmaceutical vials, enhancing product security.
- 2022 (Q1): Schott AG announces significant investment in expanding its borosilicate glass production capacity to meet rising global demand for high-quality pharmaceutical packaging.
- 2022 (Q4): Stevanato Group acquires a key player in specialized vial manufacturing, strengthening its market position and product portfolio.
- 2023 (Q2): West Pharmaceutical Services introduces a novel vial capping system designed for increased throughput and enhanced sterility assurance in pharmaceutical manufacturing.
- 2023 (Q3): A significant increase in M&A activity observed, with several mid-sized players being acquired by larger corporations seeking market consolidation.
In-Depth Transport Vials Market Outlook
The future outlook for the transport vials market is exceptionally positive, characterized by sustained growth driven by innovation and expanding healthcare needs. Key growth accelerators include the continued advancements in pharmaceutical R&D, particularly in the areas of biologics, cell and gene therapies, and personalized medicine, all of which necessitate specialized and highly reliable containment solutions. Strategic collaborations between vial manufacturers and pharmaceutical developers will continue to drive the creation of bespoke packaging, ensuring optimal product integrity. The increasing focus on supply chain resilience and traceability will further bolster the demand for high-quality, secure transport vials. Emerging markets present substantial untapped potential, offering opportunities for market penetration and expansion. Manufacturers investing in sustainable packaging solutions and smart vial technologies will be well-positioned to capture future market share and capitalize on evolving industry trends and consumer preferences.
Transport Vials Segmentation
-
1. Application
- 1.1. Research Laboratory
- 1.2. Hospitals
- 1.3. Pharmaceutical Companies
- 1.4. Educational Institutes
- 1.5. Others
-
2. Types
- 2.1. <2ml
- 2.2. 2ml to 5ml
- 2.3. 5ml to 10ml
- 2.4. 10ml to 20ml
- 2.5. >20ml
Transport Vials Segmentation By Geography
-
1. North America
- 1.1. United States
- 1.2. Canada
- 1.3. Mexico
-
2. South America
- 2.1. Brazil
- 2.2. Argentina
- 2.3. Rest of South America
-
3. Europe
- 3.1. United Kingdom
- 3.2. Germany
- 3.3. France
- 3.4. Italy
- 3.5. Spain
- 3.6. Russia
- 3.7. Benelux
- 3.8. Nordics
- 3.9. Rest of Europe
-
4. Middle East & Africa
- 4.1. Turkey
- 4.2. Israel
- 4.3. GCC
- 4.4. North Africa
- 4.5. South Africa
- 4.6. Rest of Middle East & Africa
-
5. Asia Pacific
- 5.1. China
- 5.2. India
- 5.3. Japan
- 5.4. South Korea
- 5.5. ASEAN
- 5.6. Oceania
- 5.7. Rest of Asia Pacific
Transport Vials Regional Market Share
Geographic Coverage of Transport Vials
Transport Vials REPORT HIGHLIGHTS
| Aspects | Details |
|---|---|
| Study Period | 2020-2034 |
| Base Year | 2025 |
| Estimated Year | 2026 |
| Forecast Period | 2026-2034 |
| Historical Period | 2020-2025 |
| Growth Rate | CAGR of 7% from 2020-2034 |
| Segmentation |
|
Table of Contents
- 1. Introduction
- 1.1. Research Scope
- 1.2. Market Segmentation
- 1.3. Research Methodology
- 1.4. Definitions and Assumptions
- 2. Executive Summary
- 2.1. Introduction
- 3. Market Dynamics
- 3.1. Introduction
- 3.2. Market Drivers
- 3.3. Market Restrains
- 3.4. Market Trends
- 4. Market Factor Analysis
- 4.1. Porters Five Forces
- 4.2. Supply/Value Chain
- 4.3. PESTEL analysis
- 4.4. Market Entropy
- 4.5. Patent/Trademark Analysis
- 5. Global Transport Vials Analysis, Insights and Forecast, 2020-2032
- 5.1. Market Analysis, Insights and Forecast - by Application
- 5.1.1. Research Laboratory
- 5.1.2. Hospitals
- 5.1.3. Pharmaceutical Companies
- 5.1.4. Educational Institutes
- 5.1.5. Others
- 5.2. Market Analysis, Insights and Forecast - by Types
- 5.2.1. <2ml
- 5.2.2. 2ml to 5ml
- 5.2.3. 5ml to 10ml
- 5.2.4. 10ml to 20ml
- 5.2.5. >20ml
- 5.3. Market Analysis, Insights and Forecast - by Region
- 5.3.1. North America
- 5.3.2. South America
- 5.3.3. Europe
- 5.3.4. Middle East & Africa
- 5.3.5. Asia Pacific
- 5.1. Market Analysis, Insights and Forecast - by Application
- 6. North America Transport Vials Analysis, Insights and Forecast, 2020-2032
- 6.1. Market Analysis, Insights and Forecast - by Application
- 6.1.1. Research Laboratory
- 6.1.2. Hospitals
- 6.1.3. Pharmaceutical Companies
- 6.1.4. Educational Institutes
- 6.1.5. Others
- 6.2. Market Analysis, Insights and Forecast - by Types
- 6.2.1. <2ml
- 6.2.2. 2ml to 5ml
- 6.2.3. 5ml to 10ml
- 6.2.4. 10ml to 20ml
- 6.2.5. >20ml
- 6.1. Market Analysis, Insights and Forecast - by Application
- 7. South America Transport Vials Analysis, Insights and Forecast, 2020-2032
- 7.1. Market Analysis, Insights and Forecast - by Application
- 7.1.1. Research Laboratory
- 7.1.2. Hospitals
- 7.1.3. Pharmaceutical Companies
- 7.1.4. Educational Institutes
- 7.1.5. Others
- 7.2. Market Analysis, Insights and Forecast - by Types
- 7.2.1. <2ml
- 7.2.2. 2ml to 5ml
- 7.2.3. 5ml to 10ml
- 7.2.4. 10ml to 20ml
- 7.2.5. >20ml
- 7.1. Market Analysis, Insights and Forecast - by Application
- 8. Europe Transport Vials Analysis, Insights and Forecast, 2020-2032
- 8.1. Market Analysis, Insights and Forecast - by Application
- 8.1.1. Research Laboratory
- 8.1.2. Hospitals
- 8.1.3. Pharmaceutical Companies
- 8.1.4. Educational Institutes
- 8.1.5. Others
- 8.2. Market Analysis, Insights and Forecast - by Types
- 8.2.1. <2ml
- 8.2.2. 2ml to 5ml
- 8.2.3. 5ml to 10ml
- 8.2.4. 10ml to 20ml
- 8.2.5. >20ml
- 8.1. Market Analysis, Insights and Forecast - by Application
- 9. Middle East & Africa Transport Vials Analysis, Insights and Forecast, 2020-2032
- 9.1. Market Analysis, Insights and Forecast - by Application
- 9.1.1. Research Laboratory
- 9.1.2. Hospitals
- 9.1.3. Pharmaceutical Companies
- 9.1.4. Educational Institutes
- 9.1.5. Others
- 9.2. Market Analysis, Insights and Forecast - by Types
- 9.2.1. <2ml
- 9.2.2. 2ml to 5ml
- 9.2.3. 5ml to 10ml
- 9.2.4. 10ml to 20ml
- 9.2.5. >20ml
- 9.1. Market Analysis, Insights and Forecast - by Application
- 10. Asia Pacific Transport Vials Analysis, Insights and Forecast, 2020-2032
- 10.1. Market Analysis, Insights and Forecast - by Application
- 10.1.1. Research Laboratory
- 10.1.2. Hospitals
- 10.1.3. Pharmaceutical Companies
- 10.1.4. Educational Institutes
- 10.1.5. Others
- 10.2. Market Analysis, Insights and Forecast - by Types
- 10.2.1. <2ml
- 10.2.2. 2ml to 5ml
- 10.2.3. 5ml to 10ml
- 10.2.4. 10ml to 20ml
- 10.2.5. >20ml
- 10.1. Market Analysis, Insights and Forecast - by Application
- 11. Competitive Analysis
- 11.1. Global Market Share Analysis 2025
- 11.2. Company Profiles
- 11.2.1 Dalton Pharma Services
- 11.2.1.1. Overview
- 11.2.1.2. Products
- 11.2.1.3. SWOT Analysis
- 11.2.1.4. Recent Developments
- 11.2.1.5. Financials (Based on Availability)
- 11.2.2 Gerresheimer
- 11.2.2.1. Overview
- 11.2.2.2. Products
- 11.2.2.3. SWOT Analysis
- 11.2.2.4. Recent Developments
- 11.2.2.5. Financials (Based on Availability)
- 11.2.3 Schott
- 11.2.3.1. Overview
- 11.2.3.2. Products
- 11.2.3.3. SWOT Analysis
- 11.2.3.4. Recent Developments
- 11.2.3.5. Financials (Based on Availability)
- 11.2.4 Stevanato Group
- 11.2.4.1. Overview
- 11.2.4.2. Products
- 11.2.4.3. SWOT Analysis
- 11.2.4.4. Recent Developments
- 11.2.4.5. Financials (Based on Availability)
- 11.2.5 West Pharmaceutical Services
- 11.2.5.1. Overview
- 11.2.5.2. Products
- 11.2.5.3. SWOT Analysis
- 11.2.5.4. Recent Developments
- 11.2.5.5. Financials (Based on Availability)
- 11.2.6 Phoenix Glass
- 11.2.6.1. Overview
- 11.2.6.2. Products
- 11.2.6.3. SWOT Analysis
- 11.2.6.4. Recent Developments
- 11.2.6.5. Financials (Based on Availability)
- 11.2.7 Pacific Vial Manufacturing
- 11.2.7.1. Overview
- 11.2.7.2. Products
- 11.2.7.3. SWOT Analysis
- 11.2.7.4. Recent Developments
- 11.2.7.5. Financials (Based on Availability)
- 11.2.8 Shandong Pharmaceutical Glass
- 11.2.8.1. Overview
- 11.2.8.2. Products
- 11.2.8.3. SWOT Analysis
- 11.2.8.4. Recent Developments
- 11.2.8.5. Financials (Based on Availability)
- 11.2.9 Anhui Huaxin Medicinal Glass Products
- 11.2.9.1. Overview
- 11.2.9.2. Products
- 11.2.9.3. SWOT Analysis
- 11.2.9.4. Recent Developments
- 11.2.9.5. Financials (Based on Availability)
- 11.2.10 Pioneer Impex
- 11.2.10.1. Overview
- 11.2.10.2. Products
- 11.2.10.3. SWOT Analysis
- 11.2.10.4. Recent Developments
- 11.2.10.5. Financials (Based on Availability)
- 11.2.11 SGD Pharma Group
- 11.2.11.1. Overview
- 11.2.11.2. Products
- 11.2.11.3. SWOT Analysis
- 11.2.11.4. Recent Developments
- 11.2.11.5. Financials (Based on Availability)
- 11.2.12 PGP Glass Company
- 11.2.12.1. Overview
- 11.2.12.2. Products
- 11.2.12.3. SWOT Analysis
- 11.2.12.4. Recent Developments
- 11.2.12.5. Financials (Based on Availability)
- 11.2.1 Dalton Pharma Services
List of Figures
- Figure 1: Global Transport Vials Revenue Breakdown (undefined, %) by Region 2025 & 2033
- Figure 2: Global Transport Vials Volume Breakdown (K, %) by Region 2025 & 2033
- Figure 3: North America Transport Vials Revenue (undefined), by Application 2025 & 2033
- Figure 4: North America Transport Vials Volume (K), by Application 2025 & 2033
- Figure 5: North America Transport Vials Revenue Share (%), by Application 2025 & 2033
- Figure 6: North America Transport Vials Volume Share (%), by Application 2025 & 2033
- Figure 7: North America Transport Vials Revenue (undefined), by Types 2025 & 2033
- Figure 8: North America Transport Vials Volume (K), by Types 2025 & 2033
- Figure 9: North America Transport Vials Revenue Share (%), by Types 2025 & 2033
- Figure 10: North America Transport Vials Volume Share (%), by Types 2025 & 2033
- Figure 11: North America Transport Vials Revenue (undefined), by Country 2025 & 2033
- Figure 12: North America Transport Vials Volume (K), by Country 2025 & 2033
- Figure 13: North America Transport Vials Revenue Share (%), by Country 2025 & 2033
- Figure 14: North America Transport Vials Volume Share (%), by Country 2025 & 2033
- Figure 15: South America Transport Vials Revenue (undefined), by Application 2025 & 2033
- Figure 16: South America Transport Vials Volume (K), by Application 2025 & 2033
- Figure 17: South America Transport Vials Revenue Share (%), by Application 2025 & 2033
- Figure 18: South America Transport Vials Volume Share (%), by Application 2025 & 2033
- Figure 19: South America Transport Vials Revenue (undefined), by Types 2025 & 2033
- Figure 20: South America Transport Vials Volume (K), by Types 2025 & 2033
- Figure 21: South America Transport Vials Revenue Share (%), by Types 2025 & 2033
- Figure 22: South America Transport Vials Volume Share (%), by Types 2025 & 2033
- Figure 23: South America Transport Vials Revenue (undefined), by Country 2025 & 2033
- Figure 24: South America Transport Vials Volume (K), by Country 2025 & 2033
- Figure 25: South America Transport Vials Revenue Share (%), by Country 2025 & 2033
- Figure 26: South America Transport Vials Volume Share (%), by Country 2025 & 2033
- Figure 27: Europe Transport Vials Revenue (undefined), by Application 2025 & 2033
- Figure 28: Europe Transport Vials Volume (K), by Application 2025 & 2033
- Figure 29: Europe Transport Vials Revenue Share (%), by Application 2025 & 2033
- Figure 30: Europe Transport Vials Volume Share (%), by Application 2025 & 2033
- Figure 31: Europe Transport Vials Revenue (undefined), by Types 2025 & 2033
- Figure 32: Europe Transport Vials Volume (K), by Types 2025 & 2033
- Figure 33: Europe Transport Vials Revenue Share (%), by Types 2025 & 2033
- Figure 34: Europe Transport Vials Volume Share (%), by Types 2025 & 2033
- Figure 35: Europe Transport Vials Revenue (undefined), by Country 2025 & 2033
- Figure 36: Europe Transport Vials Volume (K), by Country 2025 & 2033
- Figure 37: Europe Transport Vials Revenue Share (%), by Country 2025 & 2033
- Figure 38: Europe Transport Vials Volume Share (%), by Country 2025 & 2033
- Figure 39: Middle East & Africa Transport Vials Revenue (undefined), by Application 2025 & 2033
- Figure 40: Middle East & Africa Transport Vials Volume (K), by Application 2025 & 2033
- Figure 41: Middle East & Africa Transport Vials Revenue Share (%), by Application 2025 & 2033
- Figure 42: Middle East & Africa Transport Vials Volume Share (%), by Application 2025 & 2033
- Figure 43: Middle East & Africa Transport Vials Revenue (undefined), by Types 2025 & 2033
- Figure 44: Middle East & Africa Transport Vials Volume (K), by Types 2025 & 2033
- Figure 45: Middle East & Africa Transport Vials Revenue Share (%), by Types 2025 & 2033
- Figure 46: Middle East & Africa Transport Vials Volume Share (%), by Types 2025 & 2033
- Figure 47: Middle East & Africa Transport Vials Revenue (undefined), by Country 2025 & 2033
- Figure 48: Middle East & Africa Transport Vials Volume (K), by Country 2025 & 2033
- Figure 49: Middle East & Africa Transport Vials Revenue Share (%), by Country 2025 & 2033
- Figure 50: Middle East & Africa Transport Vials Volume Share (%), by Country 2025 & 2033
- Figure 51: Asia Pacific Transport Vials Revenue (undefined), by Application 2025 & 2033
- Figure 52: Asia Pacific Transport Vials Volume (K), by Application 2025 & 2033
- Figure 53: Asia Pacific Transport Vials Revenue Share (%), by Application 2025 & 2033
- Figure 54: Asia Pacific Transport Vials Volume Share (%), by Application 2025 & 2033
- Figure 55: Asia Pacific Transport Vials Revenue (undefined), by Types 2025 & 2033
- Figure 56: Asia Pacific Transport Vials Volume (K), by Types 2025 & 2033
- Figure 57: Asia Pacific Transport Vials Revenue Share (%), by Types 2025 & 2033
- Figure 58: Asia Pacific Transport Vials Volume Share (%), by Types 2025 & 2033
- Figure 59: Asia Pacific Transport Vials Revenue (undefined), by Country 2025 & 2033
- Figure 60: Asia Pacific Transport Vials Volume (K), by Country 2025 & 2033
- Figure 61: Asia Pacific Transport Vials Revenue Share (%), by Country 2025 & 2033
- Figure 62: Asia Pacific Transport Vials Volume Share (%), by Country 2025 & 2033
List of Tables
- Table 1: Global Transport Vials Revenue undefined Forecast, by Application 2020 & 2033
- Table 2: Global Transport Vials Volume K Forecast, by Application 2020 & 2033
- Table 3: Global Transport Vials Revenue undefined Forecast, by Types 2020 & 2033
- Table 4: Global Transport Vials Volume K Forecast, by Types 2020 & 2033
- Table 5: Global Transport Vials Revenue undefined Forecast, by Region 2020 & 2033
- Table 6: Global Transport Vials Volume K Forecast, by Region 2020 & 2033
- Table 7: Global Transport Vials Revenue undefined Forecast, by Application 2020 & 2033
- Table 8: Global Transport Vials Volume K Forecast, by Application 2020 & 2033
- Table 9: Global Transport Vials Revenue undefined Forecast, by Types 2020 & 2033
- Table 10: Global Transport Vials Volume K Forecast, by Types 2020 & 2033
- Table 11: Global Transport Vials Revenue undefined Forecast, by Country 2020 & 2033
- Table 12: Global Transport Vials Volume K Forecast, by Country 2020 & 2033
- Table 13: United States Transport Vials Revenue (undefined) Forecast, by Application 2020 & 2033
- Table 14: United States Transport Vials Volume (K) Forecast, by Application 2020 & 2033
- Table 15: Canada Transport Vials Revenue (undefined) Forecast, by Application 2020 & 2033
- Table 16: Canada Transport Vials Volume (K) Forecast, by Application 2020 & 2033
- Table 17: Mexico Transport Vials Revenue (undefined) Forecast, by Application 2020 & 2033
- Table 18: Mexico Transport Vials Volume (K) Forecast, by Application 2020 & 2033
- Table 19: Global Transport Vials Revenue undefined Forecast, by Application 2020 & 2033
- Table 20: Global Transport Vials Volume K Forecast, by Application 2020 & 2033
- Table 21: Global Transport Vials Revenue undefined Forecast, by Types 2020 & 2033
- Table 22: Global Transport Vials Volume K Forecast, by Types 2020 & 2033
- Table 23: Global Transport Vials Revenue undefined Forecast, by Country 2020 & 2033
- Table 24: Global Transport Vials Volume K Forecast, by Country 2020 & 2033
- Table 25: Brazil Transport Vials Revenue (undefined) Forecast, by Application 2020 & 2033
- Table 26: Brazil Transport Vials Volume (K) Forecast, by Application 2020 & 2033
- Table 27: Argentina Transport Vials Revenue (undefined) Forecast, by Application 2020 & 2033
- Table 28: Argentina Transport Vials Volume (K) Forecast, by Application 2020 & 2033
- Table 29: Rest of South America Transport Vials Revenue (undefined) Forecast, by Application 2020 & 2033
- Table 30: Rest of South America Transport Vials Volume (K) Forecast, by Application 2020 & 2033
- Table 31: Global Transport Vials Revenue undefined Forecast, by Application 2020 & 2033
- Table 32: Global Transport Vials Volume K Forecast, by Application 2020 & 2033
- Table 33: Global Transport Vials Revenue undefined Forecast, by Types 2020 & 2033
- Table 34: Global Transport Vials Volume K Forecast, by Types 2020 & 2033
- Table 35: Global Transport Vials Revenue undefined Forecast, by Country 2020 & 2033
- Table 36: Global Transport Vials Volume K Forecast, by Country 2020 & 2033
- Table 37: United Kingdom Transport Vials Revenue (undefined) Forecast, by Application 2020 & 2033
- Table 38: United Kingdom Transport Vials Volume (K) Forecast, by Application 2020 & 2033
- Table 39: Germany Transport Vials Revenue (undefined) Forecast, by Application 2020 & 2033
- Table 40: Germany Transport Vials Volume (K) Forecast, by Application 2020 & 2033
- Table 41: France Transport Vials Revenue (undefined) Forecast, by Application 2020 & 2033
- Table 42: France Transport Vials Volume (K) Forecast, by Application 2020 & 2033
- Table 43: Italy Transport Vials Revenue (undefined) Forecast, by Application 2020 & 2033
- Table 44: Italy Transport Vials Volume (K) Forecast, by Application 2020 & 2033
- Table 45: Spain Transport Vials Revenue (undefined) Forecast, by Application 2020 & 2033
- Table 46: Spain Transport Vials Volume (K) Forecast, by Application 2020 & 2033
- Table 47: Russia Transport Vials Revenue (undefined) Forecast, by Application 2020 & 2033
- Table 48: Russia Transport Vials Volume (K) Forecast, by Application 2020 & 2033
- Table 49: Benelux Transport Vials Revenue (undefined) Forecast, by Application 2020 & 2033
- Table 50: Benelux Transport Vials Volume (K) Forecast, by Application 2020 & 2033
- Table 51: Nordics Transport Vials Revenue (undefined) Forecast, by Application 2020 & 2033
- Table 52: Nordics Transport Vials Volume (K) Forecast, by Application 2020 & 2033
- Table 53: Rest of Europe Transport Vials Revenue (undefined) Forecast, by Application 2020 & 2033
- Table 54: Rest of Europe Transport Vials Volume (K) Forecast, by Application 2020 & 2033
- Table 55: Global Transport Vials Revenue undefined Forecast, by Application 2020 & 2033
- Table 56: Global Transport Vials Volume K Forecast, by Application 2020 & 2033
- Table 57: Global Transport Vials Revenue undefined Forecast, by Types 2020 & 2033
- Table 58: Global Transport Vials Volume K Forecast, by Types 2020 & 2033
- Table 59: Global Transport Vials Revenue undefined Forecast, by Country 2020 & 2033
- Table 60: Global Transport Vials Volume K Forecast, by Country 2020 & 2033
- Table 61: Turkey Transport Vials Revenue (undefined) Forecast, by Application 2020 & 2033
- Table 62: Turkey Transport Vials Volume (K) Forecast, by Application 2020 & 2033
- Table 63: Israel Transport Vials Revenue (undefined) Forecast, by Application 2020 & 2033
- Table 64: Israel Transport Vials Volume (K) Forecast, by Application 2020 & 2033
- Table 65: GCC Transport Vials Revenue (undefined) Forecast, by Application 2020 & 2033
- Table 66: GCC Transport Vials Volume (K) Forecast, by Application 2020 & 2033
- Table 67: North Africa Transport Vials Revenue (undefined) Forecast, by Application 2020 & 2033
- Table 68: North Africa Transport Vials Volume (K) Forecast, by Application 2020 & 2033
- Table 69: South Africa Transport Vials Revenue (undefined) Forecast, by Application 2020 & 2033
- Table 70: South Africa Transport Vials Volume (K) Forecast, by Application 2020 & 2033
- Table 71: Rest of Middle East & Africa Transport Vials Revenue (undefined) Forecast, by Application 2020 & 2033
- Table 72: Rest of Middle East & Africa Transport Vials Volume (K) Forecast, by Application 2020 & 2033
- Table 73: Global Transport Vials Revenue undefined Forecast, by Application 2020 & 2033
- Table 74: Global Transport Vials Volume K Forecast, by Application 2020 & 2033
- Table 75: Global Transport Vials Revenue undefined Forecast, by Types 2020 & 2033
- Table 76: Global Transport Vials Volume K Forecast, by Types 2020 & 2033
- Table 77: Global Transport Vials Revenue undefined Forecast, by Country 2020 & 2033
- Table 78: Global Transport Vials Volume K Forecast, by Country 2020 & 2033
- Table 79: China Transport Vials Revenue (undefined) Forecast, by Application 2020 & 2033
- Table 80: China Transport Vials Volume (K) Forecast, by Application 2020 & 2033
- Table 81: India Transport Vials Revenue (undefined) Forecast, by Application 2020 & 2033
- Table 82: India Transport Vials Volume (K) Forecast, by Application 2020 & 2033
- Table 83: Japan Transport Vials Revenue (undefined) Forecast, by Application 2020 & 2033
- Table 84: Japan Transport Vials Volume (K) Forecast, by Application 2020 & 2033
- Table 85: South Korea Transport Vials Revenue (undefined) Forecast, by Application 2020 & 2033
- Table 86: South Korea Transport Vials Volume (K) Forecast, by Application 2020 & 2033
- Table 87: ASEAN Transport Vials Revenue (undefined) Forecast, by Application 2020 & 2033
- Table 88: ASEAN Transport Vials Volume (K) Forecast, by Application 2020 & 2033
- Table 89: Oceania Transport Vials Revenue (undefined) Forecast, by Application 2020 & 2033
- Table 90: Oceania Transport Vials Volume (K) Forecast, by Application 2020 & 2033
- Table 91: Rest of Asia Pacific Transport Vials Revenue (undefined) Forecast, by Application 2020 & 2033
- Table 92: Rest of Asia Pacific Transport Vials Volume (K) Forecast, by Application 2020 & 2033
Frequently Asked Questions
1. What is the projected Compound Annual Growth Rate (CAGR) of the Transport Vials?
The projected CAGR is approximately 7%.
2. Which companies are prominent players in the Transport Vials?
Key companies in the market include Dalton Pharma Services, Gerresheimer, Schott, Stevanato Group, West Pharmaceutical Services, Phoenix Glass, Pacific Vial Manufacturing, Shandong Pharmaceutical Glass, Anhui Huaxin Medicinal Glass Products, Pioneer Impex, SGD Pharma Group, PGP Glass Company.
3. What are the main segments of the Transport Vials?
The market segments include Application, Types.
4. Can you provide details about the market size?
The market size is estimated to be USD XXX N/A as of 2022.
5. What are some drivers contributing to market growth?
N/A
6. What are the notable trends driving market growth?
N/A
7. Are there any restraints impacting market growth?
N/A
8. Can you provide examples of recent developments in the market?
N/A
9. What pricing options are available for accessing the report?
Pricing options include single-user, multi-user, and enterprise licenses priced at USD 3350.00, USD 5025.00, and USD 6700.00 respectively.
10. Is the market size provided in terms of value or volume?
The market size is provided in terms of value, measured in N/A and volume, measured in K.
11. Are there any specific market keywords associated with the report?
Yes, the market keyword associated with the report is "Transport Vials," which aids in identifying and referencing the specific market segment covered.
12. How do I determine which pricing option suits my needs best?
The pricing options vary based on user requirements and access needs. Individual users may opt for single-user licenses, while businesses requiring broader access may choose multi-user or enterprise licenses for cost-effective access to the report.
13. Are there any additional resources or data provided in the Transport Vials report?
While the report offers comprehensive insights, it's advisable to review the specific contents or supplementary materials provided to ascertain if additional resources or data are available.
14. How can I stay updated on further developments or reports in the Transport Vials?
To stay informed about further developments, trends, and reports in the Transport Vials, consider subscribing to industry newsletters, following relevant companies and organizations, or regularly checking reputable industry news sources and publications.
Methodology
Step 1 - Identification of Relevant Samples Size from Population Database


Step 2 - Approaches for Defining Global Market Size (Value, Volume* & Price*)

Note*: In applicable scenarios
Step 3 - Data Sources
Primary Research
- Web Analytics
- Survey Reports
- Research Institute
- Latest Research Reports
- Opinion Leaders
Secondary Research
- Annual Reports
- White Paper
- Latest Press Release
- Industry Association
- Paid Database
- Investor Presentations

Step 4 - Data Triangulation
Involves using different sources of information in order to increase the validity of a study
These sources are likely to be stakeholders in a program - participants, other researchers, program staff, other community members, and so on.
Then we put all data in single framework & apply various statistical tools to find out the dynamic on the market.
During the analysis stage, feedback from the stakeholder groups would be compared to determine areas of agreement as well as areas of divergence