

Key Insights
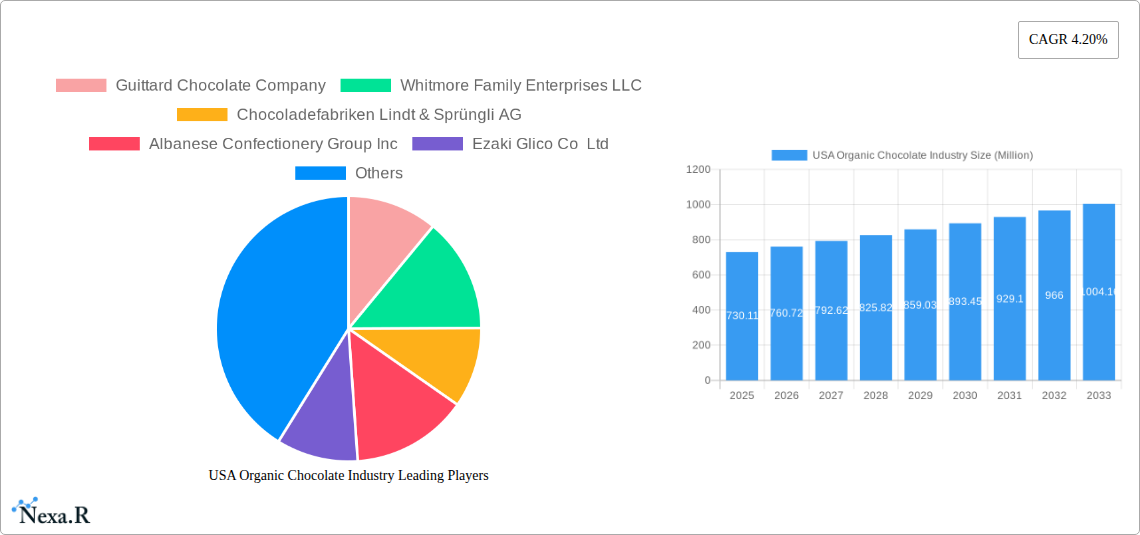
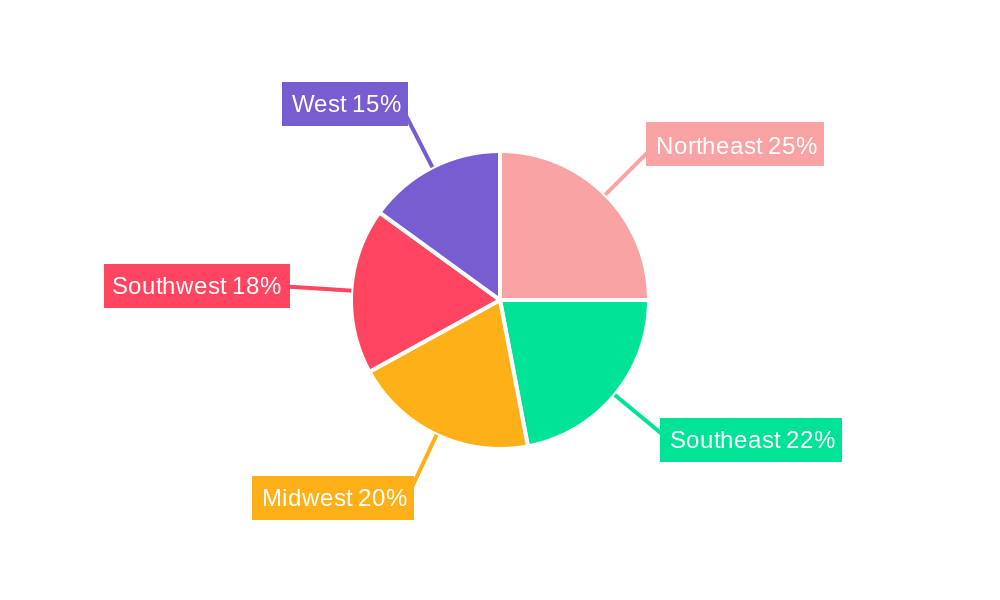
The US organic chocolate market, valued at $730.11 million in 2025, is projected to experience robust growth, driven by increasing consumer demand for healthier and ethically sourced confectionery products. The rising awareness of the health benefits of dark chocolate, coupled with a growing preference for organic and sustainable food choices, fuels this market expansion. Consumers are increasingly seeking out products with natural ingredients, free from artificial additives and preservatives, leading to a surge in demand for organic chocolate across various segments. The market is segmented by confectionery variant (dark, milk, and white chocolate), with dark chocolate expected to maintain its dominance due to its perceived health benefits. Distribution channels include convenience stores, online retail stores, and supermarkets/hypermarkets, with online retail showing significant growth potential as consumer shopping habits evolve. Key players like Hershey's, Mars, and Lindt are investing in organic chocolate lines, contributing to market competitiveness and innovation. However, factors like higher production costs and price sensitivity amongst certain consumer segments could pose challenges to the market's growth trajectory. The projected Compound Annual Growth Rate (CAGR) of 4.20% from 2025 to 2033 indicates a steady and promising outlook for the industry. Regional variations within the US, particularly amongst the Northeast, Southeast, Midwest, Southwest, and West, reflect differences in consumer preferences and purchasing power.
The sustained growth trajectory is predicted to continue due to several factors. The increasing prevalence of health and wellness trends continues to impact consumer choices, favoring organic and natural alternatives. The growing availability of organic chocolate in various formats and across a wide range of distribution channels is further bolstering market accessibility. Moreover, the increasing focus on sustainability and ethical sourcing within the chocolate industry is positively influencing consumer purchasing decisions, creating significant growth opportunities for ethically produced organic chocolate brands. Companies are responding by investing in research and development, creating innovative product lines, and adopting sustainable sourcing practices. This coupled with effective marketing strategies highlighting the benefits of organic chocolate will shape the market’s future.
This comprehensive report provides an in-depth analysis of the USA organic chocolate industry, covering market dynamics, growth trends, key players, and future outlook. The report utilizes data from 2019-2024 (Historical Period), with the base year set at 2025 (Base Year) and forecasts extending to 2033 (Forecast Period). The study period covers 2019-2033. Market values are presented in millions of units.
USA Organic Chocolate Industry Market Dynamics & Structure
The US organic chocolate market is a dynamic landscape shaped by several interconnected factors. Market concentration is moderate, with a few large players alongside numerous smaller, niche brands. Technological innovation, particularly in sustainable sourcing and production methods, is a key driver. Stringent regulatory frameworks surrounding organic certification and labeling influence both production and consumer choices. While confectionery is the dominant parent market, consumer demand for healthier alternatives has driven growth within the organic segment. Competitive product substitutes include other confectionery items, fruits, and snacks. End-user demographics skew toward health-conscious millennials and Gen Z, with growing interest among older consumers. M&A activity has been moderate, with larger players strategically acquiring smaller brands to expand their organic portfolios.
- Market Concentration: Moderately consolidated, with a Herfindahl-Hirschman Index (HHI) of xx.
- Technological Innovation: Focus on sustainable sourcing, reduced sugar content, and innovative flavors.
- Regulatory Framework: Strict organic certification standards, impacting production costs and market entry.
- Competitive Substitutes: Conventional chocolate, other confectionery, and healthy snacks.
- End-User Demographics: Health-conscious consumers, particularly millennials and Gen Z.
- M&A Trends: Moderate activity, with strategic acquisitions by larger players to expand organic offerings. xx M&A deals in the last 5 years.
USA Organic Chocolate Industry Growth Trends & Insights
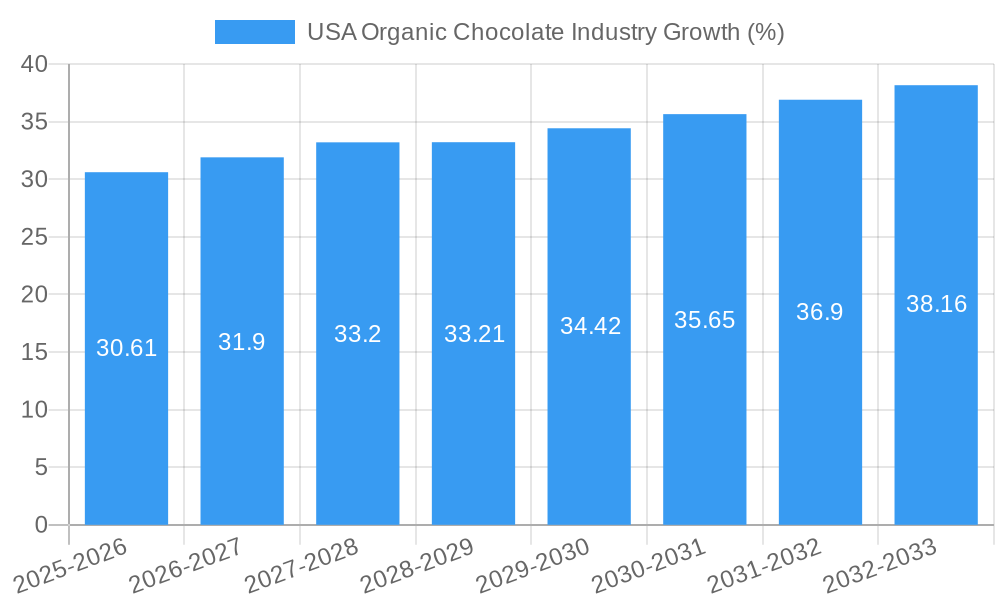
The US organic chocolate market has experienced robust growth over the past few years, driven by increasing consumer demand for healthier and ethically sourced food products. The market size has expanded significantly, reflecting a notable shift in consumer preferences. Adoption rates for organic chocolate are steadily increasing, driven by rising consumer awareness of health benefits and environmental sustainability. Technological disruptions, such as advancements in processing and packaging, have further enhanced product quality and shelf life. Consumer behavior is shifting towards premiumization, with a willingness to pay a premium for higher-quality, ethically sourced organic chocolate. This trend is further fueled by increased consumer confidence in organic certifications. The CAGR for the period 2019-2024 was xx%, and it is projected to reach xx% during 2025-2033. Market penetration is currently at xx% and is forecast to increase to xx% by 2033.
Dominant Regions, Countries, or Segments in USA Organic Chocolate Industry
The largest segment within the US organic chocolate market is the Supermarket/Hypermarket distribution channel, capturing xx% of market share in 2025, followed by online retail stores at xx%. This dominance is attributed to the widespread availability and convenience of these channels. Within confectionery variants, Milk Chocolate leads with a xx% market share, driven by its broad appeal and familiar taste profile. Regionally, the market is relatively evenly distributed across the country, with higher concentration in states with higher population density and greater disposable income.
- Key Drivers (Supermarket/Hypermarket): Extensive reach, established supply chains, and promotional opportunities.
- Key Drivers (Online Retail): Convenience, access to niche products, and targeted marketing capabilities.
- Key Drivers (Milk Chocolate): Broad consumer appeal, familiarity, and versatility in product offerings.
- Regional Dominance: Even distribution across major states, with higher concentrations in densely populated areas.
USA Organic Chocolate Industry Product Landscape
Organic chocolate products are increasingly diverse, featuring a wide range of flavors, forms (bars, candies, etc.), and packaging options. Many brands focus on unique selling propositions such as fair-trade sourcing, specific cocoa bean origins, and innovative flavor combinations. Technological advancements, including improvements in processing and preservation techniques, are contributing to higher product quality and extended shelf life. The market also sees a trend towards reduced sugar content and inclusion of functional ingredients.
Key Drivers, Barriers & Challenges in USA Organic Chocolate Industry
Key Drivers: Growing consumer awareness of health and ethical sourcing, increased demand for premium products, and technological advancements in sustainable production. Government initiatives promoting organic farming and food production also play a role.
Key Challenges: Higher production costs due to organic certification, volatile cocoa bean prices, and competition from conventional chocolate brands. Supply chain complexities and regulatory hurdles related to organic labeling can also present significant barriers. These challenges can lead to price increases and reduced market accessibility for certain segments.
Emerging Opportunities in USA Organic Chocolate Industry
Untapped markets include organic chocolate snacks and confectionery targeting specific dietary needs (e.g., vegan, gluten-free). Innovative applications of organic chocolate in new products like functional beverages and health supplements present substantial growth potential. Evolving consumer preferences for personalized and experiential products, such as subscription boxes and artisan chocolates, also create new opportunities.
Growth Accelerators in the USA Organic Chocolate Industry Industry
Technological advancements in sustainable farming practices, efficient processing techniques, and innovative packaging solutions are key growth accelerators. Strategic partnerships between chocolate producers, ingredient suppliers, and retailers enhance efficiency and market reach. Market expansion strategies targeting new consumer segments and geographical areas will further drive growth.
Key Players Shaping the USA Organic Chocolate Industry Market
- Guittard Chocolate Company
- Whitmore Family Enterprises LLC
- Chocoladefabriken Lindt & Sprüngli AG
- Albanese Confectionery Group Inc
- Ezaki Glico Co Ltd
- Vosges Haut-Chocolat LLC
- Salmon River Foods Inc
- Ferrero International SA
- TCHO Ventures Inc
- Mars Incorporated
- Yıldız Holding A.Ş.
- Barry Callebaut AG
- Mast Brothers & Co
- Mondelēz International Inc
- The Hershey Company
Notable Milestones in USA Organic Chocolate Industry Sector
- September 2022: Mondelēz International Inc. expanded its Green & Black premium organic chocolate brand with the launch of a new range, Smooth, in North America.
- October 2022: Lindt & Sprungli USA launched its first-ever 3D virtual store, enhancing brand engagement and online sales.
- November 2022: Yıldız Holding AS' brand GODIVA launched "Holiday Collection Packs" of premium chocolates, expanding product offerings during the peak holiday season.
In-Depth USA Organic Chocolate Industry Market Outlook
The US organic chocolate market is poised for sustained growth, driven by increasing consumer demand for healthier and ethically sourced products. The market is expected to experience significant expansion over the forecast period, presenting considerable opportunities for existing players and new entrants. Strategic investments in sustainable sourcing, product innovation, and efficient distribution channels will be critical for success in this competitive market. Companies focusing on premiumization, personalized offerings, and strong brand storytelling will be best positioned to capitalize on future growth prospects.
USA Organic Chocolate Industry Segmentation
-
1. Confectionery Variant
- 1.1. Dark Chocolate
- 1.2. Milk and White Chocolate
-
2. Distribution Channel
- 2.1. Convenience Store
- 2.2. Online Retail Store
- 2.3. Supermarket/Hypermarket
- 2.4. Others
USA Organic Chocolate Industry Segmentation By Geography
-
1. North America
- 1.1. United States
- 1.2. Canada
- 1.3. Mexico
-
2. South America
- 2.1. Brazil
- 2.2. Argentina
- 2.3. Rest of South America
-
3. Europe
- 3.1. United Kingdom
- 3.2. Germany
- 3.3. France
- 3.4. Italy
- 3.5. Spain
- 3.6. Russia
- 3.7. Benelux
- 3.8. Nordics
- 3.9. Rest of Europe
-
4. Middle East & Africa
- 4.1. Turkey
- 4.2. Israel
- 4.3. GCC
- 4.4. North Africa
- 4.5. South Africa
- 4.6. Rest of Middle East & Africa
-
5. Asia Pacific
- 5.1. China
- 5.2. India
- 5.3. Japan
- 5.4. South Korea
- 5.5. ASEAN
- 5.6. Oceania
- 5.7. Rest of Asia Pacific
USA Organic Chocolate Industry REPORT HIGHLIGHTS
| Aspects | Details |
|---|---|
| Study Period | 2019-2033 |
| Base Year | 2024 |
| Estimated Year | 2025 |
| Forecast Period | 2025-2033 |
| Historical Period | 2019-2024 |
| Growth Rate | CAGR of 4.20% from 2019-2033 |
| Segmentation |
|
Table of Contents
- 1. Introduction
- 1.1. Research Scope
- 1.2. Market Segmentation
- 1.3. Research Methodology
- 1.4. Definitions and Assumptions
- 2. Executive Summary
- 2.1. Introduction
- 3. Market Dynamics
- 3.1. Introduction
- 3.2. Market Drivers
- 3.2.1. Escalating Demand for Processed Poultry Products; Favorable Government Initiatives to Boost Production
- 3.3. Market Restrains
- 3.3.1. Rising Vegan Trend among Young Consumers; Deeper Penetration of Red Meat Across Saudi Arabia
- 3.4. Market Trends
- 3.4.1. OTHER KEY INDUSTRY TRENDS COVERED IN THE REPORT
- 4. Market Factor Analysis
- 4.1. Porters Five Forces
- 4.2. Supply/Value Chain
- 4.3. PESTEL analysis
- 4.4. Market Entropy
- 4.5. Patent/Trademark Analysis
- 5. Global USA Organic Chocolate Industry Analysis, Insights and Forecast, 2019-2031
- 5.1. Market Analysis, Insights and Forecast - by Confectionery Variant
- 5.1.1. Dark Chocolate
- 5.1.2. Milk and White Chocolate
- 5.2. Market Analysis, Insights and Forecast - by Distribution Channel
- 5.2.1. Convenience Store
- 5.2.2. Online Retail Store
- 5.2.3. Supermarket/Hypermarket
- 5.2.4. Others
- 5.3. Market Analysis, Insights and Forecast - by Region
- 5.3.1. North America
- 5.3.2. South America
- 5.3.3. Europe
- 5.3.4. Middle East & Africa
- 5.3.5. Asia Pacific
- 5.1. Market Analysis, Insights and Forecast - by Confectionery Variant
- 6. North America USA Organic Chocolate Industry Analysis, Insights and Forecast, 2019-2031
- 6.1. Market Analysis, Insights and Forecast - by Confectionery Variant
- 6.1.1. Dark Chocolate
- 6.1.2. Milk and White Chocolate
- 6.2. Market Analysis, Insights and Forecast - by Distribution Channel
- 6.2.1. Convenience Store
- 6.2.2. Online Retail Store
- 6.2.3. Supermarket/Hypermarket
- 6.2.4. Others
- 6.1. Market Analysis, Insights and Forecast - by Confectionery Variant
- 7. South America USA Organic Chocolate Industry Analysis, Insights and Forecast, 2019-2031
- 7.1. Market Analysis, Insights and Forecast - by Confectionery Variant
- 7.1.1. Dark Chocolate
- 7.1.2. Milk and White Chocolate
- 7.2. Market Analysis, Insights and Forecast - by Distribution Channel
- 7.2.1. Convenience Store
- 7.2.2. Online Retail Store
- 7.2.3. Supermarket/Hypermarket
- 7.2.4. Others
- 7.1. Market Analysis, Insights and Forecast - by Confectionery Variant
- 8. Europe USA Organic Chocolate Industry Analysis, Insights and Forecast, 2019-2031
- 8.1. Market Analysis, Insights and Forecast - by Confectionery Variant
- 8.1.1. Dark Chocolate
- 8.1.2. Milk and White Chocolate
- 8.2. Market Analysis, Insights and Forecast - by Distribution Channel
- 8.2.1. Convenience Store
- 8.2.2. Online Retail Store
- 8.2.3. Supermarket/Hypermarket
- 8.2.4. Others
- 8.1. Market Analysis, Insights and Forecast - by Confectionery Variant
- 9. Middle East & Africa USA Organic Chocolate Industry Analysis, Insights and Forecast, 2019-2031
- 9.1. Market Analysis, Insights and Forecast - by Confectionery Variant
- 9.1.1. Dark Chocolate
- 9.1.2. Milk and White Chocolate
- 9.2. Market Analysis, Insights and Forecast - by Distribution Channel
- 9.2.1. Convenience Store
- 9.2.2. Online Retail Store
- 9.2.3. Supermarket/Hypermarket
- 9.2.4. Others
- 9.1. Market Analysis, Insights and Forecast - by Confectionery Variant
- 10. Asia Pacific USA Organic Chocolate Industry Analysis, Insights and Forecast, 2019-2031
- 10.1. Market Analysis, Insights and Forecast - by Confectionery Variant
- 10.1.1. Dark Chocolate
- 10.1.2. Milk and White Chocolate
- 10.2. Market Analysis, Insights and Forecast - by Distribution Channel
- 10.2.1. Convenience Store
- 10.2.2. Online Retail Store
- 10.2.3. Supermarket/Hypermarket
- 10.2.4. Others
- 10.1. Market Analysis, Insights and Forecast - by Confectionery Variant
- 11. Northeast USA Organic Chocolate Industry Analysis, Insights and Forecast, 2019-2031
- 12. Southeast USA Organic Chocolate Industry Analysis, Insights and Forecast, 2019-2031
- 13. Midwest USA Organic Chocolate Industry Analysis, Insights and Forecast, 2019-2031
- 14. Southwest USA Organic Chocolate Industry Analysis, Insights and Forecast, 2019-2031
- 15. West USA Organic Chocolate Industry Analysis, Insights and Forecast, 2019-2031
- 16. Competitive Analysis
- 16.1. Global Market Share Analysis 2024
- 16.2. Company Profiles
- 16.2.1 Guittard Chocolate Company
- 16.2.1.1. Overview
- 16.2.1.2. Products
- 16.2.1.3. SWOT Analysis
- 16.2.1.4. Recent Developments
- 16.2.1.5. Financials (Based on Availability)
- 16.2.2 Whitmore Family Enterprises LLC
- 16.2.2.1. Overview
- 16.2.2.2. Products
- 16.2.2.3. SWOT Analysis
- 16.2.2.4. Recent Developments
- 16.2.2.5. Financials (Based on Availability)
- 16.2.3 Chocoladefabriken Lindt & Sprüngli AG
- 16.2.3.1. Overview
- 16.2.3.2. Products
- 16.2.3.3. SWOT Analysis
- 16.2.3.4. Recent Developments
- 16.2.3.5. Financials (Based on Availability)
- 16.2.4 Albanese Confectionery Group Inc
- 16.2.4.1. Overview
- 16.2.4.2. Products
- 16.2.4.3. SWOT Analysis
- 16.2.4.4. Recent Developments
- 16.2.4.5. Financials (Based on Availability)
- 16.2.5 Ezaki Glico Co Ltd
- 16.2.5.1. Overview
- 16.2.5.2. Products
- 16.2.5.3. SWOT Analysis
- 16.2.5.4. Recent Developments
- 16.2.5.5. Financials (Based on Availability)
- 16.2.6 Vosges Haut-Chocolat LLC
- 16.2.6.1. Overview
- 16.2.6.2. Products
- 16.2.6.3. SWOT Analysis
- 16.2.6.4. Recent Developments
- 16.2.6.5. Financials (Based on Availability)
- 16.2.7 Salmon River Foods Inc
- 16.2.7.1. Overview
- 16.2.7.2. Products
- 16.2.7.3. SWOT Analysis
- 16.2.7.4. Recent Developments
- 16.2.7.5. Financials (Based on Availability)
- 16.2.8 Ferrero International SA
- 16.2.8.1. Overview
- 16.2.8.2. Products
- 16.2.8.3. SWOT Analysis
- 16.2.8.4. Recent Developments
- 16.2.8.5. Financials (Based on Availability)
- 16.2.9 TCHO Ventures Inc
- 16.2.9.1. Overview
- 16.2.9.2. Products
- 16.2.9.3. SWOT Analysis
- 16.2.9.4. Recent Developments
- 16.2.9.5. Financials (Based on Availability)
- 16.2.10 Mars Incorporated
- 16.2.10.1. Overview
- 16.2.10.2. Products
- 16.2.10.3. SWOT Analysis
- 16.2.10.4. Recent Developments
- 16.2.10.5. Financials (Based on Availability)
- 16.2.11 Yıldız Holding A
- 16.2.11.1. Overview
- 16.2.11.2. Products
- 16.2.11.3. SWOT Analysis
- 16.2.11.4. Recent Developments
- 16.2.11.5. Financials (Based on Availability)
- 16.2.12 Barry Callebaut AG
- 16.2.12.1. Overview
- 16.2.12.2. Products
- 16.2.12.3. SWOT Analysis
- 16.2.12.4. Recent Developments
- 16.2.12.5. Financials (Based on Availability)
- 16.2.13 Mast Brothers & Co
- 16.2.13.1. Overview
- 16.2.13.2. Products
- 16.2.13.3. SWOT Analysis
- 16.2.13.4. Recent Developments
- 16.2.13.5. Financials (Based on Availability)
- 16.2.14 Mondelēz International Inc
- 16.2.14.1. Overview
- 16.2.14.2. Products
- 16.2.14.3. SWOT Analysis
- 16.2.14.4. Recent Developments
- 16.2.14.5. Financials (Based on Availability)
- 16.2.15 The Hershey Company
- 16.2.15.1. Overview
- 16.2.15.2. Products
- 16.2.15.3. SWOT Analysis
- 16.2.15.4. Recent Developments
- 16.2.15.5. Financials (Based on Availability)
- 16.2.1 Guittard Chocolate Company
List of Figures
- Figure 1: Global USA Organic Chocolate Industry Revenue Breakdown (Million, %) by Region 2024 & 2032
- Figure 2: Global USA Organic Chocolate Industry Volume Breakdown (Tons, %) by Region 2024 & 2032
- Figure 3: United states USA Organic Chocolate Industry Revenue (Million), by Country 2024 & 2032
- Figure 4: United states USA Organic Chocolate Industry Volume (Tons), by Country 2024 & 2032
- Figure 5: United states USA Organic Chocolate Industry Revenue Share (%), by Country 2024 & 2032
- Figure 6: United states USA Organic Chocolate Industry Volume Share (%), by Country 2024 & 2032
- Figure 7: North America USA Organic Chocolate Industry Revenue (Million), by Confectionery Variant 2024 & 2032
- Figure 8: North America USA Organic Chocolate Industry Volume (Tons), by Confectionery Variant 2024 & 2032
- Figure 9: North America USA Organic Chocolate Industry Revenue Share (%), by Confectionery Variant 2024 & 2032
- Figure 10: North America USA Organic Chocolate Industry Volume Share (%), by Confectionery Variant 2024 & 2032
- Figure 11: North America USA Organic Chocolate Industry Revenue (Million), by Distribution Channel 2024 & 2032
- Figure 12: North America USA Organic Chocolate Industry Volume (Tons), by Distribution Channel 2024 & 2032
- Figure 13: North America USA Organic Chocolate Industry Revenue Share (%), by Distribution Channel 2024 & 2032
- Figure 14: North America USA Organic Chocolate Industry Volume Share (%), by Distribution Channel 2024 & 2032
- Figure 15: North America USA Organic Chocolate Industry Revenue (Million), by Country 2024 & 2032
- Figure 16: North America USA Organic Chocolate Industry Volume (Tons), by Country 2024 & 2032
- Figure 17: North America USA Organic Chocolate Industry Revenue Share (%), by Country 2024 & 2032
- Figure 18: North America USA Organic Chocolate Industry Volume Share (%), by Country 2024 & 2032
- Figure 19: South America USA Organic Chocolate Industry Revenue (Million), by Confectionery Variant 2024 & 2032
- Figure 20: South America USA Organic Chocolate Industry Volume (Tons), by Confectionery Variant 2024 & 2032
- Figure 21: South America USA Organic Chocolate Industry Revenue Share (%), by Confectionery Variant 2024 & 2032
- Figure 22: South America USA Organic Chocolate Industry Volume Share (%), by Confectionery Variant 2024 & 2032
- Figure 23: South America USA Organic Chocolate Industry Revenue (Million), by Distribution Channel 2024 & 2032
- Figure 24: South America USA Organic Chocolate Industry Volume (Tons), by Distribution Channel 2024 & 2032
- Figure 25: South America USA Organic Chocolate Industry Revenue Share (%), by Distribution Channel 2024 & 2032
- Figure 26: South America USA Organic Chocolate Industry Volume Share (%), by Distribution Channel 2024 & 2032
- Figure 27: South America USA Organic Chocolate Industry Revenue (Million), by Country 2024 & 2032
- Figure 28: South America USA Organic Chocolate Industry Volume (Tons), by Country 2024 & 2032
- Figure 29: South America USA Organic Chocolate Industry Revenue Share (%), by Country 2024 & 2032
- Figure 30: South America USA Organic Chocolate Industry Volume Share (%), by Country 2024 & 2032
- Figure 31: Europe USA Organic Chocolate Industry Revenue (Million), by Confectionery Variant 2024 & 2032
- Figure 32: Europe USA Organic Chocolate Industry Volume (Tons), by Confectionery Variant 2024 & 2032
- Figure 33: Europe USA Organic Chocolate Industry Revenue Share (%), by Confectionery Variant 2024 & 2032
- Figure 34: Europe USA Organic Chocolate Industry Volume Share (%), by Confectionery Variant 2024 & 2032
- Figure 35: Europe USA Organic Chocolate Industry Revenue (Million), by Distribution Channel 2024 & 2032
- Figure 36: Europe USA Organic Chocolate Industry Volume (Tons), by Distribution Channel 2024 & 2032
- Figure 37: Europe USA Organic Chocolate Industry Revenue Share (%), by Distribution Channel 2024 & 2032
- Figure 38: Europe USA Organic Chocolate Industry Volume Share (%), by Distribution Channel 2024 & 2032
- Figure 39: Europe USA Organic Chocolate Industry Revenue (Million), by Country 2024 & 2032
- Figure 40: Europe USA Organic Chocolate Industry Volume (Tons), by Country 2024 & 2032
- Figure 41: Europe USA Organic Chocolate Industry Revenue Share (%), by Country 2024 & 2032
- Figure 42: Europe USA Organic Chocolate Industry Volume Share (%), by Country 2024 & 2032
- Figure 43: Middle East & Africa USA Organic Chocolate Industry Revenue (Million), by Confectionery Variant 2024 & 2032
- Figure 44: Middle East & Africa USA Organic Chocolate Industry Volume (Tons), by Confectionery Variant 2024 & 2032
- Figure 45: Middle East & Africa USA Organic Chocolate Industry Revenue Share (%), by Confectionery Variant 2024 & 2032
- Figure 46: Middle East & Africa USA Organic Chocolate Industry Volume Share (%), by Confectionery Variant 2024 & 2032
- Figure 47: Middle East & Africa USA Organic Chocolate Industry Revenue (Million), by Distribution Channel 2024 & 2032
- Figure 48: Middle East & Africa USA Organic Chocolate Industry Volume (Tons), by Distribution Channel 2024 & 2032
- Figure 49: Middle East & Africa USA Organic Chocolate Industry Revenue Share (%), by Distribution Channel 2024 & 2032
- Figure 50: Middle East & Africa USA Organic Chocolate Industry Volume Share (%), by Distribution Channel 2024 & 2032
- Figure 51: Middle East & Africa USA Organic Chocolate Industry Revenue (Million), by Country 2024 & 2032
- Figure 52: Middle East & Africa USA Organic Chocolate Industry Volume (Tons), by Country 2024 & 2032
- Figure 53: Middle East & Africa USA Organic Chocolate Industry Revenue Share (%), by Country 2024 & 2032
- Figure 54: Middle East & Africa USA Organic Chocolate Industry Volume Share (%), by Country 2024 & 2032
- Figure 55: Asia Pacific USA Organic Chocolate Industry Revenue (Million), by Confectionery Variant 2024 & 2032
- Figure 56: Asia Pacific USA Organic Chocolate Industry Volume (Tons), by Confectionery Variant 2024 & 2032
- Figure 57: Asia Pacific USA Organic Chocolate Industry Revenue Share (%), by Confectionery Variant 2024 & 2032
- Figure 58: Asia Pacific USA Organic Chocolate Industry Volume Share (%), by Confectionery Variant 2024 & 2032
- Figure 59: Asia Pacific USA Organic Chocolate Industry Revenue (Million), by Distribution Channel 2024 & 2032
- Figure 60: Asia Pacific USA Organic Chocolate Industry Volume (Tons), by Distribution Channel 2024 & 2032
- Figure 61: Asia Pacific USA Organic Chocolate Industry Revenue Share (%), by Distribution Channel 2024 & 2032
- Figure 62: Asia Pacific USA Organic Chocolate Industry Volume Share (%), by Distribution Channel 2024 & 2032
- Figure 63: Asia Pacific USA Organic Chocolate Industry Revenue (Million), by Country 2024 & 2032
- Figure 64: Asia Pacific USA Organic Chocolate Industry Volume (Tons), by Country 2024 & 2032
- Figure 65: Asia Pacific USA Organic Chocolate Industry Revenue Share (%), by Country 2024 & 2032
- Figure 66: Asia Pacific USA Organic Chocolate Industry Volume Share (%), by Country 2024 & 2032
List of Tables
- Table 1: Global USA Organic Chocolate Industry Revenue Million Forecast, by Region 2019 & 2032
- Table 2: Global USA Organic Chocolate Industry Volume Tons Forecast, by Region 2019 & 2032
- Table 3: Global USA Organic Chocolate Industry Revenue Million Forecast, by Confectionery Variant 2019 & 2032
- Table 4: Global USA Organic Chocolate Industry Volume Tons Forecast, by Confectionery Variant 2019 & 2032
- Table 5: Global USA Organic Chocolate Industry Revenue Million Forecast, by Distribution Channel 2019 & 2032
- Table 6: Global USA Organic Chocolate Industry Volume Tons Forecast, by Distribution Channel 2019 & 2032
- Table 7: Global USA Organic Chocolate Industry Revenue Million Forecast, by Region 2019 & 2032
- Table 8: Global USA Organic Chocolate Industry Volume Tons Forecast, by Region 2019 & 2032
- Table 9: Global USA Organic Chocolate Industry Revenue Million Forecast, by Country 2019 & 2032
- Table 10: Global USA Organic Chocolate Industry Volume Tons Forecast, by Country 2019 & 2032
- Table 11: Northeast USA Organic Chocolate Industry Revenue (Million) Forecast, by Application 2019 & 2032
- Table 12: Northeast USA Organic Chocolate Industry Volume (Tons) Forecast, by Application 2019 & 2032
- Table 13: Southeast USA Organic Chocolate Industry Revenue (Million) Forecast, by Application 2019 & 2032
- Table 14: Southeast USA Organic Chocolate Industry Volume (Tons) Forecast, by Application 2019 & 2032
- Table 15: Midwest USA Organic Chocolate Industry Revenue (Million) Forecast, by Application 2019 & 2032
- Table 16: Midwest USA Organic Chocolate Industry Volume (Tons) Forecast, by Application 2019 & 2032
- Table 17: Southwest USA Organic Chocolate Industry Revenue (Million) Forecast, by Application 2019 & 2032
- Table 18: Southwest USA Organic Chocolate Industry Volume (Tons) Forecast, by Application 2019 & 2032
- Table 19: West USA Organic Chocolate Industry Revenue (Million) Forecast, by Application 2019 & 2032
- Table 20: West USA Organic Chocolate Industry Volume (Tons) Forecast, by Application 2019 & 2032
- Table 21: Global USA Organic Chocolate Industry Revenue Million Forecast, by Confectionery Variant 2019 & 2032
- Table 22: Global USA Organic Chocolate Industry Volume Tons Forecast, by Confectionery Variant 2019 & 2032
- Table 23: Global USA Organic Chocolate Industry Revenue Million Forecast, by Distribution Channel 2019 & 2032
- Table 24: Global USA Organic Chocolate Industry Volume Tons Forecast, by Distribution Channel 2019 & 2032
- Table 25: Global USA Organic Chocolate Industry Revenue Million Forecast, by Country 2019 & 2032
- Table 26: Global USA Organic Chocolate Industry Volume Tons Forecast, by Country 2019 & 2032
- Table 27: United States USA Organic Chocolate Industry Revenue (Million) Forecast, by Application 2019 & 2032
- Table 28: United States USA Organic Chocolate Industry Volume (Tons) Forecast, by Application 2019 & 2032
- Table 29: Canada USA Organic Chocolate Industry Revenue (Million) Forecast, by Application 2019 & 2032
- Table 30: Canada USA Organic Chocolate Industry Volume (Tons) Forecast, by Application 2019 & 2032
- Table 31: Mexico USA Organic Chocolate Industry Revenue (Million) Forecast, by Application 2019 & 2032
- Table 32: Mexico USA Organic Chocolate Industry Volume (Tons) Forecast, by Application 2019 & 2032
- Table 33: Global USA Organic Chocolate Industry Revenue Million Forecast, by Confectionery Variant 2019 & 2032
- Table 34: Global USA Organic Chocolate Industry Volume Tons Forecast, by Confectionery Variant 2019 & 2032
- Table 35: Global USA Organic Chocolate Industry Revenue Million Forecast, by Distribution Channel 2019 & 2032
- Table 36: Global USA Organic Chocolate Industry Volume Tons Forecast, by Distribution Channel 2019 & 2032
- Table 37: Global USA Organic Chocolate Industry Revenue Million Forecast, by Country 2019 & 2032
- Table 38: Global USA Organic Chocolate Industry Volume Tons Forecast, by Country 2019 & 2032
- Table 39: Brazil USA Organic Chocolate Industry Revenue (Million) Forecast, by Application 2019 & 2032
- Table 40: Brazil USA Organic Chocolate Industry Volume (Tons) Forecast, by Application 2019 & 2032
- Table 41: Argentina USA Organic Chocolate Industry Revenue (Million) Forecast, by Application 2019 & 2032
- Table 42: Argentina USA Organic Chocolate Industry Volume (Tons) Forecast, by Application 2019 & 2032
- Table 43: Rest of South America USA Organic Chocolate Industry Revenue (Million) Forecast, by Application 2019 & 2032
- Table 44: Rest of South America USA Organic Chocolate Industry Volume (Tons) Forecast, by Application 2019 & 2032
- Table 45: Global USA Organic Chocolate Industry Revenue Million Forecast, by Confectionery Variant 2019 & 2032
- Table 46: Global USA Organic Chocolate Industry Volume Tons Forecast, by Confectionery Variant 2019 & 2032
- Table 47: Global USA Organic Chocolate Industry Revenue Million Forecast, by Distribution Channel 2019 & 2032
- Table 48: Global USA Organic Chocolate Industry Volume Tons Forecast, by Distribution Channel 2019 & 2032
- Table 49: Global USA Organic Chocolate Industry Revenue Million Forecast, by Country 2019 & 2032
- Table 50: Global USA Organic Chocolate Industry Volume Tons Forecast, by Country 2019 & 2032
- Table 51: United Kingdom USA Organic Chocolate Industry Revenue (Million) Forecast, by Application 2019 & 2032
- Table 52: United Kingdom USA Organic Chocolate Industry Volume (Tons) Forecast, by Application 2019 & 2032
- Table 53: Germany USA Organic Chocolate Industry Revenue (Million) Forecast, by Application 2019 & 2032
- Table 54: Germany USA Organic Chocolate Industry Volume (Tons) Forecast, by Application 2019 & 2032
- Table 55: France USA Organic Chocolate Industry Revenue (Million) Forecast, by Application 2019 & 2032
- Table 56: France USA Organic Chocolate Industry Volume (Tons) Forecast, by Application 2019 & 2032
- Table 57: Italy USA Organic Chocolate Industry Revenue (Million) Forecast, by Application 2019 & 2032
- Table 58: Italy USA Organic Chocolate Industry Volume (Tons) Forecast, by Application 2019 & 2032
- Table 59: Spain USA Organic Chocolate Industry Revenue (Million) Forecast, by Application 2019 & 2032
- Table 60: Spain USA Organic Chocolate Industry Volume (Tons) Forecast, by Application 2019 & 2032
- Table 61: Russia USA Organic Chocolate Industry Revenue (Million) Forecast, by Application 2019 & 2032
- Table 62: Russia USA Organic Chocolate Industry Volume (Tons) Forecast, by Application 2019 & 2032
- Table 63: Benelux USA Organic Chocolate Industry Revenue (Million) Forecast, by Application 2019 & 2032
- Table 64: Benelux USA Organic Chocolate Industry Volume (Tons) Forecast, by Application 2019 & 2032
- Table 65: Nordics USA Organic Chocolate Industry Revenue (Million) Forecast, by Application 2019 & 2032
- Table 66: Nordics USA Organic Chocolate Industry Volume (Tons) Forecast, by Application 2019 & 2032
- Table 67: Rest of Europe USA Organic Chocolate Industry Revenue (Million) Forecast, by Application 2019 & 2032
- Table 68: Rest of Europe USA Organic Chocolate Industry Volume (Tons) Forecast, by Application 2019 & 2032
- Table 69: Global USA Organic Chocolate Industry Revenue Million Forecast, by Confectionery Variant 2019 & 2032
- Table 70: Global USA Organic Chocolate Industry Volume Tons Forecast, by Confectionery Variant 2019 & 2032
- Table 71: Global USA Organic Chocolate Industry Revenue Million Forecast, by Distribution Channel 2019 & 2032
- Table 72: Global USA Organic Chocolate Industry Volume Tons Forecast, by Distribution Channel 2019 & 2032
- Table 73: Global USA Organic Chocolate Industry Revenue Million Forecast, by Country 2019 & 2032
- Table 74: Global USA Organic Chocolate Industry Volume Tons Forecast, by Country 2019 & 2032
- Table 75: Turkey USA Organic Chocolate Industry Revenue (Million) Forecast, by Application 2019 & 2032
- Table 76: Turkey USA Organic Chocolate Industry Volume (Tons) Forecast, by Application 2019 & 2032
- Table 77: Israel USA Organic Chocolate Industry Revenue (Million) Forecast, by Application 2019 & 2032
- Table 78: Israel USA Organic Chocolate Industry Volume (Tons) Forecast, by Application 2019 & 2032
- Table 79: GCC USA Organic Chocolate Industry Revenue (Million) Forecast, by Application 2019 & 2032
- Table 80: GCC USA Organic Chocolate Industry Volume (Tons) Forecast, by Application 2019 & 2032
- Table 81: North Africa USA Organic Chocolate Industry Revenue (Million) Forecast, by Application 2019 & 2032
- Table 82: North Africa USA Organic Chocolate Industry Volume (Tons) Forecast, by Application 2019 & 2032
- Table 83: South Africa USA Organic Chocolate Industry Revenue (Million) Forecast, by Application 2019 & 2032
- Table 84: South Africa USA Organic Chocolate Industry Volume (Tons) Forecast, by Application 2019 & 2032
- Table 85: Rest of Middle East & Africa USA Organic Chocolate Industry Revenue (Million) Forecast, by Application 2019 & 2032
- Table 86: Rest of Middle East & Africa USA Organic Chocolate Industry Volume (Tons) Forecast, by Application 2019 & 2032
- Table 87: Global USA Organic Chocolate Industry Revenue Million Forecast, by Confectionery Variant 2019 & 2032
- Table 88: Global USA Organic Chocolate Industry Volume Tons Forecast, by Confectionery Variant 2019 & 2032
- Table 89: Global USA Organic Chocolate Industry Revenue Million Forecast, by Distribution Channel 2019 & 2032
- Table 90: Global USA Organic Chocolate Industry Volume Tons Forecast, by Distribution Channel 2019 & 2032
- Table 91: Global USA Organic Chocolate Industry Revenue Million Forecast, by Country 2019 & 2032
- Table 92: Global USA Organic Chocolate Industry Volume Tons Forecast, by Country 2019 & 2032
- Table 93: China USA Organic Chocolate Industry Revenue (Million) Forecast, by Application 2019 & 2032
- Table 94: China USA Organic Chocolate Industry Volume (Tons) Forecast, by Application 2019 & 2032
- Table 95: India USA Organic Chocolate Industry Revenue (Million) Forecast, by Application 2019 & 2032
- Table 96: India USA Organic Chocolate Industry Volume (Tons) Forecast, by Application 2019 & 2032
- Table 97: Japan USA Organic Chocolate Industry Revenue (Million) Forecast, by Application 2019 & 2032
- Table 98: Japan USA Organic Chocolate Industry Volume (Tons) Forecast, by Application 2019 & 2032
- Table 99: South Korea USA Organic Chocolate Industry Revenue (Million) Forecast, by Application 2019 & 2032
- Table 100: South Korea USA Organic Chocolate Industry Volume (Tons) Forecast, by Application 2019 & 2032
- Table 101: ASEAN USA Organic Chocolate Industry Revenue (Million) Forecast, by Application 2019 & 2032
- Table 102: ASEAN USA Organic Chocolate Industry Volume (Tons) Forecast, by Application 2019 & 2032
- Table 103: Oceania USA Organic Chocolate Industry Revenue (Million) Forecast, by Application 2019 & 2032
- Table 104: Oceania USA Organic Chocolate Industry Volume (Tons) Forecast, by Application 2019 & 2032
- Table 105: Rest of Asia Pacific USA Organic Chocolate Industry Revenue (Million) Forecast, by Application 2019 & 2032
- Table 106: Rest of Asia Pacific USA Organic Chocolate Industry Volume (Tons) Forecast, by Application 2019 & 2032
Frequently Asked Questions
1. What is the projected Compound Annual Growth Rate (CAGR) of the USA Organic Chocolate Industry?
The projected CAGR is approximately 4.20%.
2. Which companies are prominent players in the USA Organic Chocolate Industry?
Key companies in the market include Guittard Chocolate Company, Whitmore Family Enterprises LLC, Chocoladefabriken Lindt & Sprüngli AG, Albanese Confectionery Group Inc, Ezaki Glico Co Ltd, Vosges Haut-Chocolat LLC, Salmon River Foods Inc, Ferrero International SA, TCHO Ventures Inc, Mars Incorporated, Yıldız Holding A, Barry Callebaut AG, Mast Brothers & Co, Mondelēz International Inc, The Hershey Company.
3. What are the main segments of the USA Organic Chocolate Industry?
The market segments include Confectionery Variant, Distribution Channel.
4. Can you provide details about the market size?
The market size is estimated to be USD 730.11 Million as of 2022.
5. What are some drivers contributing to market growth?
Escalating Demand for Processed Poultry Products; Favorable Government Initiatives to Boost Production.
6. What are the notable trends driving market growth?
OTHER KEY INDUSTRY TRENDS COVERED IN THE REPORT.
7. Are there any restraints impacting market growth?
Rising Vegan Trend among Young Consumers; Deeper Penetration of Red Meat Across Saudi Arabia.
8. Can you provide examples of recent developments in the market?
November 2022: Yıldız Holding AS' brand GODIVA launched "Holiday Collection Packs" of premium chocolates. The chocolate packs include Milk Chocolate Praline Heart, Midnight Swirl, and White Chocolate Raspberry Star.October 2022: Lindt & Sprungli USA launched its first-ever 3D virtual store. Lindt's new online storefront allows consumers across the country to engage in the enchanting brand experience of a Lindt Chocolate store from the comfort of their homes or even on the go.September 2022: Mondelēz International Inc. expanded its Green & Black premium organic chocolate brand with the launch of a new range, Smooth, in North America.
9. What pricing options are available for accessing the report?
Pricing options include single-user, multi-user, and enterprise licenses priced at USD 3800, USD 4500, and USD 5800 respectively.
10. Is the market size provided in terms of value or volume?
The market size is provided in terms of value, measured in Million and volume, measured in Tons.
11. Are there any specific market keywords associated with the report?
Yes, the market keyword associated with the report is "USA Organic Chocolate Industry," which aids in identifying and referencing the specific market segment covered.
12. How do I determine which pricing option suits my needs best?
The pricing options vary based on user requirements and access needs. Individual users may opt for single-user licenses, while businesses requiring broader access may choose multi-user or enterprise licenses for cost-effective access to the report.
13. Are there any additional resources or data provided in the USA Organic Chocolate Industry report?
While the report offers comprehensive insights, it's advisable to review the specific contents or supplementary materials provided to ascertain if additional resources or data are available.
14. How can I stay updated on further developments or reports in the USA Organic Chocolate Industry?
To stay informed about further developments, trends, and reports in the USA Organic Chocolate Industry, consider subscribing to industry newsletters, following relevant companies and organizations, or regularly checking reputable industry news sources and publications.
Methodology
Step 1 - Identification of Relevant Samples Size from Population Database


Step 2 - Approaches for Defining Global Market Size (Value, Volume* & Price*)

Note*: In applicable scenarios
Step 3 - Data Sources
Primary Research
- Web Analytics
- Survey Reports
- Research Institute
- Latest Research Reports
- Opinion Leaders
Secondary Research
- Annual Reports
- White Paper
- Latest Press Release
- Industry Association
- Paid Database
- Investor Presentations

Step 4 - Data Triangulation
Involves using different sources of information in order to increase the validity of a study
These sources are likely to be stakeholders in a program - participants, other researchers, program staff, other community members, and so on.
Then we put all data in single framework & apply various statistical tools to find out the dynamic on the market.
During the analysis stage, feedback from the stakeholder groups would be compared to determine areas of agreement as well as areas of divergence
