

Key Insights
The global vials packaging market is poised for significant expansion, propelled by robust growth in the pharmaceutical and biotechnology sectors. Key drivers include rising demand for injectable pharmaceuticals and stringent regulatory mandates for sterile and secure packaging solutions. The market is segmented by material (glass, plastic), vial type (single-dose, multi-dose), and application (pharmaceuticals, biotechnology). Glass vials remain the preferred choice for their superior inertness and barrier properties, essential for drug integrity. Plastic vials are increasingly adopted for their cost-effectiveness and reduced breakage risk. Emerging economies with expanding healthcare infrastructure are expected to be major growth contributors. Industry participants are investing in advanced automated filling and sealing technologies to optimize efficiency and cost. Innovations in tamper-evident and sterility-focused packaging designs are also shaping market dynamics.
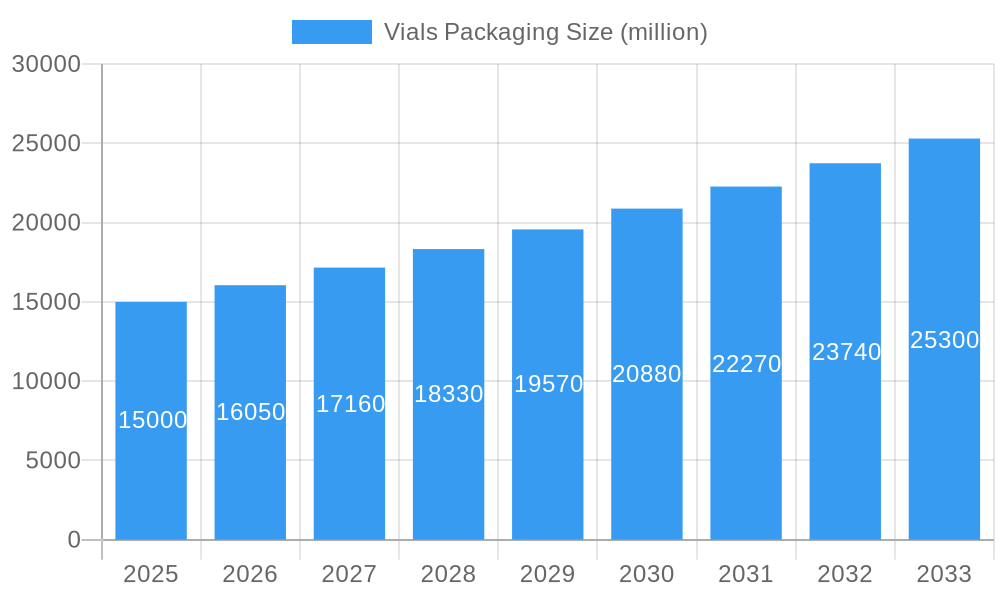
Vials Packaging Market Size (In Billion)
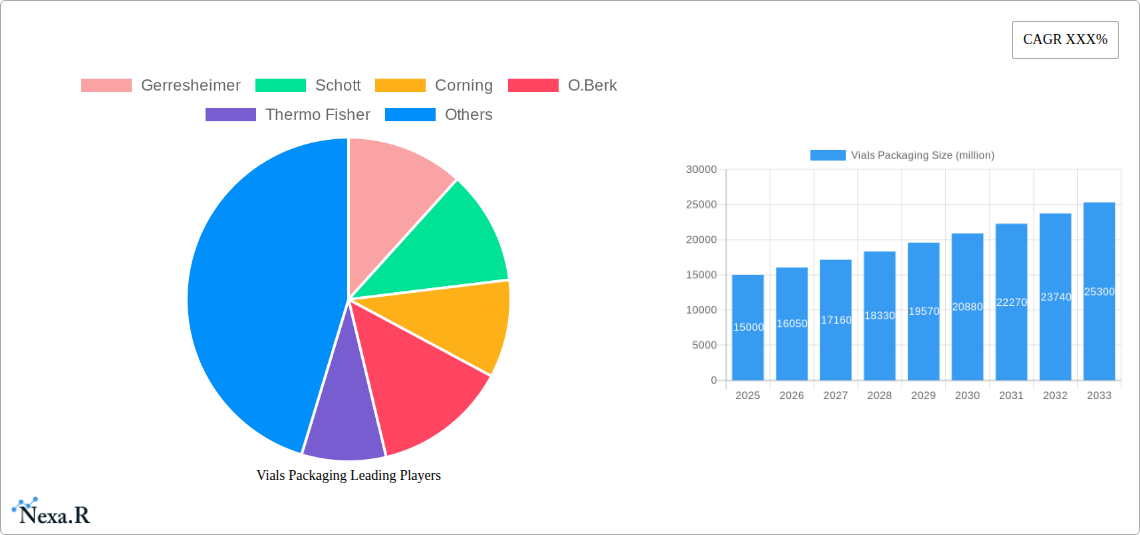
The vials packaging market is characterized by intense competition among established global leaders and agile emerging players. Prominent companies like Gerresheimer, Schott, Corning, and Thermo Fisher Scientific leverage their manufacturing scale and distribution networks. Specialized firms are carving out market share through niche offerings and innovative solutions. Future growth will be shaped by material science advancements, increasing demand for sustainable packaging, and the evolving requirements of pharmaceutical manufacturers. Continuous drug development and approvals will further fuel demand. The market is projected to reach $23.23 billion by 2025, with an estimated Compound Annual Growth Rate (CAGR) of 8.8% from 2025 to 2033.
Vials Packaging Company Market Share
Vials Packaging Market Report: 2019-2033
This comprehensive report provides an in-depth analysis of the global vials packaging market, encompassing historical data (2019-2024), current estimates (2025), and future forecasts (2025-2033). The study covers key market segments, leading players, and emerging trends, offering valuable insights for industry professionals, investors, and strategic decision-makers. The market is segmented by material type (glass, plastic), vial type (clear, amber), end-use (pharmaceuticals, diagnostics), and region. The report utilizes both quantitative and qualitative data to paint a holistic picture of the vials packaging landscape, projecting a market size exceeding xx million units by 2033.
Vials Packaging Market Dynamics & Structure
The vials packaging market is characterized by a moderately consolidated structure, with several major players holding significant market share. The industry is driven by technological advancements in materials science, resulting in improved barrier properties, enhanced sterility, and reduced breakage rates. Stringent regulatory frameworks, particularly in the pharmaceutical sector, dictate packaging quality and safety standards, creating both opportunities and challenges for manufacturers. Competitive pressure arises from both established players and emerging entrants offering innovative packaging solutions. Furthermore, the increasing demand for injectable pharmaceuticals and diagnostic applications globally fuels market growth. M&A activity has been moderate in recent years, with strategic acquisitions aimed at expanding product portfolios and geographic reach. The estimated deal volume for the period 2019-2024 was approximately xx deals.
- Market Concentration: Moderately consolidated, with top 5 players holding approximately xx% market share in 2024.
- Technological Innovation: Focus on sustainable materials (e.g., recycled glass), enhanced barrier properties, and improved labeling technologies.
- Regulatory Landscape: Stringent regulations regarding sterility, safety, and labeling in pharmaceutical applications.
- Competitive Substitutes: Limited direct substitutes, with competition primarily focused on product differentiation and cost optimization.
- End-User Demographics: Predominantly driven by pharmaceutical and biotechnology companies, with increasing demand from diagnostic and other healthcare sectors.
- M&A Trends: Moderate activity, driven by expansion of product lines and geographical reach.
Vials Packaging Growth Trends & Insights
The global vials packaging market experienced robust growth during the historical period (2019-2024), driven by increasing demand for injectable drugs and diagnostics. The market size expanded from xx million units in 2019 to xx million units in 2024, reflecting a CAGR of xx%. This growth is expected to continue throughout the forecast period (2025-2033), with a projected CAGR of xx%, reaching over xx million units by 2033. Technological advancements, such as the adoption of more sustainable and lightweight materials, are expected to contribute significantly to market growth. Changes in consumer preferences toward convenient and user-friendly packaging are also shaping market trends, promoting innovations in vial designs and labeling. Market penetration in emerging economies remains relatively low, offering substantial untapped potential for future expansion.
Dominant Regions, Countries, or Segments in Vials Packaging
North America and Europe currently dominate the vials packaging market, driven by established pharmaceutical industries and stringent regulatory frameworks. However, Asia-Pacific is expected to witness significant growth over the forecast period, fueled by increasing healthcare expenditure and a growing pharmaceutical manufacturing base in countries like India and China. The pharmaceutical segment remains the largest end-use market for vials packaging, driven by the significant use of injectable drugs.
- Key Drivers in North America: Well-established pharmaceutical industry, high adoption rates of advanced packaging technologies.
- Key Drivers in Europe: Strong regulatory framework, high focus on quality and safety standards.
- Key Drivers in Asia-Pacific: Rapid economic growth, increasing healthcare expenditure, expanding pharmaceutical manufacturing capacity.
- Market Share: North America holds approximately xx% market share in 2024, followed by Europe at xx% and Asia-Pacific at xx%.
Vials Packaging Product Landscape
The vials packaging market offers a wide range of products, including glass and plastic vials of varying sizes and shapes. Innovation focuses on improving barrier properties to protect drug efficacy, enhancing sterility to prevent contamination, and improving convenience for healthcare providers and patients. Notable advancements include the development of sustainable materials, such as recycled glass and bio-based plastics, and the integration of smart packaging technologies for enhanced traceability and security. Unique selling propositions often involve optimized designs for automated filling processes, resulting in improved production efficiency.
Key Drivers, Barriers & Challenges in Vials Packaging
Key Drivers:
- Growing demand for injectable pharmaceuticals and biologics.
- Increasing focus on drug safety and product stability.
- Advancements in packaging materials and technologies.
- Stringent regulatory requirements pushing innovation.
Key Challenges:
- Fluctuations in raw material prices (e.g., glass, plastic).
- Stringent quality control and regulatory compliance requirements.
- Intense competition among established and emerging players.
- Supply chain disruptions impacting manufacturing and delivery. These disruptions led to a xx% increase in lead times in 2022.
Emerging Opportunities in Vials Packaging
- Growing demand for sustainable and eco-friendly packaging solutions.
- Expansion into emerging markets with untapped potential.
- Development of innovative packaging designs for improved drug delivery.
- Integration of smart packaging technologies for enhanced security and traceability.
Growth Accelerators in the Vials Packaging Industry
Technological breakthroughs in materials science and manufacturing processes are accelerating market growth. Strategic partnerships between packaging companies and pharmaceutical manufacturers are fostering innovation and streamlining supply chains. Expanding into emerging markets and focusing on niche applications (e.g., personalized medicine) are key expansion strategies for market leaders.
Key Players Shaping the Vials Packaging Market
- Gerresheimer
- Schott
- Corning
- O.Berk
- Thermo Fisher
- Acme Vials and Glass Company
- Akey Group
- Amposan
- BMT Corporation
- Friedrich & Dimmock
- Hindusthan National Glass & Industries
- Jinarth pharma packaging
- Kishore Group
- Pacific Vials
- TricorBraun
- Wheaton Industries
Notable Milestones in Vials Packaging Sector
- 2020: Introduction of a new line of sustainable glass vials by Gerresheimer.
- 2021: Acquisition of a smaller packaging company by Schott, expanding its product portfolio.
- 2022: Launch of a new plastic vial with improved barrier properties by Thermo Fisher.
- 2023: Implementation of new industry standards for vial sterilization by regulatory bodies in Europe.
In-Depth Vials Packaging Market Outlook
The future of the vials packaging market appears bright, driven by the continuous growth of the pharmaceutical and biotechnology sectors. Further technological advancements in materials and manufacturing will lead to even more sustainable and efficient packaging solutions. Strategic partnerships and acquisitions will continue to shape the industry landscape. Expansion into emerging markets and the development of innovative applications will offer significant opportunities for market players to achieve robust growth in the coming years.
Vials Packaging Segmentation
-
1. Application
- 1.1. Medical
- 1.2. Agriculture Industry
- 1.3. Food & Beverages
- 1.4. Other
-
2. Type
- 2.1. Glass
- 2.2. Plastic
- 2.3. Other
Vials Packaging Segmentation By Geography
-
1. North America
- 1.1. United States
- 1.2. Canada
- 1.3. Mexico
-
2. South America
- 2.1. Brazil
- 2.2. Argentina
- 2.3. Rest of South America
-
3. Europe
- 3.1. United Kingdom
- 3.2. Germany
- 3.3. France
- 3.4. Italy
- 3.5. Spain
- 3.6. Russia
- 3.7. Benelux
- 3.8. Nordics
- 3.9. Rest of Europe
-
4. Middle East & Africa
- 4.1. Turkey
- 4.2. Israel
- 4.3. GCC
- 4.4. North Africa
- 4.5. South Africa
- 4.6. Rest of Middle East & Africa
-
5. Asia Pacific
- 5.1. China
- 5.2. India
- 5.3. Japan
- 5.4. South Korea
- 5.5. ASEAN
- 5.6. Oceania
- 5.7. Rest of Asia Pacific

Vials Packaging Regional Market Share
Geographic Coverage of Vials Packaging
Vials Packaging REPORT HIGHLIGHTS
| Aspects | Details |
|---|---|
| Study Period | 2020-2034 |
| Base Year | 2025 |
| Estimated Year | 2026 |
| Forecast Period | 2026-2034 |
| Historical Period | 2020-2025 |
| Growth Rate | CAGR of 8.8% from 2020-2034 |
| Segmentation |
|
Table of Contents
- 1. Introduction
- 1.1. Research Scope
- 1.2. Market Segmentation
- 1.3. Research Methodology
- 1.4. Definitions and Assumptions
- 2. Executive Summary
- 2.1. Introduction
- 3. Market Dynamics
- 3.1. Introduction
- 3.2. Market Drivers
- 3.3. Market Restrains
- 3.4. Market Trends
- 4. Market Factor Analysis
- 4.1. Porters Five Forces
- 4.2. Supply/Value Chain
- 4.3. PESTEL analysis
- 4.4. Market Entropy
- 4.5. Patent/Trademark Analysis
- 5. Global Vials Packaging Analysis, Insights and Forecast, 2020-2032
- 5.1. Market Analysis, Insights and Forecast - by Application
- 5.1.1. Medical
- 5.1.2. Agriculture Industry
- 5.1.3. Food & Beverages
- 5.1.4. Other
- 5.2. Market Analysis, Insights and Forecast - by Type
- 5.2.1. Glass
- 5.2.2. Plastic
- 5.2.3. Other
- 5.3. Market Analysis, Insights and Forecast - by Region
- 5.3.1. North America
- 5.3.2. South America
- 5.3.3. Europe
- 5.3.4. Middle East & Africa
- 5.3.5. Asia Pacific
- 5.1. Market Analysis, Insights and Forecast - by Application
- 6. North America Vials Packaging Analysis, Insights and Forecast, 2020-2032
- 6.1. Market Analysis, Insights and Forecast - by Application
- 6.1.1. Medical
- 6.1.2. Agriculture Industry
- 6.1.3. Food & Beverages
- 6.1.4. Other
- 6.2. Market Analysis, Insights and Forecast - by Type
- 6.2.1. Glass
- 6.2.2. Plastic
- 6.2.3. Other
- 6.1. Market Analysis, Insights and Forecast - by Application
- 7. South America Vials Packaging Analysis, Insights and Forecast, 2020-2032
- 7.1. Market Analysis, Insights and Forecast - by Application
- 7.1.1. Medical
- 7.1.2. Agriculture Industry
- 7.1.3. Food & Beverages
- 7.1.4. Other
- 7.2. Market Analysis, Insights and Forecast - by Type
- 7.2.1. Glass
- 7.2.2. Plastic
- 7.2.3. Other
- 7.1. Market Analysis, Insights and Forecast - by Application
- 8. Europe Vials Packaging Analysis, Insights and Forecast, 2020-2032
- 8.1. Market Analysis, Insights and Forecast - by Application
- 8.1.1. Medical
- 8.1.2. Agriculture Industry
- 8.1.3. Food & Beverages
- 8.1.4. Other
- 8.2. Market Analysis, Insights and Forecast - by Type
- 8.2.1. Glass
- 8.2.2. Plastic
- 8.2.3. Other
- 8.1. Market Analysis, Insights and Forecast - by Application
- 9. Middle East & Africa Vials Packaging Analysis, Insights and Forecast, 2020-2032
- 9.1. Market Analysis, Insights and Forecast - by Application
- 9.1.1. Medical
- 9.1.2. Agriculture Industry
- 9.1.3. Food & Beverages
- 9.1.4. Other
- 9.2. Market Analysis, Insights and Forecast - by Type
- 9.2.1. Glass
- 9.2.2. Plastic
- 9.2.3. Other
- 9.1. Market Analysis, Insights and Forecast - by Application
- 10. Asia Pacific Vials Packaging Analysis, Insights and Forecast, 2020-2032
- 10.1. Market Analysis, Insights and Forecast - by Application
- 10.1.1. Medical
- 10.1.2. Agriculture Industry
- 10.1.3. Food & Beverages
- 10.1.4. Other
- 10.2. Market Analysis, Insights and Forecast - by Type
- 10.2.1. Glass
- 10.2.2. Plastic
- 10.2.3. Other
- 10.1. Market Analysis, Insights and Forecast - by Application
- 11. Competitive Analysis
- 11.1. Global Market Share Analysis 2025
- 11.2. Company Profiles
- 11.2.1 Gerresheimer
- 11.2.1.1. Overview
- 11.2.1.2. Products
- 11.2.1.3. SWOT Analysis
- 11.2.1.4. Recent Developments
- 11.2.1.5. Financials (Based on Availability)
- 11.2.2 Schott
- 11.2.2.1. Overview
- 11.2.2.2. Products
- 11.2.2.3. SWOT Analysis
- 11.2.2.4. Recent Developments
- 11.2.2.5. Financials (Based on Availability)
- 11.2.3 Corning
- 11.2.3.1. Overview
- 11.2.3.2. Products
- 11.2.3.3. SWOT Analysis
- 11.2.3.4. Recent Developments
- 11.2.3.5. Financials (Based on Availability)
- 11.2.4 O.Berk
- 11.2.4.1. Overview
- 11.2.4.2. Products
- 11.2.4.3. SWOT Analysis
- 11.2.4.4. Recent Developments
- 11.2.4.5. Financials (Based on Availability)
- 11.2.5 Thermo Fisher
- 11.2.5.1. Overview
- 11.2.5.2. Products
- 11.2.5.3. SWOT Analysis
- 11.2.5.4. Recent Developments
- 11.2.5.5. Financials (Based on Availability)
- 11.2.6 Acme Vials and Glass Company
- 11.2.6.1. Overview
- 11.2.6.2. Products
- 11.2.6.3. SWOT Analysis
- 11.2.6.4. Recent Developments
- 11.2.6.5. Financials (Based on Availability)
- 11.2.7 Akey Group
- 11.2.7.1. Overview
- 11.2.7.2. Products
- 11.2.7.3. SWOT Analysis
- 11.2.7.4. Recent Developments
- 11.2.7.5. Financials (Based on Availability)
- 11.2.8 Amposan
- 11.2.8.1. Overview
- 11.2.8.2. Products
- 11.2.8.3. SWOT Analysis
- 11.2.8.4. Recent Developments
- 11.2.8.5. Financials (Based on Availability)
- 11.2.9 BMT Corporation
- 11.2.9.1. Overview
- 11.2.9.2. Products
- 11.2.9.3. SWOT Analysis
- 11.2.9.4. Recent Developments
- 11.2.9.5. Financials (Based on Availability)
- 11.2.10 Friedrich & Dimmock
- 11.2.10.1. Overview
- 11.2.10.2. Products
- 11.2.10.3. SWOT Analysis
- 11.2.10.4. Recent Developments
- 11.2.10.5. Financials (Based on Availability)
- 11.2.11 Hindusthan National Glass & Industries
- 11.2.11.1. Overview
- 11.2.11.2. Products
- 11.2.11.3. SWOT Analysis
- 11.2.11.4. Recent Developments
- 11.2.11.5. Financials (Based on Availability)
- 11.2.12 Jinarth pharma packaging
- 11.2.12.1. Overview
- 11.2.12.2. Products
- 11.2.12.3. SWOT Analysis
- 11.2.12.4. Recent Developments
- 11.2.12.5. Financials (Based on Availability)
- 11.2.13 Kishore Group
- 11.2.13.1. Overview
- 11.2.13.2. Products
- 11.2.13.3. SWOT Analysis
- 11.2.13.4. Recent Developments
- 11.2.13.5. Financials (Based on Availability)
- 11.2.14 Pacific Vials
- 11.2.14.1. Overview
- 11.2.14.2. Products
- 11.2.14.3. SWOT Analysis
- 11.2.14.4. Recent Developments
- 11.2.14.5. Financials (Based on Availability)
- 11.2.15 TricorBraun
- 11.2.15.1. Overview
- 11.2.15.2. Products
- 11.2.15.3. SWOT Analysis
- 11.2.15.4. Recent Developments
- 11.2.15.5. Financials (Based on Availability)
- 11.2.16 Wheaton Industries
- 11.2.16.1. Overview
- 11.2.16.2. Products
- 11.2.16.3. SWOT Analysis
- 11.2.16.4. Recent Developments
- 11.2.16.5. Financials (Based on Availability)
- 11.2.1 Gerresheimer
List of Figures
- Figure 1: Global Vials Packaging Revenue Breakdown (billion, %) by Region 2025 & 2033
- Figure 2: North America Vials Packaging Revenue (billion), by Application 2025 & 2033
- Figure 3: North America Vials Packaging Revenue Share (%), by Application 2025 & 2033
- Figure 4: North America Vials Packaging Revenue (billion), by Type 2025 & 2033
- Figure 5: North America Vials Packaging Revenue Share (%), by Type 2025 & 2033
- Figure 6: North America Vials Packaging Revenue (billion), by Country 2025 & 2033
- Figure 7: North America Vials Packaging Revenue Share (%), by Country 2025 & 2033
- Figure 8: South America Vials Packaging Revenue (billion), by Application 2025 & 2033
- Figure 9: South America Vials Packaging Revenue Share (%), by Application 2025 & 2033
- Figure 10: South America Vials Packaging Revenue (billion), by Type 2025 & 2033
- Figure 11: South America Vials Packaging Revenue Share (%), by Type 2025 & 2033
- Figure 12: South America Vials Packaging Revenue (billion), by Country 2025 & 2033
- Figure 13: South America Vials Packaging Revenue Share (%), by Country 2025 & 2033
- Figure 14: Europe Vials Packaging Revenue (billion), by Application 2025 & 2033
- Figure 15: Europe Vials Packaging Revenue Share (%), by Application 2025 & 2033
- Figure 16: Europe Vials Packaging Revenue (billion), by Type 2025 & 2033
- Figure 17: Europe Vials Packaging Revenue Share (%), by Type 2025 & 2033
- Figure 18: Europe Vials Packaging Revenue (billion), by Country 2025 & 2033
- Figure 19: Europe Vials Packaging Revenue Share (%), by Country 2025 & 2033
- Figure 20: Middle East & Africa Vials Packaging Revenue (billion), by Application 2025 & 2033
- Figure 21: Middle East & Africa Vials Packaging Revenue Share (%), by Application 2025 & 2033
- Figure 22: Middle East & Africa Vials Packaging Revenue (billion), by Type 2025 & 2033
- Figure 23: Middle East & Africa Vials Packaging Revenue Share (%), by Type 2025 & 2033
- Figure 24: Middle East & Africa Vials Packaging Revenue (billion), by Country 2025 & 2033
- Figure 25: Middle East & Africa Vials Packaging Revenue Share (%), by Country 2025 & 2033
- Figure 26: Asia Pacific Vials Packaging Revenue (billion), by Application 2025 & 2033
- Figure 27: Asia Pacific Vials Packaging Revenue Share (%), by Application 2025 & 2033
- Figure 28: Asia Pacific Vials Packaging Revenue (billion), by Type 2025 & 2033
- Figure 29: Asia Pacific Vials Packaging Revenue Share (%), by Type 2025 & 2033
- Figure 30: Asia Pacific Vials Packaging Revenue (billion), by Country 2025 & 2033
- Figure 31: Asia Pacific Vials Packaging Revenue Share (%), by Country 2025 & 2033
List of Tables
- Table 1: Global Vials Packaging Revenue billion Forecast, by Application 2020 & 2033
- Table 2: Global Vials Packaging Revenue billion Forecast, by Type 2020 & 2033
- Table 3: Global Vials Packaging Revenue billion Forecast, by Region 2020 & 2033
- Table 4: Global Vials Packaging Revenue billion Forecast, by Application 2020 & 2033
- Table 5: Global Vials Packaging Revenue billion Forecast, by Type 2020 & 2033
- Table 6: Global Vials Packaging Revenue billion Forecast, by Country 2020 & 2033
- Table 7: United States Vials Packaging Revenue (billion) Forecast, by Application 2020 & 2033
- Table 8: Canada Vials Packaging Revenue (billion) Forecast, by Application 2020 & 2033
- Table 9: Mexico Vials Packaging Revenue (billion) Forecast, by Application 2020 & 2033
- Table 10: Global Vials Packaging Revenue billion Forecast, by Application 2020 & 2033
- Table 11: Global Vials Packaging Revenue billion Forecast, by Type 2020 & 2033
- Table 12: Global Vials Packaging Revenue billion Forecast, by Country 2020 & 2033
- Table 13: Brazil Vials Packaging Revenue (billion) Forecast, by Application 2020 & 2033
- Table 14: Argentina Vials Packaging Revenue (billion) Forecast, by Application 2020 & 2033
- Table 15: Rest of South America Vials Packaging Revenue (billion) Forecast, by Application 2020 & 2033
- Table 16: Global Vials Packaging Revenue billion Forecast, by Application 2020 & 2033
- Table 17: Global Vials Packaging Revenue billion Forecast, by Type 2020 & 2033
- Table 18: Global Vials Packaging Revenue billion Forecast, by Country 2020 & 2033
- Table 19: United Kingdom Vials Packaging Revenue (billion) Forecast, by Application 2020 & 2033
- Table 20: Germany Vials Packaging Revenue (billion) Forecast, by Application 2020 & 2033
- Table 21: France Vials Packaging Revenue (billion) Forecast, by Application 2020 & 2033
- Table 22: Italy Vials Packaging Revenue (billion) Forecast, by Application 2020 & 2033
- Table 23: Spain Vials Packaging Revenue (billion) Forecast, by Application 2020 & 2033
- Table 24: Russia Vials Packaging Revenue (billion) Forecast, by Application 2020 & 2033
- Table 25: Benelux Vials Packaging Revenue (billion) Forecast, by Application 2020 & 2033
- Table 26: Nordics Vials Packaging Revenue (billion) Forecast, by Application 2020 & 2033
- Table 27: Rest of Europe Vials Packaging Revenue (billion) Forecast, by Application 2020 & 2033
- Table 28: Global Vials Packaging Revenue billion Forecast, by Application 2020 & 2033
- Table 29: Global Vials Packaging Revenue billion Forecast, by Type 2020 & 2033
- Table 30: Global Vials Packaging Revenue billion Forecast, by Country 2020 & 2033
- Table 31: Turkey Vials Packaging Revenue (billion) Forecast, by Application 2020 & 2033
- Table 32: Israel Vials Packaging Revenue (billion) Forecast, by Application 2020 & 2033
- Table 33: GCC Vials Packaging Revenue (billion) Forecast, by Application 2020 & 2033
- Table 34: North Africa Vials Packaging Revenue (billion) Forecast, by Application 2020 & 2033
- Table 35: South Africa Vials Packaging Revenue (billion) Forecast, by Application 2020 & 2033
- Table 36: Rest of Middle East & Africa Vials Packaging Revenue (billion) Forecast, by Application 2020 & 2033
- Table 37: Global Vials Packaging Revenue billion Forecast, by Application 2020 & 2033
- Table 38: Global Vials Packaging Revenue billion Forecast, by Type 2020 & 2033
- Table 39: Global Vials Packaging Revenue billion Forecast, by Country 2020 & 2033
- Table 40: China Vials Packaging Revenue (billion) Forecast, by Application 2020 & 2033
- Table 41: India Vials Packaging Revenue (billion) Forecast, by Application 2020 & 2033
- Table 42: Japan Vials Packaging Revenue (billion) Forecast, by Application 2020 & 2033
- Table 43: South Korea Vials Packaging Revenue (billion) Forecast, by Application 2020 & 2033
- Table 44: ASEAN Vials Packaging Revenue (billion) Forecast, by Application 2020 & 2033
- Table 45: Oceania Vials Packaging Revenue (billion) Forecast, by Application 2020 & 2033
- Table 46: Rest of Asia Pacific Vials Packaging Revenue (billion) Forecast, by Application 2020 & 2033
Frequently Asked Questions
1. What is the projected Compound Annual Growth Rate (CAGR) of the Vials Packaging?
The projected CAGR is approximately 8.8%.
2. Which companies are prominent players in the Vials Packaging?
Key companies in the market include Gerresheimer, Schott, Corning, O.Berk, Thermo Fisher, Acme Vials and Glass Company, Akey Group, Amposan, BMT Corporation, Friedrich & Dimmock, Hindusthan National Glass & Industries, Jinarth pharma packaging, Kishore Group, Pacific Vials, TricorBraun, Wheaton Industries.
3. What are the main segments of the Vials Packaging?
The market segments include Application, Type.
4. Can you provide details about the market size?
The market size is estimated to be USD 23.23 billion as of 2022.
5. What are some drivers contributing to market growth?
N/A
6. What are the notable trends driving market growth?
N/A
7. Are there any restraints impacting market growth?
N/A
8. Can you provide examples of recent developments in the market?
N/A
9. What pricing options are available for accessing the report?
Pricing options include single-user, multi-user, and enterprise licenses priced at USD 2900.00, USD 4350.00, and USD 5800.00 respectively.
10. Is the market size provided in terms of value or volume?
The market size is provided in terms of value, measured in billion.
11. Are there any specific market keywords associated with the report?
Yes, the market keyword associated with the report is "Vials Packaging," which aids in identifying and referencing the specific market segment covered.
12. How do I determine which pricing option suits my needs best?
The pricing options vary based on user requirements and access needs. Individual users may opt for single-user licenses, while businesses requiring broader access may choose multi-user or enterprise licenses for cost-effective access to the report.
13. Are there any additional resources or data provided in the Vials Packaging report?
While the report offers comprehensive insights, it's advisable to review the specific contents or supplementary materials provided to ascertain if additional resources or data are available.
14. How can I stay updated on further developments or reports in the Vials Packaging?
To stay informed about further developments, trends, and reports in the Vials Packaging, consider subscribing to industry newsletters, following relevant companies and organizations, or regularly checking reputable industry news sources and publications.
Methodology
Step 1 - Identification of Relevant Samples Size from Population Database


Step 2 - Approaches for Defining Global Market Size (Value, Volume* & Price*)

Note*: In applicable scenarios
Step 3 - Data Sources
Primary Research
- Web Analytics
- Survey Reports
- Research Institute
- Latest Research Reports
- Opinion Leaders
Secondary Research
- Annual Reports
- White Paper
- Latest Press Release
- Industry Association
- Paid Database
- Investor Presentations

Step 4 - Data Triangulation
Involves using different sources of information in order to increase the validity of a study
These sources are likely to be stakeholders in a program - participants, other researchers, program staff, other community members, and so on.
Then we put all data in single framework & apply various statistical tools to find out the dynamic on the market.
During the analysis stage, feedback from the stakeholder groups would be compared to determine areas of agreement as well as areas of divergence