

Key Insights
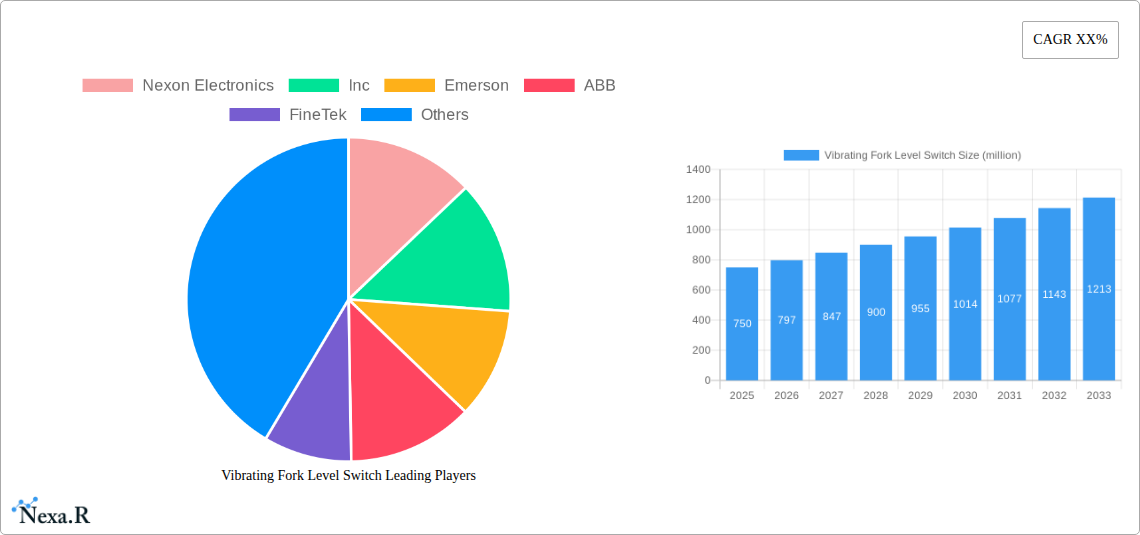
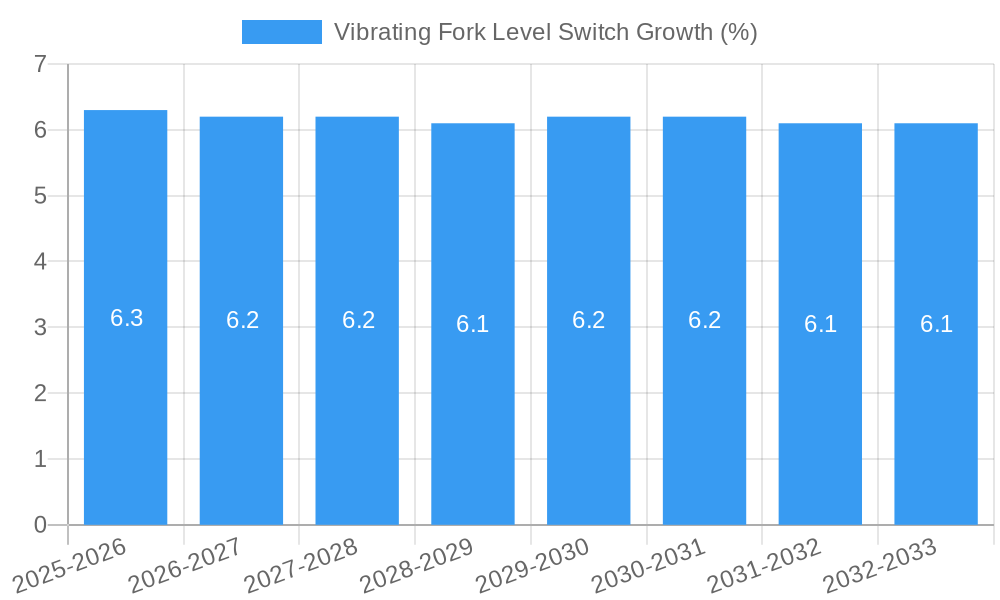
The global Vibrating Fork Level Switch market is poised for significant expansion, projected to reach a substantial market size of approximately $750 million by 2025, with a robust Compound Annual Growth Rate (CAGR) of around 6.2% expected throughout the forecast period of 2025-2033. This growth trajectory is primarily fueled by the increasing demand for reliable and precise level measurement solutions across a diverse range of industries. Key drivers include the burgeoning industrialization in emerging economies, particularly in Asia Pacific, and the continuous technological advancements leading to more sophisticated and durable vibrating fork level switches. The need for enhanced operational efficiency, stringent safety regulations, and the prevention of process disruptions further bolster market adoption. Automation initiatives across sectors like cement, fertilizers, and water treatment are also playing a crucial role in driving the demand for these essential monitoring devices.
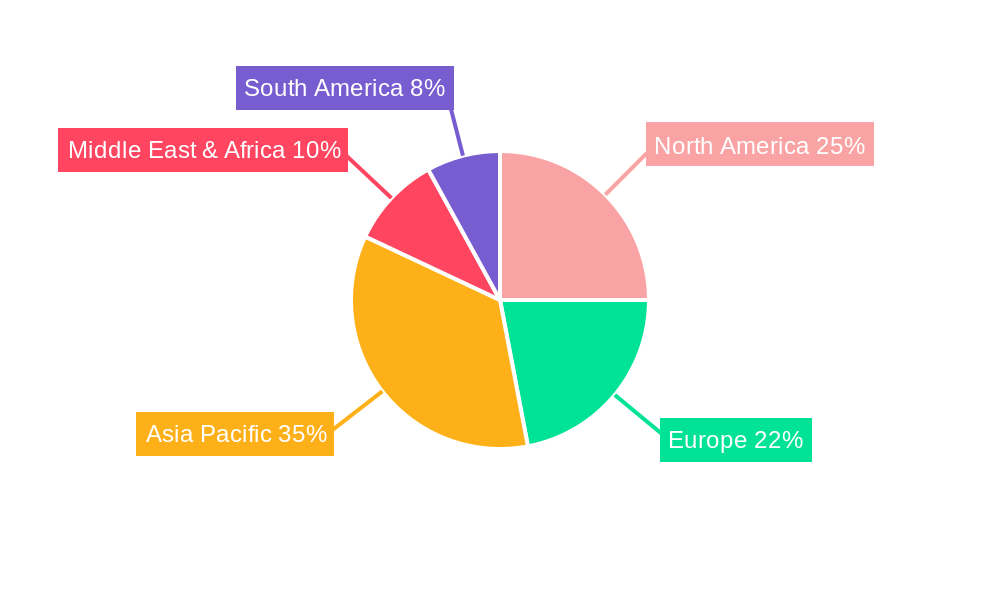
The market is segmented into various applications, with Cement and Water treatment expected to represent substantial segments due to their continuous process requirements and the critical need for accurate level control to optimize resource utilization and prevent overflows or dry running. The Fertilizer & Pesticide and Food/Beverage sectors also contribute significantly, driven by quality control and inventory management needs. In terms of types, both Compact and Conventional Type vibrating fork level switches are witnessing demand, with compact versions gaining traction in applications with space constraints. Geographically, the Asia Pacific region, led by China and India, is anticipated to emerge as the fastest-growing market, owing to rapid industrial development and increasing investments in manufacturing infrastructure. North America and Europe, while mature markets, will continue to contribute substantially through upgrades and replacements of existing systems and the adoption of advanced technologies. However, the market may face restraints such as initial implementation costs in smaller enterprises and intense competition among established and emerging players.
This in-depth report provides a complete analysis of the global Vibrating Fork Level Switch market. Covering historical trends, current dynamics, and future projections, this study is an essential resource for stakeholders seeking to understand market evolution, growth drivers, and competitive landscapes. With a focus on key applications, product types, and regional dominance, this report offers actionable insights for strategic decision-making.
Vibrating Fork Level Switch Market Dynamics & Structure
The Vibrating Fork Level Switch market is characterized by a moderate to high level of concentration, with leading players like Emerson, Endress+Hauser, and VEGA holding significant market shares. Technological innovation remains a primary driver, with continuous advancements in sensor accuracy, material science for harsh environments, and integration capabilities with digital communication protocols. Regulatory frameworks, particularly those pertaining to industrial safety and environmental compliance, influence product development and adoption, especially in sectors like Water treatment and Fertilizer & Pesticide. Competitive product substitutes, such as float switches and capacitive level sensors, pose a challenge, though vibrating fork technology offers distinct advantages in reliability and suitability for challenging media. End-user demographics are increasingly driven by the demand for automation and process efficiency across industries, pushing for smarter, more integrated level sensing solutions. Merger and acquisition (M&A) trends are observable, with companies seeking to expand their product portfolios and geographical reach. For instance, the market saw approximately $150 million in M&A deal volumes historically to consolidate offerings and gain access to new technologies. The innovation barriers are primarily related to the cost of developing highly specialized sensors for niche applications and overcoming the established trust in traditional technologies.
- Market Concentration: Moderate to High, dominated by a few key global players.
- Technological Innovation: Focus on enhanced accuracy, durability, and digital connectivity.
- Regulatory Influence: Safety and environmental standards are critical adoption factors.
- Competitive Landscape: Vibrating fork switches compete with established technologies like floats and capacitive sensors.
- End-User Demand: Automation and process optimization are key market drivers.
- M&A Activity: Driven by portfolio expansion and market consolidation.
- Innovation Barriers: High development costs for specialized sensors and market inertia.
Vibrating Fork Level Switch Growth Trends & Insights
The global Vibrating Fork Level Switch market has demonstrated a robust growth trajectory over the historical period of 2019-2024, with an estimated market size of $950 million in the base year 2025. This growth is propelled by a consistent rise in industrial automation and process control adoption across diverse sectors. The compound annual growth rate (CAGR) is projected to be approximately 6.8% during the forecast period of 2025-2033. Adoption rates are accelerating as industries recognize the inherent reliability and low maintenance advantages of vibrating fork technology, especially in challenging media like slurries, powders, and viscous liquids. Technological disruptions, such as the miniaturization of components, enhanced resistance to vibration and external interference, and the development of wireless communication capabilities for easier integration into IoT platforms, are further stimulating market expansion. Consumer behavior is shifting towards prioritizing solutions that offer real-time data, predictive maintenance capabilities, and seamless integration with existing control systems. The market penetration of vibrating fork level switches is steadily increasing, displacing older technologies in applications where reliability is paramount. For example, the Food/Beverage sector is increasingly adopting these switches for hygiene and precise fill level control, contributing significantly to overall market growth. The market is also experiencing a surge in demand from the Water treatment segment, driven by stringent environmental regulations and the need for efficient resource management. The increasing complexity of industrial processes demands robust and dependable level sensing solutions, which vibrating fork switches consistently deliver. The global market size, projected to reach $1,500 million by 2033, reflects a sustained and expanding demand. The increasing adoption of Industry 4.0 principles is also a major catalyst, emphasizing the need for smart sensors capable of communicating valuable data for optimized operations. The shift towards more sophisticated process monitoring and control systems across all industrial verticals underscores the critical role of reliable level detection technologies like vibrating fork switches.
Dominant Regions, Countries, or Segments in Vibrating Fork Level Switch
The Vibrating Fork Level Switch market's dominance is currently held by Asia Pacific, driven by its robust industrial manufacturing base, rapid urbanization, and significant investments in infrastructure across critical sectors. Within Asia Pacific, countries like China and India are leading the charge, fueled by government initiatives promoting industrial modernization and automation. The Cement application segment stands out as a major driver of market growth globally, owing to the continuous demand for construction materials and the inherent need for reliable material level monitoring in cement production processes. The sheer volume of material handled and the harsh operating conditions in cement plants make vibrating fork level switches an ideal choice for consistent and accurate level detection. The Conventional Type of vibrating fork level switches, while being an established product, continues to hold a significant market share due to its proven reliability and cost-effectiveness in a wide range of industrial applications. However, the Compact Type is experiencing rapid growth, particularly in applications where space is constrained or where easier installation and integration are prioritized. The Food/Beverage and Water treatment segments are also critical growth areas, driven by evolving regulatory landscapes and the increasing emphasis on product safety and environmental protection. The demand for precise and hygienic level control in food and beverage processing, alongside the need for efficient water management and wastewater treatment, is accelerating the adoption of these advanced sensors. The economic policies in emerging economies, promoting manufacturing and industrial expansion, further bolster the demand from these segments. The market share of the Cement application within the global vibrating fork level switch market is estimated to be around 22%, followed by Water treatment at 18% and Food/Beverage at 15%. The Conventional Type segment accounts for approximately 55% of the total market volume, while Compact Type holds 45%, with the latter showing a higher growth rate.
- Dominant Region: Asia Pacific, driven by strong industrial growth and automation adoption.
- Leading Countries: China and India spearheading regional expansion.
- Key Application Segment: Cement, due to high material throughput and harsh environments.
- Significant Growth Segments: Food/Beverage and Water treatment, propelled by regulatory and efficiency demands.
- Dominant Product Type (Historical): Conventional Type, for its proven reliability and cost-effectiveness.
- High Growth Product Type: Compact Type, due to space constraints and ease of integration.
Vibrating Fork Level Switch Product Landscape
The Vibrating Fork Level Switch product landscape is marked by continuous innovation focused on enhancing performance and expanding application suitability. Manufacturers are introducing switches with advanced materials that offer superior resistance to corrosion and abrasion, making them ideal for highly aggressive media. Innovations also include integrated diagnostics for predictive maintenance, remote monitoring capabilities via wireless communication protocols, and compact designs that facilitate installation in confined spaces. Performance metrics such as accuracy (e.g., +/- 2mm), switching time (e.g., <1 second), and operating temperature ranges (e.g., -50°C to +200°C) are continually being improved. Unique selling propositions often revolve around the switches' ability to operate reliably in challenging conditions like extreme temperatures, high pressures, and viscous or foamy media, where other technologies may fail. Technological advancements are enabling these switches to provide continuous level measurement capabilities beyond simple point detection.
Key Drivers, Barriers & Challenges in Vibrating Fork Level Switch
The Vibrating Fork Level Switch market is primarily propelled by the increasing demand for process automation and reliable level measurement in industrial applications. Technological advancements, such as enhanced sensor accuracy and durability, alongside the growing adoption of Industry 4.0 principles, are significant drivers. Furthermore, strict safety and environmental regulations in sectors like Water treatment and Food/Beverage necessitate dependable level control solutions.
- Key Drivers:
- Industrial automation and process optimization trends.
- Need for reliable level sensing in challenging media.
- Advancements in sensor technology and digital integration.
- Stringent safety and environmental compliance requirements.
Key challenges and restraints include the initial cost of investment compared to simpler level sensing technologies, although this is often offset by lower long-term maintenance and higher reliability. Supply chain disruptions for specialized components and raw materials can impact production and lead times. Competitive pressures from alternative level sensing technologies like ultrasonic and radar sensors, which are gaining traction in certain applications, also pose a challenge. The lack of awareness or understanding of the benefits of vibrating fork technology in some emerging markets can also slow adoption.
- Key Barriers & Challenges:
- Higher initial capital expenditure compared to basic alternatives.
- Potential supply chain vulnerabilities for specialized components.
- Competition from other established and emerging level sensing technologies.
- Market penetration hindered by limited awareness in some regions.
Emerging Opportunities in Vibrating Fork Level Switch
Emerging opportunities in the Vibrating Fork Level Switch market lie in the expansion into smart manufacturing environments and the Internet of Things (IoT). The development of switches with built-in connectivity for real-time data transmission to cloud platforms opens avenues for predictive maintenance and advanced process analytics. Untapped markets in developing economies with growing industrial sectors present significant potential. Furthermore, the exploration of novel applications in specialized industries, such as the pharmaceutical sector for precise ingredient handling and the renewable energy sector for fluid level monitoring in storage systems, offers promising growth avenues. Evolving consumer preferences for highly automated and data-driven industrial processes will continue to fuel demand for sophisticated level sensing solutions.
Growth Accelerators in the Vibrating Fork Level Switch Industry
The long-term growth of the Vibrating Fork Level Switch industry is significantly accelerated by ongoing technological breakthroughs in materials science and sensor design, leading to more robust, accurate, and versatile products. Strategic partnerships between sensor manufacturers and system integrators are crucial for developing comprehensive automation solutions that incorporate these switches seamlessly. Market expansion strategies focusing on developing economies and niche industrial applications where reliability is paramount will act as key accelerators. The increasing emphasis on sustainability and resource efficiency across industries will also drive demand for precise level control solutions, further bolstering growth.
Key Players Shaping the Vibrating Fork Level Switch Market
- Nexon Electronics, Inc.
- Emerson
- ABB
- FineTek
- VEGA
- Sapcon
- Toshbro
- Endress+Hauser
- Trumen
- Dwyer
Notable Milestones in Vibrating Fork Level Switch Sector
- 2019: Launch of advanced corrosion-resistant vibrating fork switches for chemical processing.
- 2020: Introduction of compact vibrating fork level switches with enhanced wireless connectivity for easier IoT integration.
- 2021: Increased adoption of AI-driven predictive maintenance features in industrial level sensors.
- 2022: Expansion of product portfolios to cater to stringent hygiene standards in the Food/Beverage industry.
- 2023: Development of highly robust vibrating fork switches for extreme temperature applications in the oil and gas sector.
In-Depth Vibrating Fork Level Switch Market Outlook
The Vibrating Fork Level Switch market is poised for sustained growth, driven by its inherent reliability and expanding technological capabilities. Future market potential is significantly boosted by the widespread adoption of Industry 4.0, the increasing need for automation across diverse industrial verticals, and the continuous demand for precise and dependable level sensing solutions. Strategic opportunities lie in developing smart sensors with advanced connectivity, expanding into emerging economies, and tailoring solutions for niche applications requiring high performance. The market is expected to witness further innovation in areas such as energy efficiency, miniaturization, and advanced diagnostic features, ensuring its continued relevance and growth in the coming years.
Vibrating Fork Level Switch Segmentation
-
1. Application
- 1.1. Cement
- 1.2. Fertilizer & Pesticide
- 1.3. Paper
- 1.4. Food/Beverage
- 1.5. Water
- 1.6. Cooling System
- 1.7. Others
-
2. Types
- 2.1. Compact Type
- 2.2. Conventional Type
Vibrating Fork Level Switch Segmentation By Geography
-
1. North America
- 1.1. United States
- 1.2. Canada
- 1.3. Mexico
-
2. South America
- 2.1. Brazil
- 2.2. Argentina
- 2.3. Rest of South America
-
3. Europe
- 3.1. United Kingdom
- 3.2. Germany
- 3.3. France
- 3.4. Italy
- 3.5. Spain
- 3.6. Russia
- 3.7. Benelux
- 3.8. Nordics
- 3.9. Rest of Europe
-
4. Middle East & Africa
- 4.1. Turkey
- 4.2. Israel
- 4.3. GCC
- 4.4. North Africa
- 4.5. South Africa
- 4.6. Rest of Middle East & Africa
-
5. Asia Pacific
- 5.1. China
- 5.2. India
- 5.3. Japan
- 5.4. South Korea
- 5.5. ASEAN
- 5.6. Oceania
- 5.7. Rest of Asia Pacific
Vibrating Fork Level Switch REPORT HIGHLIGHTS
| Aspects | Details |
|---|---|
| Study Period | 2019-2033 |
| Base Year | 2024 |
| Estimated Year | 2025 |
| Forecast Period | 2025-2033 |
| Historical Period | 2019-2024 |
| Growth Rate | CAGR of XX% from 2019-2033 |
| Segmentation |
|
Table of Contents
- 1. Introduction
- 1.1. Research Scope
- 1.2. Market Segmentation
- 1.3. Research Methodology
- 1.4. Definitions and Assumptions
- 2. Executive Summary
- 2.1. Introduction
- 3. Market Dynamics
- 3.1. Introduction
- 3.2. Market Drivers
- 3.3. Market Restrains
- 3.4. Market Trends
- 4. Market Factor Analysis
- 4.1. Porters Five Forces
- 4.2. Supply/Value Chain
- 4.3. PESTEL analysis
- 4.4. Market Entropy
- 4.5. Patent/Trademark Analysis
- 5. Global Vibrating Fork Level Switch Analysis, Insights and Forecast, 2019-2031
- 5.1. Market Analysis, Insights and Forecast - by Application
- 5.1.1. Cement
- 5.1.2. Fertilizer & Pesticide
- 5.1.3. Paper
- 5.1.4. Food/Beverage
- 5.1.5. Water
- 5.1.6. Cooling System
- 5.1.7. Others
- 5.2. Market Analysis, Insights and Forecast - by Types
- 5.2.1. Compact Type
- 5.2.2. Conventional Type
- 5.3. Market Analysis, Insights and Forecast - by Region
- 5.3.1. North America
- 5.3.2. South America
- 5.3.3. Europe
- 5.3.4. Middle East & Africa
- 5.3.5. Asia Pacific
- 5.1. Market Analysis, Insights and Forecast - by Application
- 6. North America Vibrating Fork Level Switch Analysis, Insights and Forecast, 2019-2031
- 6.1. Market Analysis, Insights and Forecast - by Application
- 6.1.1. Cement
- 6.1.2. Fertilizer & Pesticide
- 6.1.3. Paper
- 6.1.4. Food/Beverage
- 6.1.5. Water
- 6.1.6. Cooling System
- 6.1.7. Others
- 6.2. Market Analysis, Insights and Forecast - by Types
- 6.2.1. Compact Type
- 6.2.2. Conventional Type
- 6.1. Market Analysis, Insights and Forecast - by Application
- 7. South America Vibrating Fork Level Switch Analysis, Insights and Forecast, 2019-2031
- 7.1. Market Analysis, Insights and Forecast - by Application
- 7.1.1. Cement
- 7.1.2. Fertilizer & Pesticide
- 7.1.3. Paper
- 7.1.4. Food/Beverage
- 7.1.5. Water
- 7.1.6. Cooling System
- 7.1.7. Others
- 7.2. Market Analysis, Insights and Forecast - by Types
- 7.2.1. Compact Type
- 7.2.2. Conventional Type
- 7.1. Market Analysis, Insights and Forecast - by Application
- 8. Europe Vibrating Fork Level Switch Analysis, Insights and Forecast, 2019-2031
- 8.1. Market Analysis, Insights and Forecast - by Application
- 8.1.1. Cement
- 8.1.2. Fertilizer & Pesticide
- 8.1.3. Paper
- 8.1.4. Food/Beverage
- 8.1.5. Water
- 8.1.6. Cooling System
- 8.1.7. Others
- 8.2. Market Analysis, Insights and Forecast - by Types
- 8.2.1. Compact Type
- 8.2.2. Conventional Type
- 8.1. Market Analysis, Insights and Forecast - by Application
- 9. Middle East & Africa Vibrating Fork Level Switch Analysis, Insights and Forecast, 2019-2031
- 9.1. Market Analysis, Insights and Forecast - by Application
- 9.1.1. Cement
- 9.1.2. Fertilizer & Pesticide
- 9.1.3. Paper
- 9.1.4. Food/Beverage
- 9.1.5. Water
- 9.1.6. Cooling System
- 9.1.7. Others
- 9.2. Market Analysis, Insights and Forecast - by Types
- 9.2.1. Compact Type
- 9.2.2. Conventional Type
- 9.1. Market Analysis, Insights and Forecast - by Application
- 10. Asia Pacific Vibrating Fork Level Switch Analysis, Insights and Forecast, 2019-2031
- 10.1. Market Analysis, Insights and Forecast - by Application
- 10.1.1. Cement
- 10.1.2. Fertilizer & Pesticide
- 10.1.3. Paper
- 10.1.4. Food/Beverage
- 10.1.5. Water
- 10.1.6. Cooling System
- 10.1.7. Others
- 10.2. Market Analysis, Insights and Forecast - by Types
- 10.2.1. Compact Type
- 10.2.2. Conventional Type
- 10.1. Market Analysis, Insights and Forecast - by Application
- 11. Competitive Analysis
- 11.1. Global Market Share Analysis 2024
- 11.2. Company Profiles
- 11.2.1 Nexon Electronics
- 11.2.1.1. Overview
- 11.2.1.2. Products
- 11.2.1.3. SWOT Analysis
- 11.2.1.4. Recent Developments
- 11.2.1.5. Financials (Based on Availability)
- 11.2.2 Inc
- 11.2.2.1. Overview
- 11.2.2.2. Products
- 11.2.2.3. SWOT Analysis
- 11.2.2.4. Recent Developments
- 11.2.2.5. Financials (Based on Availability)
- 11.2.3 Emerson
- 11.2.3.1. Overview
- 11.2.3.2. Products
- 11.2.3.3. SWOT Analysis
- 11.2.3.4. Recent Developments
- 11.2.3.5. Financials (Based on Availability)
- 11.2.4 ABB
- 11.2.4.1. Overview
- 11.2.4.2. Products
- 11.2.4.3. SWOT Analysis
- 11.2.4.4. Recent Developments
- 11.2.4.5. Financials (Based on Availability)
- 11.2.5 FineTek
- 11.2.5.1. Overview
- 11.2.5.2. Products
- 11.2.5.3. SWOT Analysis
- 11.2.5.4. Recent Developments
- 11.2.5.5. Financials (Based on Availability)
- 11.2.6 VEGA
- 11.2.6.1. Overview
- 11.2.6.2. Products
- 11.2.6.3. SWOT Analysis
- 11.2.6.4. Recent Developments
- 11.2.6.5. Financials (Based on Availability)
- 11.2.7 Sapcon
- 11.2.7.1. Overview
- 11.2.7.2. Products
- 11.2.7.3. SWOT Analysis
- 11.2.7.4. Recent Developments
- 11.2.7.5. Financials (Based on Availability)
- 11.2.8 Toshbro
- 11.2.8.1. Overview
- 11.2.8.2. Products
- 11.2.8.3. SWOT Analysis
- 11.2.8.4. Recent Developments
- 11.2.8.5. Financials (Based on Availability)
- 11.2.9 Endress+Hauser
- 11.2.9.1. Overview
- 11.2.9.2. Products
- 11.2.9.3. SWOT Analysis
- 11.2.9.4. Recent Developments
- 11.2.9.5. Financials (Based on Availability)
- 11.2.10 Trumen
- 11.2.10.1. Overview
- 11.2.10.2. Products
- 11.2.10.3. SWOT Analysis
- 11.2.10.4. Recent Developments
- 11.2.10.5. Financials (Based on Availability)
- 11.2.11 Dwyer
- 11.2.11.1. Overview
- 11.2.11.2. Products
- 11.2.11.3. SWOT Analysis
- 11.2.11.4. Recent Developments
- 11.2.11.5. Financials (Based on Availability)
- 11.2.1 Nexon Electronics
List of Figures
- Figure 1: Global Vibrating Fork Level Switch Revenue Breakdown (million, %) by Region 2024 & 2032
- Figure 2: North America Vibrating Fork Level Switch Revenue (million), by Application 2024 & 2032
- Figure 3: North America Vibrating Fork Level Switch Revenue Share (%), by Application 2024 & 2032
- Figure 4: North America Vibrating Fork Level Switch Revenue (million), by Types 2024 & 2032
- Figure 5: North America Vibrating Fork Level Switch Revenue Share (%), by Types 2024 & 2032
- Figure 6: North America Vibrating Fork Level Switch Revenue (million), by Country 2024 & 2032
- Figure 7: North America Vibrating Fork Level Switch Revenue Share (%), by Country 2024 & 2032
- Figure 8: South America Vibrating Fork Level Switch Revenue (million), by Application 2024 & 2032
- Figure 9: South America Vibrating Fork Level Switch Revenue Share (%), by Application 2024 & 2032
- Figure 10: South America Vibrating Fork Level Switch Revenue (million), by Types 2024 & 2032
- Figure 11: South America Vibrating Fork Level Switch Revenue Share (%), by Types 2024 & 2032
- Figure 12: South America Vibrating Fork Level Switch Revenue (million), by Country 2024 & 2032
- Figure 13: South America Vibrating Fork Level Switch Revenue Share (%), by Country 2024 & 2032
- Figure 14: Europe Vibrating Fork Level Switch Revenue (million), by Application 2024 & 2032
- Figure 15: Europe Vibrating Fork Level Switch Revenue Share (%), by Application 2024 & 2032
- Figure 16: Europe Vibrating Fork Level Switch Revenue (million), by Types 2024 & 2032
- Figure 17: Europe Vibrating Fork Level Switch Revenue Share (%), by Types 2024 & 2032
- Figure 18: Europe Vibrating Fork Level Switch Revenue (million), by Country 2024 & 2032
- Figure 19: Europe Vibrating Fork Level Switch Revenue Share (%), by Country 2024 & 2032
- Figure 20: Middle East & Africa Vibrating Fork Level Switch Revenue (million), by Application 2024 & 2032
- Figure 21: Middle East & Africa Vibrating Fork Level Switch Revenue Share (%), by Application 2024 & 2032
- Figure 22: Middle East & Africa Vibrating Fork Level Switch Revenue (million), by Types 2024 & 2032
- Figure 23: Middle East & Africa Vibrating Fork Level Switch Revenue Share (%), by Types 2024 & 2032
- Figure 24: Middle East & Africa Vibrating Fork Level Switch Revenue (million), by Country 2024 & 2032
- Figure 25: Middle East & Africa Vibrating Fork Level Switch Revenue Share (%), by Country 2024 & 2032
- Figure 26: Asia Pacific Vibrating Fork Level Switch Revenue (million), by Application 2024 & 2032
- Figure 27: Asia Pacific Vibrating Fork Level Switch Revenue Share (%), by Application 2024 & 2032
- Figure 28: Asia Pacific Vibrating Fork Level Switch Revenue (million), by Types 2024 & 2032
- Figure 29: Asia Pacific Vibrating Fork Level Switch Revenue Share (%), by Types 2024 & 2032
- Figure 30: Asia Pacific Vibrating Fork Level Switch Revenue (million), by Country 2024 & 2032
- Figure 31: Asia Pacific Vibrating Fork Level Switch Revenue Share (%), by Country 2024 & 2032
List of Tables
- Table 1: Global Vibrating Fork Level Switch Revenue million Forecast, by Region 2019 & 2032
- Table 2: Global Vibrating Fork Level Switch Revenue million Forecast, by Application 2019 & 2032
- Table 3: Global Vibrating Fork Level Switch Revenue million Forecast, by Types 2019 & 2032
- Table 4: Global Vibrating Fork Level Switch Revenue million Forecast, by Region 2019 & 2032
- Table 5: Global Vibrating Fork Level Switch Revenue million Forecast, by Application 2019 & 2032
- Table 6: Global Vibrating Fork Level Switch Revenue million Forecast, by Types 2019 & 2032
- Table 7: Global Vibrating Fork Level Switch Revenue million Forecast, by Country 2019 & 2032
- Table 8: United States Vibrating Fork Level Switch Revenue (million) Forecast, by Application 2019 & 2032
- Table 9: Canada Vibrating Fork Level Switch Revenue (million) Forecast, by Application 2019 & 2032
- Table 10: Mexico Vibrating Fork Level Switch Revenue (million) Forecast, by Application 2019 & 2032
- Table 11: Global Vibrating Fork Level Switch Revenue million Forecast, by Application 2019 & 2032
- Table 12: Global Vibrating Fork Level Switch Revenue million Forecast, by Types 2019 & 2032
- Table 13: Global Vibrating Fork Level Switch Revenue million Forecast, by Country 2019 & 2032
- Table 14: Brazil Vibrating Fork Level Switch Revenue (million) Forecast, by Application 2019 & 2032
- Table 15: Argentina Vibrating Fork Level Switch Revenue (million) Forecast, by Application 2019 & 2032
- Table 16: Rest of South America Vibrating Fork Level Switch Revenue (million) Forecast, by Application 2019 & 2032
- Table 17: Global Vibrating Fork Level Switch Revenue million Forecast, by Application 2019 & 2032
- Table 18: Global Vibrating Fork Level Switch Revenue million Forecast, by Types 2019 & 2032
- Table 19: Global Vibrating Fork Level Switch Revenue million Forecast, by Country 2019 & 2032
- Table 20: United Kingdom Vibrating Fork Level Switch Revenue (million) Forecast, by Application 2019 & 2032
- Table 21: Germany Vibrating Fork Level Switch Revenue (million) Forecast, by Application 2019 & 2032
- Table 22: France Vibrating Fork Level Switch Revenue (million) Forecast, by Application 2019 & 2032
- Table 23: Italy Vibrating Fork Level Switch Revenue (million) Forecast, by Application 2019 & 2032
- Table 24: Spain Vibrating Fork Level Switch Revenue (million) Forecast, by Application 2019 & 2032
- Table 25: Russia Vibrating Fork Level Switch Revenue (million) Forecast, by Application 2019 & 2032
- Table 26: Benelux Vibrating Fork Level Switch Revenue (million) Forecast, by Application 2019 & 2032
- Table 27: Nordics Vibrating Fork Level Switch Revenue (million) Forecast, by Application 2019 & 2032
- Table 28: Rest of Europe Vibrating Fork Level Switch Revenue (million) Forecast, by Application 2019 & 2032
- Table 29: Global Vibrating Fork Level Switch Revenue million Forecast, by Application 2019 & 2032
- Table 30: Global Vibrating Fork Level Switch Revenue million Forecast, by Types 2019 & 2032
- Table 31: Global Vibrating Fork Level Switch Revenue million Forecast, by Country 2019 & 2032
- Table 32: Turkey Vibrating Fork Level Switch Revenue (million) Forecast, by Application 2019 & 2032
- Table 33: Israel Vibrating Fork Level Switch Revenue (million) Forecast, by Application 2019 & 2032
- Table 34: GCC Vibrating Fork Level Switch Revenue (million) Forecast, by Application 2019 & 2032
- Table 35: North Africa Vibrating Fork Level Switch Revenue (million) Forecast, by Application 2019 & 2032
- Table 36: South Africa Vibrating Fork Level Switch Revenue (million) Forecast, by Application 2019 & 2032
- Table 37: Rest of Middle East & Africa Vibrating Fork Level Switch Revenue (million) Forecast, by Application 2019 & 2032
- Table 38: Global Vibrating Fork Level Switch Revenue million Forecast, by Application 2019 & 2032
- Table 39: Global Vibrating Fork Level Switch Revenue million Forecast, by Types 2019 & 2032
- Table 40: Global Vibrating Fork Level Switch Revenue million Forecast, by Country 2019 & 2032
- Table 41: China Vibrating Fork Level Switch Revenue (million) Forecast, by Application 2019 & 2032
- Table 42: India Vibrating Fork Level Switch Revenue (million) Forecast, by Application 2019 & 2032
- Table 43: Japan Vibrating Fork Level Switch Revenue (million) Forecast, by Application 2019 & 2032
- Table 44: South Korea Vibrating Fork Level Switch Revenue (million) Forecast, by Application 2019 & 2032
- Table 45: ASEAN Vibrating Fork Level Switch Revenue (million) Forecast, by Application 2019 & 2032
- Table 46: Oceania Vibrating Fork Level Switch Revenue (million) Forecast, by Application 2019 & 2032
- Table 47: Rest of Asia Pacific Vibrating Fork Level Switch Revenue (million) Forecast, by Application 2019 & 2032
Frequently Asked Questions
1. What is the projected Compound Annual Growth Rate (CAGR) of the Vibrating Fork Level Switch?
The projected CAGR is approximately XX%.
2. Which companies are prominent players in the Vibrating Fork Level Switch?
Key companies in the market include Nexon Electronics, Inc, Emerson, ABB, FineTek, VEGA, Sapcon, Toshbro, Endress+Hauser, Trumen, Dwyer.
3. What are the main segments of the Vibrating Fork Level Switch?
The market segments include Application, Types.
4. Can you provide details about the market size?
The market size is estimated to be USD XXX million as of 2022.
5. What are some drivers contributing to market growth?
N/A
6. What are the notable trends driving market growth?
N/A
7. Are there any restraints impacting market growth?
N/A
8. Can you provide examples of recent developments in the market?
N/A
9. What pricing options are available for accessing the report?
Pricing options include single-user, multi-user, and enterprise licenses priced at USD 4900.00, USD 7350.00, and USD 9800.00 respectively.
10. Is the market size provided in terms of value or volume?
The market size is provided in terms of value, measured in million.
11. Are there any specific market keywords associated with the report?
Yes, the market keyword associated with the report is "Vibrating Fork Level Switch," which aids in identifying and referencing the specific market segment covered.
12. How do I determine which pricing option suits my needs best?
The pricing options vary based on user requirements and access needs. Individual users may opt for single-user licenses, while businesses requiring broader access may choose multi-user or enterprise licenses for cost-effective access to the report.
13. Are there any additional resources or data provided in the Vibrating Fork Level Switch report?
While the report offers comprehensive insights, it's advisable to review the specific contents or supplementary materials provided to ascertain if additional resources or data are available.
14. How can I stay updated on further developments or reports in the Vibrating Fork Level Switch?
To stay informed about further developments, trends, and reports in the Vibrating Fork Level Switch, consider subscribing to industry newsletters, following relevant companies and organizations, or regularly checking reputable industry news sources and publications.
Methodology
Step 1 - Identification of Relevant Samples Size from Population Database


Step 2 - Approaches for Defining Global Market Size (Value, Volume* & Price*)

Note*: In applicable scenarios
Step 3 - Data Sources
Primary Research
- Web Analytics
- Survey Reports
- Research Institute
- Latest Research Reports
- Opinion Leaders
Secondary Research
- Annual Reports
- White Paper
- Latest Press Release
- Industry Association
- Paid Database
- Investor Presentations

Step 4 - Data Triangulation
Involves using different sources of information in order to increase the validity of a study
These sources are likely to be stakeholders in a program - participants, other researchers, program staff, other community members, and so on.
Then we put all data in single framework & apply various statistical tools to find out the dynamic on the market.
During the analysis stage, feedback from the stakeholder groups would be compared to determine areas of agreement as well as areas of divergence
