

Key Insights
The global White Goods Packaging market is projected for significant expansion, reaching an estimated market size of 215.32 billion in 2025, with a projected Compound Annual Growth Rate (CAGR) of 4.01 through 2033. This growth is driven by increasing consumer demand for home appliances, a focus on protective and sustainable packaging, and the burgeoning e-commerce sector which necessitates durable transit packaging. Innovations in eco-friendly materials and lightweight yet robust solutions are key trends, aligning with global sustainability objectives. Rising disposable incomes in emerging economies are also fueling demand for white goods and their packaging. Stringent product safety and environmental regulations are further encouraging investment in advanced packaging technologies.
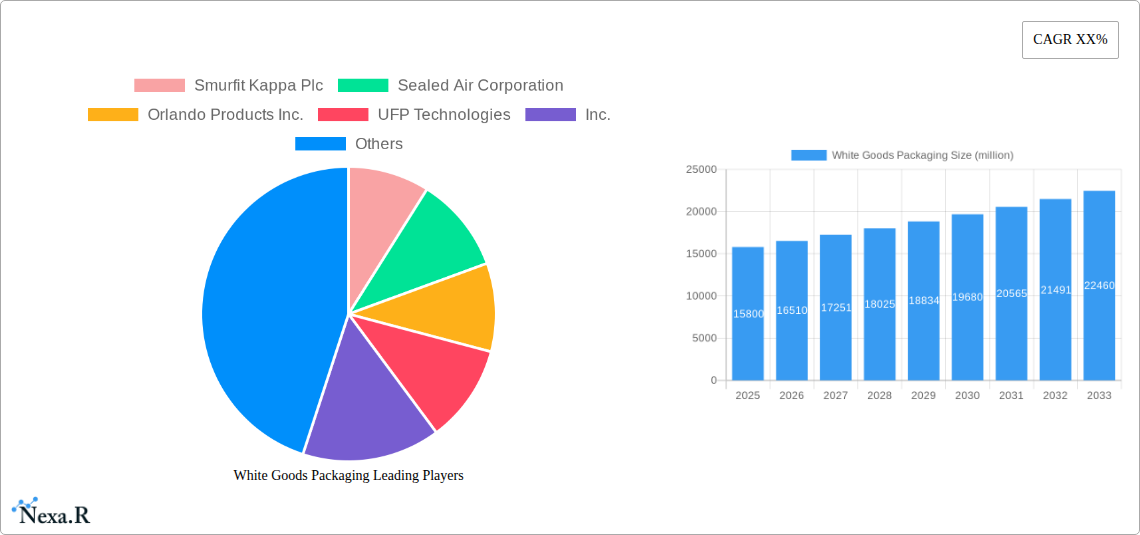
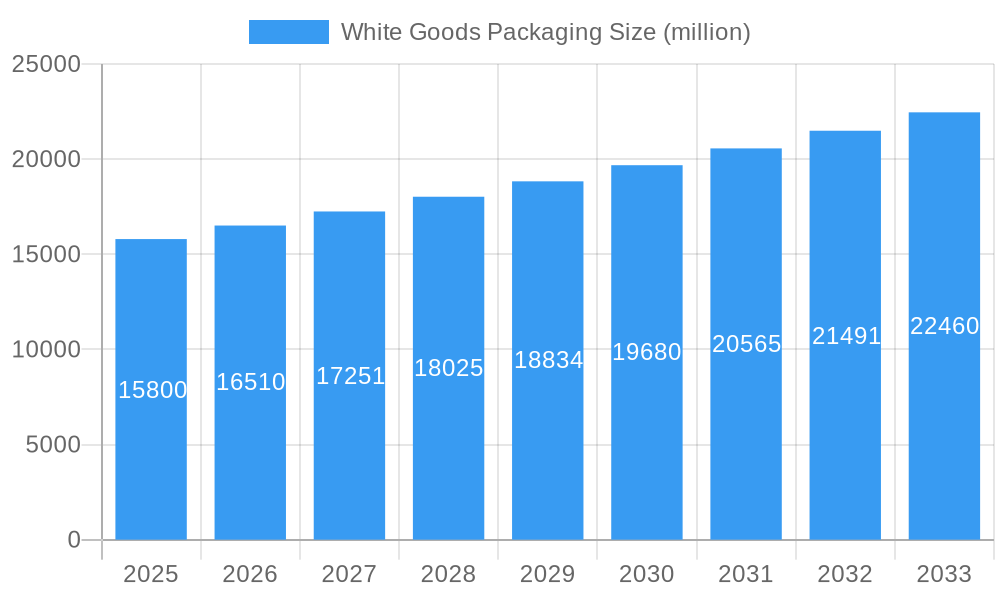
White Goods Packaging Market Size (In Billion)
The market caters to diverse white goods, with refrigerators, washing machines, and air conditioners requiring robust packaging solutions. The "Others" segment, including smaller consumer electronics, also presents substantial growth opportunities. Key players are investing in R&D for innovative packaging designs that enhance product protection, presentation, and the unboxing experience. Strategic partnerships and mergers are increasing to expand market reach and technological capabilities. While raw material price volatility and logistical challenges for large goods exist, the overall market outlook remains strongly positive.
White Goods Packaging Company Market Share
Gain critical market intelligence with this comprehensive analysis of the global white goods packaging sector. Covering 2019-2033, including a base year of 2025 and a forecast period of 2025-2033, this report details market dynamics, growth trends, regional analysis, product innovations, and future opportunities. Essential for manufacturers, suppliers, and stakeholders navigating the evolving appliance protection market.
White Goods Packaging Market Dynamics & Structure
The global white goods packaging market exhibits a moderately concentrated structure, with key players like Smurfit Kappa Plc, Sealed Air Corporation, and DS Smith Plc holding significant market shares. Technological innovation is primarily driven by the demand for sustainable, cost-effective, and protective packaging solutions that can withstand the rigors of transportation and handling. Regulatory frameworks, particularly those focused on environmental impact and waste reduction, are increasingly influencing material choices and packaging design. Competitive product substitutes include advancements in molded pulp, biodegradable plastics, and expanded polystyrene (EPS) alternatives. End-user demographics, characterized by a growing middle class in emerging economies and a rising demand for energy-efficient appliances, are shaping the types and volumes of white goods requiring robust packaging. Mergers and acquisitions (M&A) trends are observed as companies seek to expand their geographical reach, diversify their product portfolios, and enhance their sustainable offerings. For instance, recent M&A activities have focused on consolidating corrugated packaging manufacturers and acquiring innovative material providers.
- Market Concentration: Moderate, with a few key global players and regional specialists.
- Technological Innovation Drivers: Sustainability, cost optimization, enhanced protection, automation compatibility.
- Regulatory Frameworks: Emphasis on recyclability, biodegradability, and reduction of single-use plastics.
- Competitive Product Substitutes: Advanced molded pulp, bio-based plastics, advanced protective foams.
- End-User Demographics: Growing middle class, urbanization, demand for premium and eco-friendly products.
- M&A Trends: Consolidation for scale, acquisition of sustainable technology, market entry into growing regions.
White Goods Packaging Growth Trends & Insights
The global white goods packaging market is poised for significant expansion, driven by robust growth in the appliance industry and evolving consumer preferences for both durability and environmental responsibility. The market size is projected to witness a Compound Annual Growth Rate (CAGR) of approximately 5.8% between 2025 and 2033, reaching an estimated XX million units by 2033. This growth trajectory is underpinned by escalating demand for appliances such as refrigerators, washing machines, and air conditioners, particularly in developing economies where urbanization and rising disposable incomes are fueling household upgrades. Adoption rates for sustainable packaging materials, including recycled paper and paperboard, as well as advanced biodegradable plastics, are accelerating as manufacturers and consumers alike prioritize environmental stewardship. Technological disruptions are centered around lightweighting solutions, intelligent packaging that offers traceability and damage detection, and automated packaging systems that enhance efficiency and reduce labor costs. Consumer behavior shifts are increasingly favoring brands that demonstrate a commitment to sustainability, leading to a greater demand for eco-friendly packaging options. The penetration of e-commerce for large appliances also necessitates more resilient and protective packaging solutions capable of withstanding the challenges of direct-to-consumer shipping, further influencing packaging design and material selection. The shift towards smaller, modular, and more energy-efficient appliances also presents opportunities for innovative, optimized packaging solutions that minimize material usage and shipping volume.
Dominant Regions, Countries, or Segments in White Goods Packaging
The Asia Pacific region is expected to continue its dominance in the global white goods packaging market, driven by its status as a manufacturing powerhouse for consumer electronics and appliances, coupled with a burgeoning middle class and rapid urbanization. Countries like China, India, and Southeast Asian nations are experiencing unprecedented demand for refrigerators, washing machines, and air conditioners, directly translating into substantial requirements for their packaging. The economic policies in these regions, focused on industrial growth and export promotion, further solidify their leadership position. Infrastructure development, including improved logistics and warehousing facilities, also plays a crucial role in facilitating the efficient distribution of packaged white goods.
Within segments, Paper and Paperboard packaging is anticipated to remain a dominant force due to its established sustainability credentials, recyclability, and cost-effectiveness for a broad range of white goods. While plastic packaging offers specific protective benefits, increasing environmental scrutiny and regulatory pressures are driving a shift towards paper-based solutions.
- Dominant Region: Asia Pacific
- Key Drivers: High appliance manufacturing output, rapid urbanization, growing disposable incomes, favorable economic policies.
- Market Share: Estimated to account for over 40% of the global market by 2033.
- Growth Potential: Continued strong demand for domestic consumption and export markets.
- Dominant Segment (Type): Paper and Paperboard
- Key Drivers: Sustainability initiatives, recyclability, cost-effectiveness, versatility.
- Market Share: Expected to hold approximately 55% of the market share for white goods packaging.
- Growth Potential: Driven by innovation in corrugated board strength and eco-friendly coatings.
- Dominant Segment (Application): Refrigerators
- Key Drivers: High unit sales, need for robust protection, large size requiring substantial packaging.
- Market Share: Constitutes the largest application segment, estimated at 35% of the total packaging volume.
- Growth Potential: Stable growth aligned with appliance replacement cycles and new household formations.
White Goods Packaging Product Landscape
The product landscape for white goods packaging is characterized by a relentless pursuit of enhanced protection, sustainability, and cost-efficiency. Innovations include the development of high-strength, lightweight corrugated boards designed to minimize shipping costs while offering superior impact and puncture resistance. Advanced molded pulp solutions are gaining traction as eco-friendly alternatives to EPS, providing excellent cushioning properties for appliances of varying shapes and sizes. Smart packaging incorporating tamper-evident seals and humidity indicators is also emerging, offering added value through enhanced product integrity and supply chain visibility. The performance metrics are centered on achieving optimal shock absorption, vibration dampening, and resistance to environmental factors like moisture and temperature fluctuations.
Key Drivers, Barriers & Challenges in White Goods Packaging
Key Drivers:
- Growing Demand for Appliances: Rising global population and improving living standards fuel the need for white goods, directly increasing packaging requirements.
- E-commerce Expansion: The shift towards online retail for large appliances necessitates stronger, more resilient packaging for direct-to-consumer shipments.
- Sustainability Initiatives: Increasing environmental awareness and regulations are driving demand for recyclable, biodegradable, and sustainably sourced packaging materials.
- Technological Advancements: Innovations in material science and packaging design offer lighter, stronger, and more cost-effective solutions.
Barriers & Challenges:
- Supply Chain Disruptions: Volatility in raw material prices (e.g., paper pulp, plastic resins) and global logistics challenges can impact cost and availability.
- Regulatory Hurdles: Evolving environmental regulations across different regions can necessitate costly packaging redesigns and material substitutions.
- Cost Pressures: Manufacturers face pressure to balance the need for high-performance, sustainable packaging with cost-effectiveness, especially in price-sensitive markets.
- Competition from Alternative Materials: While paper and paperboard dominate, continuous innovation in plastics and other materials presents ongoing competitive pressure.
Emerging Opportunities in White Goods Packaging
Emerging opportunities lie in the development of intelligent packaging solutions that integrate IoT capabilities for real-time tracking and condition monitoring of appliances during transit. The growing demand for eco-friendly and customizable packaging in emerging markets presents significant untapped potential for suppliers offering sustainable alternatives. Furthermore, the modularization of appliances and the trend towards built-in kitchen systems are creating demand for specialized, tailored packaging designs that optimize space and protection for complex configurations. The circular economy model is also driving opportunities in reusable packaging systems for B2B logistics within the appliance manufacturing supply chain.
Growth Accelerators in the White Goods Packaging Industry
Several key growth accelerators are propelling the white goods packaging industry forward. The relentless drive towards sustainability, propelled by consumer demand and stringent environmental policies, is a primary catalyst, encouraging investment in eco-friendly materials and processes. Technological breakthroughs in material science, leading to lighter yet stronger packaging components, directly contribute to reduced transportation costs and improved handling efficiency. Strategic partnerships between packaging manufacturers and appliance brands are crucial for co-developing innovative solutions tailored to specific product needs and market demands. Furthermore, market expansion strategies focused on penetrating high-growth emerging economies, where appliance ownership is rapidly increasing, represent significant opportunities for sustained growth.
Key Players Shaping the White Goods Packaging Market
- Smurfit Kappa Plc
- Sealed Air Corporation
- Orlando Products Inc.
- UFP Technologies, Inc.
- DowDuPont Inc.
- DS Smith Plc
- Desco Industries Inc.
- Summit Packaging Solutions
- Delphon Industries, LLC
- Protective Packaging Corporation
- GWP Group Limited
- FEURER Group GmbH
- Empire Packages (P) Ltd.
- Parksons Packaging Ltd.
Notable Milestones in White Goods Packaging Sector
- 2020: Increased adoption of paper-based cushioning materials as a sustainable alternative to EPS.
- 2021: Significant investment in R&D for biodegradable and compostable packaging solutions for appliances.
- 2022: Rise in demand for modular packaging designs to accommodate diverse appliance sizes and configurations.
- 2023: Introduction of smart packaging technologies with integrated sensors for shipment monitoring.
- 2024: Growing focus on localized supply chains and reduced carbon footprint in packaging production.
In-Depth White Goods Packaging Market Outlook
The outlook for the white goods packaging market remains exceptionally positive, driven by a confluence of sustained appliance demand and a global imperative for environmental responsibility. Future growth will be significantly accelerated by innovations in smart packaging, enabling enhanced supply chain transparency and product integrity. Strategic alliances between material suppliers and appliance manufacturers will continue to be pivotal in developing bespoke, eco-efficient packaging solutions. The ongoing expansion into developing economies, coupled with an increasing consumer preference for sustainable products, presents a substantial runway for market growth and strategic opportunities for forward-thinking industry players.
White Goods Packaging Segmentation
-
1. Type
- 1.1. Plastic
- 1.2. Paper and Paperboard
-
2. Application
- 2.1. Refrigerators
- 2.2. Washing Machines
- 2.3. Air Conditioners
- 2.4. Others
White Goods Packaging Segmentation By Geography
-
1. North America
- 1.1. United States
- 1.2. Canada
- 1.3. Mexico
-
2. South America
- 2.1. Brazil
- 2.2. Argentina
- 2.3. Rest of South America
-
3. Europe
- 3.1. United Kingdom
- 3.2. Germany
- 3.3. France
- 3.4. Italy
- 3.5. Spain
- 3.6. Russia
- 3.7. Benelux
- 3.8. Nordics
- 3.9. Rest of Europe
-
4. Middle East & Africa
- 4.1. Turkey
- 4.2. Israel
- 4.3. GCC
- 4.4. North Africa
- 4.5. South Africa
- 4.6. Rest of Middle East & Africa
-
5. Asia Pacific
- 5.1. China
- 5.2. India
- 5.3. Japan
- 5.4. South Korea
- 5.5. ASEAN
- 5.6. Oceania
- 5.7. Rest of Asia Pacific
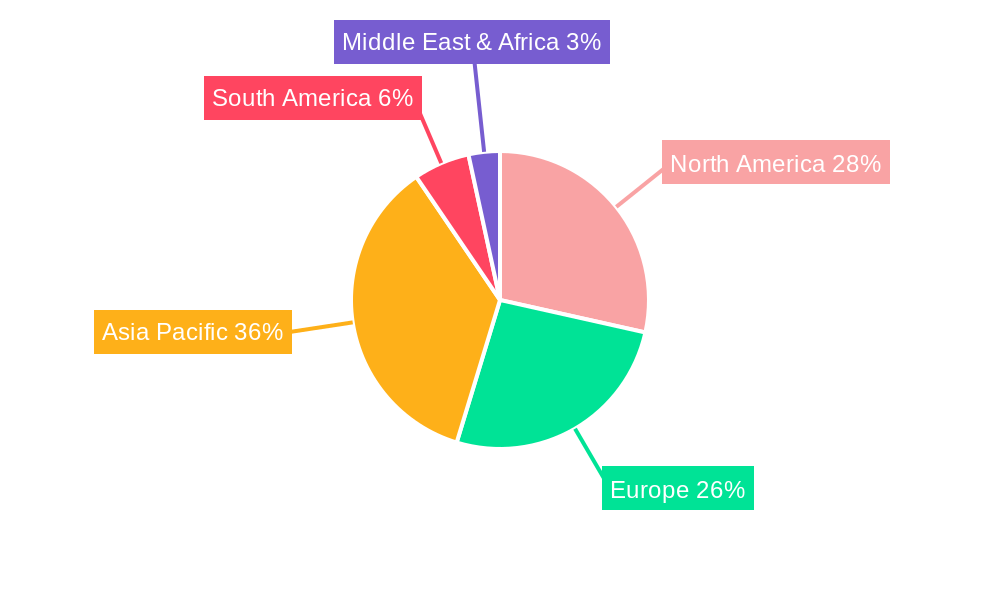
White Goods Packaging Regional Market Share
Geographic Coverage of White Goods Packaging
White Goods Packaging REPORT HIGHLIGHTS
| Aspects | Details |
|---|---|
| Study Period | 2020-2034 |
| Base Year | 2025 |
| Estimated Year | 2026 |
| Forecast Period | 2026-2034 |
| Historical Period | 2020-2025 |
| Growth Rate | CAGR of 4.01% from 2020-2034 |
| Segmentation |
|
Table of Contents
- 1. Introduction
- 1.1. Research Scope
- 1.2. Market Segmentation
- 1.3. Research Methodology
- 1.4. Definitions and Assumptions
- 2. Executive Summary
- 2.1. Introduction
- 3. Market Dynamics
- 3.1. Introduction
- 3.2. Market Drivers
- 3.3. Market Restrains
- 3.4. Market Trends
- 4. Market Factor Analysis
- 4.1. Porters Five Forces
- 4.2. Supply/Value Chain
- 4.3. PESTEL analysis
- 4.4. Market Entropy
- 4.5. Patent/Trademark Analysis
- 5. Global White Goods Packaging Analysis, Insights and Forecast, 2020-2032
- 5.1. Market Analysis, Insights and Forecast - by Type
- 5.1.1. Plastic
- 5.1.2. Paper and Paperboard
- 5.2. Market Analysis, Insights and Forecast - by Application
- 5.2.1. Refrigerators
- 5.2.2. Washing Machines
- 5.2.3. Air Conditioners
- 5.2.4. Others
- 5.3. Market Analysis, Insights and Forecast - by Region
- 5.3.1. North America
- 5.3.2. South America
- 5.3.3. Europe
- 5.3.4. Middle East & Africa
- 5.3.5. Asia Pacific
- 5.1. Market Analysis, Insights and Forecast - by Type
- 6. North America White Goods Packaging Analysis, Insights and Forecast, 2020-2032
- 6.1. Market Analysis, Insights and Forecast - by Type
- 6.1.1. Plastic
- 6.1.2. Paper and Paperboard
- 6.2. Market Analysis, Insights and Forecast - by Application
- 6.2.1. Refrigerators
- 6.2.2. Washing Machines
- 6.2.3. Air Conditioners
- 6.2.4. Others
- 6.1. Market Analysis, Insights and Forecast - by Type
- 7. South America White Goods Packaging Analysis, Insights and Forecast, 2020-2032
- 7.1. Market Analysis, Insights and Forecast - by Type
- 7.1.1. Plastic
- 7.1.2. Paper and Paperboard
- 7.2. Market Analysis, Insights and Forecast - by Application
- 7.2.1. Refrigerators
- 7.2.2. Washing Machines
- 7.2.3. Air Conditioners
- 7.2.4. Others
- 7.1. Market Analysis, Insights and Forecast - by Type
- 8. Europe White Goods Packaging Analysis, Insights and Forecast, 2020-2032
- 8.1. Market Analysis, Insights and Forecast - by Type
- 8.1.1. Plastic
- 8.1.2. Paper and Paperboard
- 8.2. Market Analysis, Insights and Forecast - by Application
- 8.2.1. Refrigerators
- 8.2.2. Washing Machines
- 8.2.3. Air Conditioners
- 8.2.4. Others
- 8.1. Market Analysis, Insights and Forecast - by Type
- 9. Middle East & Africa White Goods Packaging Analysis, Insights and Forecast, 2020-2032
- 9.1. Market Analysis, Insights and Forecast - by Type
- 9.1.1. Plastic
- 9.1.2. Paper and Paperboard
- 9.2. Market Analysis, Insights and Forecast - by Application
- 9.2.1. Refrigerators
- 9.2.2. Washing Machines
- 9.2.3. Air Conditioners
- 9.2.4. Others
- 9.1. Market Analysis, Insights and Forecast - by Type
- 10. Asia Pacific White Goods Packaging Analysis, Insights and Forecast, 2020-2032
- 10.1. Market Analysis, Insights and Forecast - by Type
- 10.1.1. Plastic
- 10.1.2. Paper and Paperboard
- 10.2. Market Analysis, Insights and Forecast - by Application
- 10.2.1. Refrigerators
- 10.2.2. Washing Machines
- 10.2.3. Air Conditioners
- 10.2.4. Others
- 10.1. Market Analysis, Insights and Forecast - by Type
- 11. Competitive Analysis
- 11.1. Global Market Share Analysis 2025
- 11.2. Company Profiles
- 11.2.1 Smurfit Kappa Plc
- 11.2.1.1. Overview
- 11.2.1.2. Products
- 11.2.1.3. SWOT Analysis
- 11.2.1.4. Recent Developments
- 11.2.1.5. Financials (Based on Availability)
- 11.2.2 Sealed Air Corporation
- 11.2.2.1. Overview
- 11.2.2.2. Products
- 11.2.2.3. SWOT Analysis
- 11.2.2.4. Recent Developments
- 11.2.2.5. Financials (Based on Availability)
- 11.2.3 Orlando Products Inc.
- 11.2.3.1. Overview
- 11.2.3.2. Products
- 11.2.3.3. SWOT Analysis
- 11.2.3.4. Recent Developments
- 11.2.3.5. Financials (Based on Availability)
- 11.2.4 UFP Technologies
- 11.2.4.1. Overview
- 11.2.4.2. Products
- 11.2.4.3. SWOT Analysis
- 11.2.4.4. Recent Developments
- 11.2.4.5. Financials (Based on Availability)
- 11.2.5 Inc.
- 11.2.5.1. Overview
- 11.2.5.2. Products
- 11.2.5.3. SWOT Analysis
- 11.2.5.4. Recent Developments
- 11.2.5.5. Financials (Based on Availability)
- 11.2.6 DowDuPont Inc.
- 11.2.6.1. Overview
- 11.2.6.2. Products
- 11.2.6.3. SWOT Analysis
- 11.2.6.4. Recent Developments
- 11.2.6.5. Financials (Based on Availability)
- 11.2.7 DS Smith Plc
- 11.2.7.1. Overview
- 11.2.7.2. Products
- 11.2.7.3. SWOT Analysis
- 11.2.7.4. Recent Developments
- 11.2.7.5. Financials (Based on Availability)
- 11.2.8 Desco Industries Inc.
- 11.2.8.1. Overview
- 11.2.8.2. Products
- 11.2.8.3. SWOT Analysis
- 11.2.8.4. Recent Developments
- 11.2.8.5. Financials (Based on Availability)
- 11.2.9 Summit Packaging Solutions
- 11.2.9.1. Overview
- 11.2.9.2. Products
- 11.2.9.3. SWOT Analysis
- 11.2.9.4. Recent Developments
- 11.2.9.5. Financials (Based on Availability)
- 11.2.10 Delphon Industries
- 11.2.10.1. Overview
- 11.2.10.2. Products
- 11.2.10.3. SWOT Analysis
- 11.2.10.4. Recent Developments
- 11.2.10.5. Financials (Based on Availability)
- 11.2.11 LLC
- 11.2.11.1. Overview
- 11.2.11.2. Products
- 11.2.11.3. SWOT Analysis
- 11.2.11.4. Recent Developments
- 11.2.11.5. Financials (Based on Availability)
- 11.2.12 Protective Packaging Corporation
- 11.2.12.1. Overview
- 11.2.12.2. Products
- 11.2.12.3. SWOT Analysis
- 11.2.12.4. Recent Developments
- 11.2.12.5. Financials (Based on Availability)
- 11.2.13 GWP Group Limited
- 11.2.13.1. Overview
- 11.2.13.2. Products
- 11.2.13.3. SWOT Analysis
- 11.2.13.4. Recent Developments
- 11.2.13.5. Financials (Based on Availability)
- 11.2.14 FEURER Group GmbH
- 11.2.14.1. Overview
- 11.2.14.2. Products
- 11.2.14.3. SWOT Analysis
- 11.2.14.4. Recent Developments
- 11.2.14.5. Financials (Based on Availability)
- 11.2.15 Empire Packages (P) Ltd.
- 11.2.15.1. Overview
- 11.2.15.2. Products
- 11.2.15.3. SWOT Analysis
- 11.2.15.4. Recent Developments
- 11.2.15.5. Financials (Based on Availability)
- 11.2.16 Parksons Packaging Ltd.
- 11.2.16.1. Overview
- 11.2.16.2. Products
- 11.2.16.3. SWOT Analysis
- 11.2.16.4. Recent Developments
- 11.2.16.5. Financials (Based on Availability)
- 11.2.1 Smurfit Kappa Plc
List of Figures
- Figure 1: Global White Goods Packaging Revenue Breakdown (billion, %) by Region 2025 & 2033
- Figure 2: Global White Goods Packaging Volume Breakdown (K, %) by Region 2025 & 2033
- Figure 3: North America White Goods Packaging Revenue (billion), by Type 2025 & 2033
- Figure 4: North America White Goods Packaging Volume (K), by Type 2025 & 2033
- Figure 5: North America White Goods Packaging Revenue Share (%), by Type 2025 & 2033
- Figure 6: North America White Goods Packaging Volume Share (%), by Type 2025 & 2033
- Figure 7: North America White Goods Packaging Revenue (billion), by Application 2025 & 2033
- Figure 8: North America White Goods Packaging Volume (K), by Application 2025 & 2033
- Figure 9: North America White Goods Packaging Revenue Share (%), by Application 2025 & 2033
- Figure 10: North America White Goods Packaging Volume Share (%), by Application 2025 & 2033
- Figure 11: North America White Goods Packaging Revenue (billion), by Country 2025 & 2033
- Figure 12: North America White Goods Packaging Volume (K), by Country 2025 & 2033
- Figure 13: North America White Goods Packaging Revenue Share (%), by Country 2025 & 2033
- Figure 14: North America White Goods Packaging Volume Share (%), by Country 2025 & 2033
- Figure 15: South America White Goods Packaging Revenue (billion), by Type 2025 & 2033
- Figure 16: South America White Goods Packaging Volume (K), by Type 2025 & 2033
- Figure 17: South America White Goods Packaging Revenue Share (%), by Type 2025 & 2033
- Figure 18: South America White Goods Packaging Volume Share (%), by Type 2025 & 2033
- Figure 19: South America White Goods Packaging Revenue (billion), by Application 2025 & 2033
- Figure 20: South America White Goods Packaging Volume (K), by Application 2025 & 2033
- Figure 21: South America White Goods Packaging Revenue Share (%), by Application 2025 & 2033
- Figure 22: South America White Goods Packaging Volume Share (%), by Application 2025 & 2033
- Figure 23: South America White Goods Packaging Revenue (billion), by Country 2025 & 2033
- Figure 24: South America White Goods Packaging Volume (K), by Country 2025 & 2033
- Figure 25: South America White Goods Packaging Revenue Share (%), by Country 2025 & 2033
- Figure 26: South America White Goods Packaging Volume Share (%), by Country 2025 & 2033
- Figure 27: Europe White Goods Packaging Revenue (billion), by Type 2025 & 2033
- Figure 28: Europe White Goods Packaging Volume (K), by Type 2025 & 2033
- Figure 29: Europe White Goods Packaging Revenue Share (%), by Type 2025 & 2033
- Figure 30: Europe White Goods Packaging Volume Share (%), by Type 2025 & 2033
- Figure 31: Europe White Goods Packaging Revenue (billion), by Application 2025 & 2033
- Figure 32: Europe White Goods Packaging Volume (K), by Application 2025 & 2033
- Figure 33: Europe White Goods Packaging Revenue Share (%), by Application 2025 & 2033
- Figure 34: Europe White Goods Packaging Volume Share (%), by Application 2025 & 2033
- Figure 35: Europe White Goods Packaging Revenue (billion), by Country 2025 & 2033
- Figure 36: Europe White Goods Packaging Volume (K), by Country 2025 & 2033
- Figure 37: Europe White Goods Packaging Revenue Share (%), by Country 2025 & 2033
- Figure 38: Europe White Goods Packaging Volume Share (%), by Country 2025 & 2033
- Figure 39: Middle East & Africa White Goods Packaging Revenue (billion), by Type 2025 & 2033
- Figure 40: Middle East & Africa White Goods Packaging Volume (K), by Type 2025 & 2033
- Figure 41: Middle East & Africa White Goods Packaging Revenue Share (%), by Type 2025 & 2033
- Figure 42: Middle East & Africa White Goods Packaging Volume Share (%), by Type 2025 & 2033
- Figure 43: Middle East & Africa White Goods Packaging Revenue (billion), by Application 2025 & 2033
- Figure 44: Middle East & Africa White Goods Packaging Volume (K), by Application 2025 & 2033
- Figure 45: Middle East & Africa White Goods Packaging Revenue Share (%), by Application 2025 & 2033
- Figure 46: Middle East & Africa White Goods Packaging Volume Share (%), by Application 2025 & 2033
- Figure 47: Middle East & Africa White Goods Packaging Revenue (billion), by Country 2025 & 2033
- Figure 48: Middle East & Africa White Goods Packaging Volume (K), by Country 2025 & 2033
- Figure 49: Middle East & Africa White Goods Packaging Revenue Share (%), by Country 2025 & 2033
- Figure 50: Middle East & Africa White Goods Packaging Volume Share (%), by Country 2025 & 2033
- Figure 51: Asia Pacific White Goods Packaging Revenue (billion), by Type 2025 & 2033
- Figure 52: Asia Pacific White Goods Packaging Volume (K), by Type 2025 & 2033
- Figure 53: Asia Pacific White Goods Packaging Revenue Share (%), by Type 2025 & 2033
- Figure 54: Asia Pacific White Goods Packaging Volume Share (%), by Type 2025 & 2033
- Figure 55: Asia Pacific White Goods Packaging Revenue (billion), by Application 2025 & 2033
- Figure 56: Asia Pacific White Goods Packaging Volume (K), by Application 2025 & 2033
- Figure 57: Asia Pacific White Goods Packaging Revenue Share (%), by Application 2025 & 2033
- Figure 58: Asia Pacific White Goods Packaging Volume Share (%), by Application 2025 & 2033
- Figure 59: Asia Pacific White Goods Packaging Revenue (billion), by Country 2025 & 2033
- Figure 60: Asia Pacific White Goods Packaging Volume (K), by Country 2025 & 2033
- Figure 61: Asia Pacific White Goods Packaging Revenue Share (%), by Country 2025 & 2033
- Figure 62: Asia Pacific White Goods Packaging Volume Share (%), by Country 2025 & 2033
List of Tables
- Table 1: Global White Goods Packaging Revenue billion Forecast, by Type 2020 & 2033
- Table 2: Global White Goods Packaging Volume K Forecast, by Type 2020 & 2033
- Table 3: Global White Goods Packaging Revenue billion Forecast, by Application 2020 & 2033
- Table 4: Global White Goods Packaging Volume K Forecast, by Application 2020 & 2033
- Table 5: Global White Goods Packaging Revenue billion Forecast, by Region 2020 & 2033
- Table 6: Global White Goods Packaging Volume K Forecast, by Region 2020 & 2033
- Table 7: Global White Goods Packaging Revenue billion Forecast, by Type 2020 & 2033
- Table 8: Global White Goods Packaging Volume K Forecast, by Type 2020 & 2033
- Table 9: Global White Goods Packaging Revenue billion Forecast, by Application 2020 & 2033
- Table 10: Global White Goods Packaging Volume K Forecast, by Application 2020 & 2033
- Table 11: Global White Goods Packaging Revenue billion Forecast, by Country 2020 & 2033
- Table 12: Global White Goods Packaging Volume K Forecast, by Country 2020 & 2033
- Table 13: United States White Goods Packaging Revenue (billion) Forecast, by Application 2020 & 2033
- Table 14: United States White Goods Packaging Volume (K) Forecast, by Application 2020 & 2033
- Table 15: Canada White Goods Packaging Revenue (billion) Forecast, by Application 2020 & 2033
- Table 16: Canada White Goods Packaging Volume (K) Forecast, by Application 2020 & 2033
- Table 17: Mexico White Goods Packaging Revenue (billion) Forecast, by Application 2020 & 2033
- Table 18: Mexico White Goods Packaging Volume (K) Forecast, by Application 2020 & 2033
- Table 19: Global White Goods Packaging Revenue billion Forecast, by Type 2020 & 2033
- Table 20: Global White Goods Packaging Volume K Forecast, by Type 2020 & 2033
- Table 21: Global White Goods Packaging Revenue billion Forecast, by Application 2020 & 2033
- Table 22: Global White Goods Packaging Volume K Forecast, by Application 2020 & 2033
- Table 23: Global White Goods Packaging Revenue billion Forecast, by Country 2020 & 2033
- Table 24: Global White Goods Packaging Volume K Forecast, by Country 2020 & 2033
- Table 25: Brazil White Goods Packaging Revenue (billion) Forecast, by Application 2020 & 2033
- Table 26: Brazil White Goods Packaging Volume (K) Forecast, by Application 2020 & 2033
- Table 27: Argentina White Goods Packaging Revenue (billion) Forecast, by Application 2020 & 2033
- Table 28: Argentina White Goods Packaging Volume (K) Forecast, by Application 2020 & 2033
- Table 29: Rest of South America White Goods Packaging Revenue (billion) Forecast, by Application 2020 & 2033
- Table 30: Rest of South America White Goods Packaging Volume (K) Forecast, by Application 2020 & 2033
- Table 31: Global White Goods Packaging Revenue billion Forecast, by Type 2020 & 2033
- Table 32: Global White Goods Packaging Volume K Forecast, by Type 2020 & 2033
- Table 33: Global White Goods Packaging Revenue billion Forecast, by Application 2020 & 2033
- Table 34: Global White Goods Packaging Volume K Forecast, by Application 2020 & 2033
- Table 35: Global White Goods Packaging Revenue billion Forecast, by Country 2020 & 2033
- Table 36: Global White Goods Packaging Volume K Forecast, by Country 2020 & 2033
- Table 37: United Kingdom White Goods Packaging Revenue (billion) Forecast, by Application 2020 & 2033
- Table 38: United Kingdom White Goods Packaging Volume (K) Forecast, by Application 2020 & 2033
- Table 39: Germany White Goods Packaging Revenue (billion) Forecast, by Application 2020 & 2033
- Table 40: Germany White Goods Packaging Volume (K) Forecast, by Application 2020 & 2033
- Table 41: France White Goods Packaging Revenue (billion) Forecast, by Application 2020 & 2033
- Table 42: France White Goods Packaging Volume (K) Forecast, by Application 2020 & 2033
- Table 43: Italy White Goods Packaging Revenue (billion) Forecast, by Application 2020 & 2033
- Table 44: Italy White Goods Packaging Volume (K) Forecast, by Application 2020 & 2033
- Table 45: Spain White Goods Packaging Revenue (billion) Forecast, by Application 2020 & 2033
- Table 46: Spain White Goods Packaging Volume (K) Forecast, by Application 2020 & 2033
- Table 47: Russia White Goods Packaging Revenue (billion) Forecast, by Application 2020 & 2033
- Table 48: Russia White Goods Packaging Volume (K) Forecast, by Application 2020 & 2033
- Table 49: Benelux White Goods Packaging Revenue (billion) Forecast, by Application 2020 & 2033
- Table 50: Benelux White Goods Packaging Volume (K) Forecast, by Application 2020 & 2033
- Table 51: Nordics White Goods Packaging Revenue (billion) Forecast, by Application 2020 & 2033
- Table 52: Nordics White Goods Packaging Volume (K) Forecast, by Application 2020 & 2033
- Table 53: Rest of Europe White Goods Packaging Revenue (billion) Forecast, by Application 2020 & 2033
- Table 54: Rest of Europe White Goods Packaging Volume (K) Forecast, by Application 2020 & 2033
- Table 55: Global White Goods Packaging Revenue billion Forecast, by Type 2020 & 2033
- Table 56: Global White Goods Packaging Volume K Forecast, by Type 2020 & 2033
- Table 57: Global White Goods Packaging Revenue billion Forecast, by Application 2020 & 2033
- Table 58: Global White Goods Packaging Volume K Forecast, by Application 2020 & 2033
- Table 59: Global White Goods Packaging Revenue billion Forecast, by Country 2020 & 2033
- Table 60: Global White Goods Packaging Volume K Forecast, by Country 2020 & 2033
- Table 61: Turkey White Goods Packaging Revenue (billion) Forecast, by Application 2020 & 2033
- Table 62: Turkey White Goods Packaging Volume (K) Forecast, by Application 2020 & 2033
- Table 63: Israel White Goods Packaging Revenue (billion) Forecast, by Application 2020 & 2033
- Table 64: Israel White Goods Packaging Volume (K) Forecast, by Application 2020 & 2033
- Table 65: GCC White Goods Packaging Revenue (billion) Forecast, by Application 2020 & 2033
- Table 66: GCC White Goods Packaging Volume (K) Forecast, by Application 2020 & 2033
- Table 67: North Africa White Goods Packaging Revenue (billion) Forecast, by Application 2020 & 2033
- Table 68: North Africa White Goods Packaging Volume (K) Forecast, by Application 2020 & 2033
- Table 69: South Africa White Goods Packaging Revenue (billion) Forecast, by Application 2020 & 2033
- Table 70: South Africa White Goods Packaging Volume (K) Forecast, by Application 2020 & 2033
- Table 71: Rest of Middle East & Africa White Goods Packaging Revenue (billion) Forecast, by Application 2020 & 2033
- Table 72: Rest of Middle East & Africa White Goods Packaging Volume (K) Forecast, by Application 2020 & 2033
- Table 73: Global White Goods Packaging Revenue billion Forecast, by Type 2020 & 2033
- Table 74: Global White Goods Packaging Volume K Forecast, by Type 2020 & 2033
- Table 75: Global White Goods Packaging Revenue billion Forecast, by Application 2020 & 2033
- Table 76: Global White Goods Packaging Volume K Forecast, by Application 2020 & 2033
- Table 77: Global White Goods Packaging Revenue billion Forecast, by Country 2020 & 2033
- Table 78: Global White Goods Packaging Volume K Forecast, by Country 2020 & 2033
- Table 79: China White Goods Packaging Revenue (billion) Forecast, by Application 2020 & 2033
- Table 80: China White Goods Packaging Volume (K) Forecast, by Application 2020 & 2033
- Table 81: India White Goods Packaging Revenue (billion) Forecast, by Application 2020 & 2033
- Table 82: India White Goods Packaging Volume (K) Forecast, by Application 2020 & 2033
- Table 83: Japan White Goods Packaging Revenue (billion) Forecast, by Application 2020 & 2033
- Table 84: Japan White Goods Packaging Volume (K) Forecast, by Application 2020 & 2033
- Table 85: South Korea White Goods Packaging Revenue (billion) Forecast, by Application 2020 & 2033
- Table 86: South Korea White Goods Packaging Volume (K) Forecast, by Application 2020 & 2033
- Table 87: ASEAN White Goods Packaging Revenue (billion) Forecast, by Application 2020 & 2033
- Table 88: ASEAN White Goods Packaging Volume (K) Forecast, by Application 2020 & 2033
- Table 89: Oceania White Goods Packaging Revenue (billion) Forecast, by Application 2020 & 2033
- Table 90: Oceania White Goods Packaging Volume (K) Forecast, by Application 2020 & 2033
- Table 91: Rest of Asia Pacific White Goods Packaging Revenue (billion) Forecast, by Application 2020 & 2033
- Table 92: Rest of Asia Pacific White Goods Packaging Volume (K) Forecast, by Application 2020 & 2033
Frequently Asked Questions
1. What is the projected Compound Annual Growth Rate (CAGR) of the White Goods Packaging?
The projected CAGR is approximately 4.01%.
2. Which companies are prominent players in the White Goods Packaging?
Key companies in the market include Smurfit Kappa Plc, Sealed Air Corporation, Orlando Products Inc., UFP Technologies, Inc., DowDuPont Inc., DS Smith Plc, Desco Industries Inc., Summit Packaging Solutions, Delphon Industries, LLC, Protective Packaging Corporation, GWP Group Limited, FEURER Group GmbH, Empire Packages (P) Ltd., Parksons Packaging Ltd..
3. What are the main segments of the White Goods Packaging?
The market segments include Type, Application.
4. Can you provide details about the market size?
The market size is estimated to be USD 215.32 billion as of 2022.
5. What are some drivers contributing to market growth?
N/A
6. What are the notable trends driving market growth?
N/A
7. Are there any restraints impacting market growth?
N/A
8. Can you provide examples of recent developments in the market?
N/A
9. What pricing options are available for accessing the report?
Pricing options include single-user, multi-user, and enterprise licenses priced at USD 4350.00, USD 6525.00, and USD 8700.00 respectively.
10. Is the market size provided in terms of value or volume?
The market size is provided in terms of value, measured in billion and volume, measured in K.
11. Are there any specific market keywords associated with the report?
Yes, the market keyword associated with the report is "White Goods Packaging," which aids in identifying and referencing the specific market segment covered.
12. How do I determine which pricing option suits my needs best?
The pricing options vary based on user requirements and access needs. Individual users may opt for single-user licenses, while businesses requiring broader access may choose multi-user or enterprise licenses for cost-effective access to the report.
13. Are there any additional resources or data provided in the White Goods Packaging report?
While the report offers comprehensive insights, it's advisable to review the specific contents or supplementary materials provided to ascertain if additional resources or data are available.
14. How can I stay updated on further developments or reports in the White Goods Packaging?
To stay informed about further developments, trends, and reports in the White Goods Packaging, consider subscribing to industry newsletters, following relevant companies and organizations, or regularly checking reputable industry news sources and publications.
Methodology
Step 1 - Identification of Relevant Samples Size from Population Database


Step 2 - Approaches for Defining Global Market Size (Value, Volume* & Price*)

Note*: In applicable scenarios
Step 3 - Data Sources
Primary Research
- Web Analytics
- Survey Reports
- Research Institute
- Latest Research Reports
- Opinion Leaders
Secondary Research
- Annual Reports
- White Paper
- Latest Press Release
- Industry Association
- Paid Database
- Investor Presentations

Step 4 - Data Triangulation
Involves using different sources of information in order to increase the validity of a study
These sources are likely to be stakeholders in a program - participants, other researchers, program staff, other community members, and so on.
Then we put all data in single framework & apply various statistical tools to find out the dynamic on the market.
During the analysis stage, feedback from the stakeholder groups would be compared to determine areas of agreement as well as areas of divergence