

Key Insights
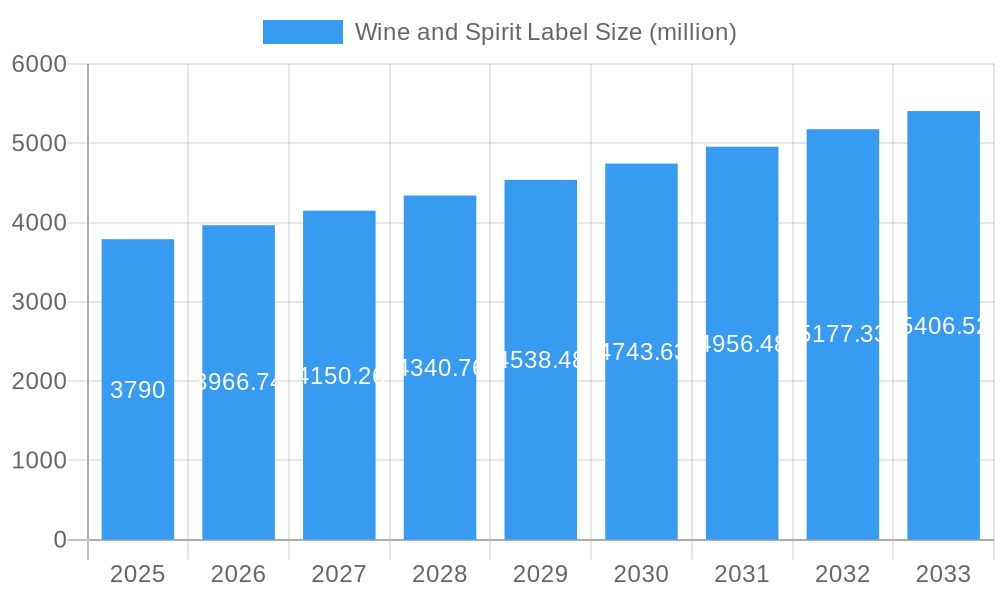
The global wine and spirit label market, currently valued at approximately $3.79 billion in 2025, is projected to experience steady growth, exhibiting a compound annual growth rate (CAGR) of 4.6% from 2025 to 2033. This growth is fueled by several key factors. The increasing premiumization of wine and spirits, with brands investing heavily in sophisticated label designs to enhance their product image and appeal to discerning consumers, is a major driver. Furthermore, the burgeoning e-commerce sector for alcoholic beverages necessitates high-quality labels that are visually appealing and effectively convey product information online. Growing consumer demand for sustainable and eco-friendly packaging solutions is also influencing the market, leading to increased adoption of recycled and recyclable label materials. While potential supply chain disruptions and fluctuations in raw material prices could pose challenges, the overall market outlook remains positive, driven by consistent demand from established and emerging markets.
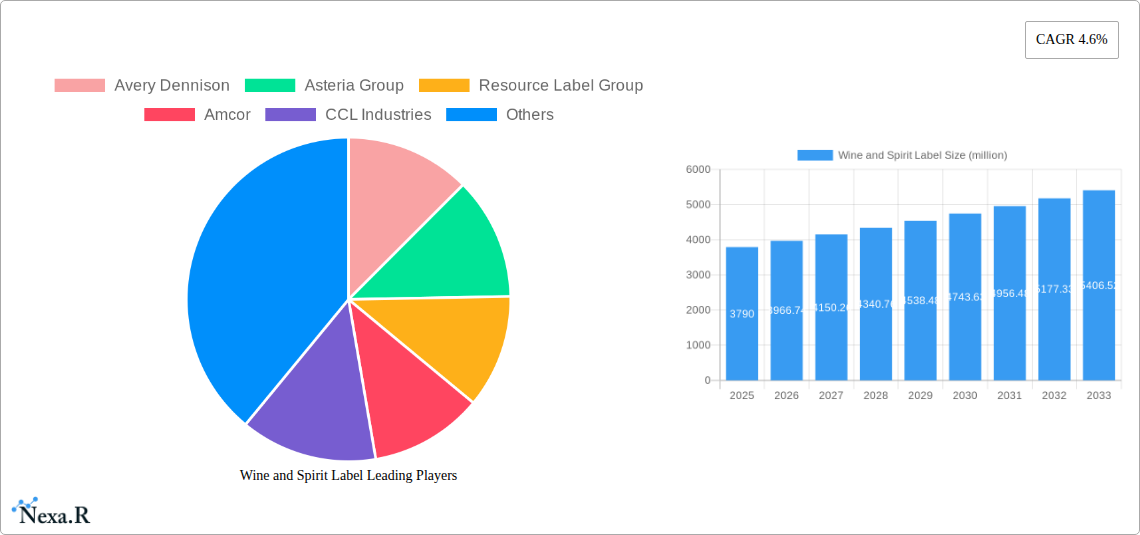
Wine and Spirit Label Market Size (In Billion)
Competition within the wine and spirit label market is intense, with a mix of large multinational corporations like Avery Dennison, Amcor, and CCL Industries, and smaller, specialized players such as Labelys and Prakash Labels. These companies are constantly innovating to offer a diverse range of label materials, printing technologies (including digital printing for customized and short-run labels), and finishing options to meet evolving customer needs. The market is also seeing a rise in the adoption of smart labels incorporating technologies like RFID and NFC, which enhance product traceability and consumer engagement. Geographical distribution is likely skewed towards regions with established wine and spirits production and consumption, such as North America and Europe, but growth potential lies in expanding markets in Asia and Latin America, driven by rising disposable incomes and changing consumption patterns.
Wine and Spirit Label Company Market Share
Wine and Spirit Label Market Report: 2019-2033
This comprehensive report provides a detailed analysis of the global wine and spirit label market, offering invaluable insights for industry professionals, investors, and strategic decision-makers. The study covers the period 2019-2033, with a base year of 2025 and a forecast period of 2025-2033. The report leverages extensive primary and secondary research to deliver a 360-degree view of market dynamics, growth trends, competitive landscape, and future outlook. The global market size is projected to reach xx million units by 2033.
Wine and Spirit Label Market Dynamics & Structure
The wine and spirit label market is characterized by a moderately concentrated landscape, with key players like Avery Dennison, Amcor, and CCL Industries holding significant market share. Technological innovation, particularly in digital printing and sustainable materials, is a major driver. Stringent regulatory frameworks concerning labeling requirements and environmental concerns influence market dynamics. Competition from alternative packaging solutions, such as direct-to-consumer printing, presents challenges. The market is segmented by label type (paper, film, etc.), printing technology (flexographic, digital, etc.), and end-use application (wine bottles, spirits bottles, etc.). Mergers and acquisitions (M&A) activity has been moderate in recent years, with several companies consolidating their market positions.
- Market Concentration: The top 5 players hold approximately xx% of the market share in 2025.
- Technological Innovation: Digital printing is gaining traction, offering greater flexibility and customization.
- Regulatory Framework: Regulations regarding labeling accuracy, material composition, and sustainability are constantly evolving.
- Competitive Substitutes: Direct-to-consumer printing and alternative packaging pose a growing threat.
- M&A Activity: An estimated xx M&A deals were recorded between 2019 and 2024.
Wine and Spirit Label Growth Trends & Insights
The wine and spirit label market experienced a CAGR of xx% during the historical period (2019-2024), driven by factors such as the growing demand for alcoholic beverages, increasing preference for premium labels, and technological advancements in label printing. Market penetration for sustainable labels is growing, reflecting increased consumer and regulatory focus on environmental concerns. The adoption of digital printing is rapidly increasing, with xx% of labels expected to be digitally printed by 2033. Consumer behavior shifts towards personalized labels and unique designs are further fueling market growth.
The forecast period (2025-2033) projects a CAGR of xx%, with market size expected to reach xx million units by 2033. This growth is attributed to [detailed analysis leveraging XXX – this section requires data input].
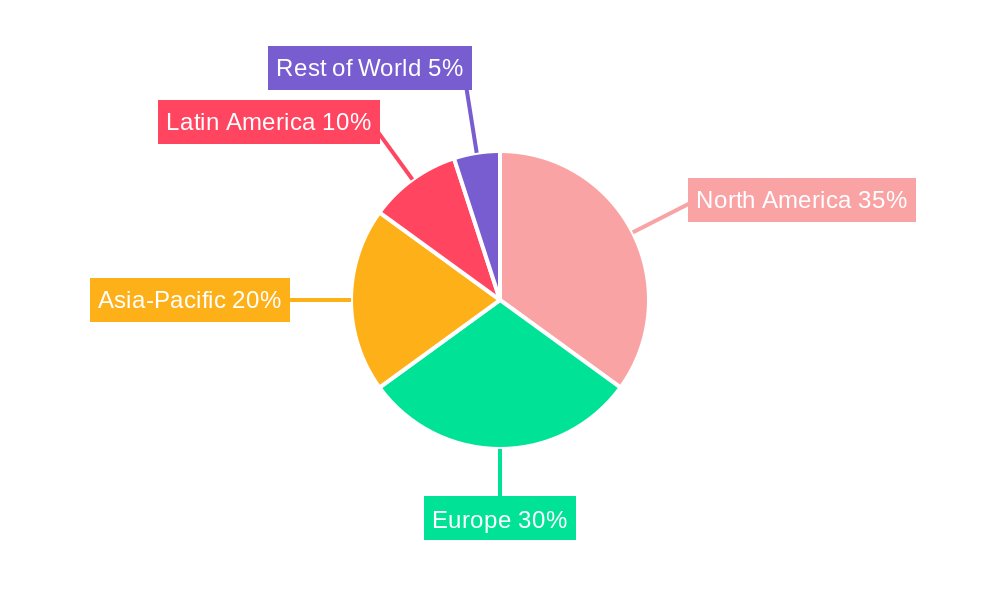
Dominant Regions, Countries, or Segments in Wine and Spirit Label
North America and Europe currently dominate the wine and spirit label market, owing to high consumption of alcoholic beverages and established label manufacturing infrastructure. However, Asia-Pacific is experiencing rapid growth, fueled by increasing disposable incomes and changing consumer preferences. The premium segment holds the largest market share, reflecting the willingness of consumers to pay for high-quality labels.
- North America: Strong wine and spirit consumption, advanced printing technologies.
- Europe: Established manufacturing base, high demand for premium labels.
- Asia-Pacific: Rapidly growing consumer market, increasing disposable incomes.
- Premium Segment: High-value labels command a significant share due to their design and aesthetic appeal.
Wine and Spirit Label Product Landscape
The wine and spirit label market offers a diverse range of products, including paper labels, film labels, and self-adhesive labels. Innovations in material science, such as the use of eco-friendly materials and enhanced durability, are driving product development. Technological advancements in printing technologies, including digital printing and 3D printing, are enabling greater customization and design flexibility. Unique selling propositions include enhanced branding capabilities, improved shelf appeal, and sustainable material options.
Key Drivers, Barriers & Challenges in Wine and Spirit Label
Key Drivers:
- Growing demand for alcoholic beverages globally.
- Increasing preference for premium and customized labels.
- Technological advancements in printing and material science.
- Stricter regulations promoting sustainable packaging options.
Key Challenges:
- Fluctuations in raw material prices (e.g., paper, adhesives).
- Intense competition among label manufacturers.
- Environmental concerns and the need for sustainable solutions.
- Stringent regulations related to labeling and material compliance.
Emerging Opportunities in Wine and Spirit Label
Emerging opportunities include the growth of the craft beverage sector, the increasing demand for personalized and interactive labels (e.g., augmented reality), and the exploration of innovative label materials (e.g., bio-based materials). Untapped markets in developing economies also present significant potential for growth.
Growth Accelerators in the Wine and Spirit Label Industry
Strategic partnerships between label manufacturers and beverage companies are boosting growth, facilitating collaborative innovation and streamlined supply chains. Technological breakthroughs in digital printing and sustainable materials are creating new opportunities for customization and eco-friendly labeling. Market expansion strategies, such as entering new geographic regions and catering to niche segments, are driving market growth.
Key Players Shaping the Wine and Spirit Label Market
- Avery Dennison
- Amcor
- CCL Industries
- LINTEC
- Berry Global
- Cenveo
- Multi-Color Corporation
- Klckner Pentaplast
- Reflex Group
- Ultra
- UPM Global
- Inovar Packaging Group
- Smith and McLaurin
- QLM Group
- Labelys
- Prakash Labels
- Autajon Group
- G3 Enterprises
- ID Images
- Weber Packaging Solutions
- Asteria Group
- Resource Label Group
Notable Milestones in Wine and Spirit Label Sector
- 2020: Increased adoption of sustainable materials by major players.
- 2021: Launch of several new digital printing technologies.
- 2022: Several significant mergers and acquisitions in the industry.
- 2023: Growing focus on personalization and augmented reality labels.
- 2024: Stringent new environmental regulations implemented in key markets.
In-Depth Wine and Spirit Label Market Outlook
The future of the wine and spirit label market looks bright, driven by continued growth in the alcoholic beverage sector and ongoing innovation in label technology and materials. Strategic partnerships, investments in R&D, and a focus on sustainability will be key factors in determining long-term success. The market is poised for considerable expansion, offering significant opportunities for established players and new entrants alike. The potential for market expansion into emerging markets and the development of innovative product offerings are crucial growth accelerators.
Wine and Spirit Label Segmentation
-
1. Application
- 1.1. Wine
- 1.2. Spirit
-
2. Types
- 2.1. Paper Label
- 2.2. Foil Label
- 2.3. Others
Wine and Spirit Label Segmentation By Geography
-
1. North America
- 1.1. United States
- 1.2. Canada
- 1.3. Mexico
-
2. South America
- 2.1. Brazil
- 2.2. Argentina
- 2.3. Rest of South America
-
3. Europe
- 3.1. United Kingdom
- 3.2. Germany
- 3.3. France
- 3.4. Italy
- 3.5. Spain
- 3.6. Russia
- 3.7. Benelux
- 3.8. Nordics
- 3.9. Rest of Europe
-
4. Middle East & Africa
- 4.1. Turkey
- 4.2. Israel
- 4.3. GCC
- 4.4. North Africa
- 4.5. South Africa
- 4.6. Rest of Middle East & Africa
-
5. Asia Pacific
- 5.1. China
- 5.2. India
- 5.3. Japan
- 5.4. South Korea
- 5.5. ASEAN
- 5.6. Oceania
- 5.7. Rest of Asia Pacific
Wine and Spirit Label Regional Market Share
Geographic Coverage of Wine and Spirit Label
Wine and Spirit Label REPORT HIGHLIGHTS
| Aspects | Details |
|---|---|
| Study Period | 2020-2034 |
| Base Year | 2025 |
| Estimated Year | 2026 |
| Forecast Period | 2026-2034 |
| Historical Period | 2020-2025 |
| Growth Rate | CAGR of 4.6% from 2020-2034 |
| Segmentation |
|
Table of Contents
- 1. Introduction
- 1.1. Research Scope
- 1.2. Market Segmentation
- 1.3. Research Methodology
- 1.4. Definitions and Assumptions
- 2. Executive Summary
- 2.1. Introduction
- 3. Market Dynamics
- 3.1. Introduction
- 3.2. Market Drivers
- 3.3. Market Restrains
- 3.4. Market Trends
- 4. Market Factor Analysis
- 4.1. Porters Five Forces
- 4.2. Supply/Value Chain
- 4.3. PESTEL analysis
- 4.4. Market Entropy
- 4.5. Patent/Trademark Analysis
- 5. Global Wine and Spirit Label Analysis, Insights and Forecast, 2020-2032
- 5.1. Market Analysis, Insights and Forecast - by Application
- 5.1.1. Wine
- 5.1.2. Spirit
- 5.2. Market Analysis, Insights and Forecast - by Types
- 5.2.1. Paper Label
- 5.2.2. Foil Label
- 5.2.3. Others
- 5.3. Market Analysis, Insights and Forecast - by Region
- 5.3.1. North America
- 5.3.2. South America
- 5.3.3. Europe
- 5.3.4. Middle East & Africa
- 5.3.5. Asia Pacific
- 5.1. Market Analysis, Insights and Forecast - by Application
- 6. North America Wine and Spirit Label Analysis, Insights and Forecast, 2020-2032
- 6.1. Market Analysis, Insights and Forecast - by Application
- 6.1.1. Wine
- 6.1.2. Spirit
- 6.2. Market Analysis, Insights and Forecast - by Types
- 6.2.1. Paper Label
- 6.2.2. Foil Label
- 6.2.3. Others
- 6.1. Market Analysis, Insights and Forecast - by Application
- 7. South America Wine and Spirit Label Analysis, Insights and Forecast, 2020-2032
- 7.1. Market Analysis, Insights and Forecast - by Application
- 7.1.1. Wine
- 7.1.2. Spirit
- 7.2. Market Analysis, Insights and Forecast - by Types
- 7.2.1. Paper Label
- 7.2.2. Foil Label
- 7.2.3. Others
- 7.1. Market Analysis, Insights and Forecast - by Application
- 8. Europe Wine and Spirit Label Analysis, Insights and Forecast, 2020-2032
- 8.1. Market Analysis, Insights and Forecast - by Application
- 8.1.1. Wine
- 8.1.2. Spirit
- 8.2. Market Analysis, Insights and Forecast - by Types
- 8.2.1. Paper Label
- 8.2.2. Foil Label
- 8.2.3. Others
- 8.1. Market Analysis, Insights and Forecast - by Application
- 9. Middle East & Africa Wine and Spirit Label Analysis, Insights and Forecast, 2020-2032
- 9.1. Market Analysis, Insights and Forecast - by Application
- 9.1.1. Wine
- 9.1.2. Spirit
- 9.2. Market Analysis, Insights and Forecast - by Types
- 9.2.1. Paper Label
- 9.2.2. Foil Label
- 9.2.3. Others
- 9.1. Market Analysis, Insights and Forecast - by Application
- 10. Asia Pacific Wine and Spirit Label Analysis, Insights and Forecast, 2020-2032
- 10.1. Market Analysis, Insights and Forecast - by Application
- 10.1.1. Wine
- 10.1.2. Spirit
- 10.2. Market Analysis, Insights and Forecast - by Types
- 10.2.1. Paper Label
- 10.2.2. Foil Label
- 10.2.3. Others
- 10.1. Market Analysis, Insights and Forecast - by Application
- 11. Competitive Analysis
- 11.1. Global Market Share Analysis 2025
- 11.2. Company Profiles
- 11.2.1 Avery Dennison
- 11.2.1.1. Overview
- 11.2.1.2. Products
- 11.2.1.3. SWOT Analysis
- 11.2.1.4. Recent Developments
- 11.2.1.5. Financials (Based on Availability)
- 11.2.2 Asteria Group
- 11.2.2.1. Overview
- 11.2.2.2. Products
- 11.2.2.3. SWOT Analysis
- 11.2.2.4. Recent Developments
- 11.2.2.5. Financials (Based on Availability)
- 11.2.3 Resource Label Group
- 11.2.3.1. Overview
- 11.2.3.2. Products
- 11.2.3.3. SWOT Analysis
- 11.2.3.4. Recent Developments
- 11.2.3.5. Financials (Based on Availability)
- 11.2.4 Amcor
- 11.2.4.1. Overview
- 11.2.4.2. Products
- 11.2.4.3. SWOT Analysis
- 11.2.4.4. Recent Developments
- 11.2.4.5. Financials (Based on Availability)
- 11.2.5 CCL Industries
- 11.2.5.1. Overview
- 11.2.5.2. Products
- 11.2.5.3. SWOT Analysis
- 11.2.5.4. Recent Developments
- 11.2.5.5. Financials (Based on Availability)
- 11.2.6 LINTEC
- 11.2.6.1. Overview
- 11.2.6.2. Products
- 11.2.6.3. SWOT Analysis
- 11.2.6.4. Recent Developments
- 11.2.6.5. Financials (Based on Availability)
- 11.2.7 Berry Global
- 11.2.7.1. Overview
- 11.2.7.2. Products
- 11.2.7.3. SWOT Analysis
- 11.2.7.4. Recent Developments
- 11.2.7.5. Financials (Based on Availability)
- 11.2.8 Cenveo
- 11.2.8.1. Overview
- 11.2.8.2. Products
- 11.2.8.3. SWOT Analysis
- 11.2.8.4. Recent Developments
- 11.2.8.5. Financials (Based on Availability)
- 11.2.9 Multi-Color Corporation
- 11.2.9.1. Overview
- 11.2.9.2. Products
- 11.2.9.3. SWOT Analysis
- 11.2.9.4. Recent Developments
- 11.2.9.5. Financials (Based on Availability)
- 11.2.10 Klckner Pentaplast
- 11.2.10.1. Overview
- 11.2.10.2. Products
- 11.2.10.3. SWOT Analysis
- 11.2.10.4. Recent Developments
- 11.2.10.5. Financials (Based on Availability)
- 11.2.11 Reflex Group
- 11.2.11.1. Overview
- 11.2.11.2. Products
- 11.2.11.3. SWOT Analysis
- 11.2.11.4. Recent Developments
- 11.2.11.5. Financials (Based on Availability)
- 11.2.12 Ultra
- 11.2.12.1. Overview
- 11.2.12.2. Products
- 11.2.12.3. SWOT Analysis
- 11.2.12.4. Recent Developments
- 11.2.12.5. Financials (Based on Availability)
- 11.2.13 UPM Global
- 11.2.13.1. Overview
- 11.2.13.2. Products
- 11.2.13.3. SWOT Analysis
- 11.2.13.4. Recent Developments
- 11.2.13.5. Financials (Based on Availability)
- 11.2.14 Inovar Packaging Group
- 11.2.14.1. Overview
- 11.2.14.2. Products
- 11.2.14.3. SWOT Analysis
- 11.2.14.4. Recent Developments
- 11.2.14.5. Financials (Based on Availability)
- 11.2.15 Smith and McLaurin
- 11.2.15.1. Overview
- 11.2.15.2. Products
- 11.2.15.3. SWOT Analysis
- 11.2.15.4. Recent Developments
- 11.2.15.5. Financials (Based on Availability)
- 11.2.16 QLM Group
- 11.2.16.1. Overview
- 11.2.16.2. Products
- 11.2.16.3. SWOT Analysis
- 11.2.16.4. Recent Developments
- 11.2.16.5. Financials (Based on Availability)
- 11.2.17 Labelys
- 11.2.17.1. Overview
- 11.2.17.2. Products
- 11.2.17.3. SWOT Analysis
- 11.2.17.4. Recent Developments
- 11.2.17.5. Financials (Based on Availability)
- 11.2.18 Prakash Labels
- 11.2.18.1. Overview
- 11.2.18.2. Products
- 11.2.18.3. SWOT Analysis
- 11.2.18.4. Recent Developments
- 11.2.18.5. Financials (Based on Availability)
- 11.2.19 Autajon Group
- 11.2.19.1. Overview
- 11.2.19.2. Products
- 11.2.19.3. SWOT Analysis
- 11.2.19.4. Recent Developments
- 11.2.19.5. Financials (Based on Availability)
- 11.2.20 G3 Enterprises
- 11.2.20.1. Overview
- 11.2.20.2. Products
- 11.2.20.3. SWOT Analysis
- 11.2.20.4. Recent Developments
- 11.2.20.5. Financials (Based on Availability)
- 11.2.21 ID Images
- 11.2.21.1. Overview
- 11.2.21.2. Products
- 11.2.21.3. SWOT Analysis
- 11.2.21.4. Recent Developments
- 11.2.21.5. Financials (Based on Availability)
- 11.2.22 Weber Packaging Solutions
- 11.2.22.1. Overview
- 11.2.22.2. Products
- 11.2.22.3. SWOT Analysis
- 11.2.22.4. Recent Developments
- 11.2.22.5. Financials (Based on Availability)
- 11.2.1 Avery Dennison
List of Figures
- Figure 1: Global Wine and Spirit Label Revenue Breakdown (million, %) by Region 2025 & 2033
- Figure 2: Global Wine and Spirit Label Volume Breakdown (K, %) by Region 2025 & 2033
- Figure 3: North America Wine and Spirit Label Revenue (million), by Application 2025 & 2033
- Figure 4: North America Wine and Spirit Label Volume (K), by Application 2025 & 2033
- Figure 5: North America Wine and Spirit Label Revenue Share (%), by Application 2025 & 2033
- Figure 6: North America Wine and Spirit Label Volume Share (%), by Application 2025 & 2033
- Figure 7: North America Wine and Spirit Label Revenue (million), by Types 2025 & 2033
- Figure 8: North America Wine and Spirit Label Volume (K), by Types 2025 & 2033
- Figure 9: North America Wine and Spirit Label Revenue Share (%), by Types 2025 & 2033
- Figure 10: North America Wine and Spirit Label Volume Share (%), by Types 2025 & 2033
- Figure 11: North America Wine and Spirit Label Revenue (million), by Country 2025 & 2033
- Figure 12: North America Wine and Spirit Label Volume (K), by Country 2025 & 2033
- Figure 13: North America Wine and Spirit Label Revenue Share (%), by Country 2025 & 2033
- Figure 14: North America Wine and Spirit Label Volume Share (%), by Country 2025 & 2033
- Figure 15: South America Wine and Spirit Label Revenue (million), by Application 2025 & 2033
- Figure 16: South America Wine and Spirit Label Volume (K), by Application 2025 & 2033
- Figure 17: South America Wine and Spirit Label Revenue Share (%), by Application 2025 & 2033
- Figure 18: South America Wine and Spirit Label Volume Share (%), by Application 2025 & 2033
- Figure 19: South America Wine and Spirit Label Revenue (million), by Types 2025 & 2033
- Figure 20: South America Wine and Spirit Label Volume (K), by Types 2025 & 2033
- Figure 21: South America Wine and Spirit Label Revenue Share (%), by Types 2025 & 2033
- Figure 22: South America Wine and Spirit Label Volume Share (%), by Types 2025 & 2033
- Figure 23: South America Wine and Spirit Label Revenue (million), by Country 2025 & 2033
- Figure 24: South America Wine and Spirit Label Volume (K), by Country 2025 & 2033
- Figure 25: South America Wine and Spirit Label Revenue Share (%), by Country 2025 & 2033
- Figure 26: South America Wine and Spirit Label Volume Share (%), by Country 2025 & 2033
- Figure 27: Europe Wine and Spirit Label Revenue (million), by Application 2025 & 2033
- Figure 28: Europe Wine and Spirit Label Volume (K), by Application 2025 & 2033
- Figure 29: Europe Wine and Spirit Label Revenue Share (%), by Application 2025 & 2033
- Figure 30: Europe Wine and Spirit Label Volume Share (%), by Application 2025 & 2033
- Figure 31: Europe Wine and Spirit Label Revenue (million), by Types 2025 & 2033
- Figure 32: Europe Wine and Spirit Label Volume (K), by Types 2025 & 2033
- Figure 33: Europe Wine and Spirit Label Revenue Share (%), by Types 2025 & 2033
- Figure 34: Europe Wine and Spirit Label Volume Share (%), by Types 2025 & 2033
- Figure 35: Europe Wine and Spirit Label Revenue (million), by Country 2025 & 2033
- Figure 36: Europe Wine and Spirit Label Volume (K), by Country 2025 & 2033
- Figure 37: Europe Wine and Spirit Label Revenue Share (%), by Country 2025 & 2033
- Figure 38: Europe Wine and Spirit Label Volume Share (%), by Country 2025 & 2033
- Figure 39: Middle East & Africa Wine and Spirit Label Revenue (million), by Application 2025 & 2033
- Figure 40: Middle East & Africa Wine and Spirit Label Volume (K), by Application 2025 & 2033
- Figure 41: Middle East & Africa Wine and Spirit Label Revenue Share (%), by Application 2025 & 2033
- Figure 42: Middle East & Africa Wine and Spirit Label Volume Share (%), by Application 2025 & 2033
- Figure 43: Middle East & Africa Wine and Spirit Label Revenue (million), by Types 2025 & 2033
- Figure 44: Middle East & Africa Wine and Spirit Label Volume (K), by Types 2025 & 2033
- Figure 45: Middle East & Africa Wine and Spirit Label Revenue Share (%), by Types 2025 & 2033
- Figure 46: Middle East & Africa Wine and Spirit Label Volume Share (%), by Types 2025 & 2033
- Figure 47: Middle East & Africa Wine and Spirit Label Revenue (million), by Country 2025 & 2033
- Figure 48: Middle East & Africa Wine and Spirit Label Volume (K), by Country 2025 & 2033
- Figure 49: Middle East & Africa Wine and Spirit Label Revenue Share (%), by Country 2025 & 2033
- Figure 50: Middle East & Africa Wine and Spirit Label Volume Share (%), by Country 2025 & 2033
- Figure 51: Asia Pacific Wine and Spirit Label Revenue (million), by Application 2025 & 2033
- Figure 52: Asia Pacific Wine and Spirit Label Volume (K), by Application 2025 & 2033
- Figure 53: Asia Pacific Wine and Spirit Label Revenue Share (%), by Application 2025 & 2033
- Figure 54: Asia Pacific Wine and Spirit Label Volume Share (%), by Application 2025 & 2033
- Figure 55: Asia Pacific Wine and Spirit Label Revenue (million), by Types 2025 & 2033
- Figure 56: Asia Pacific Wine and Spirit Label Volume (K), by Types 2025 & 2033
- Figure 57: Asia Pacific Wine and Spirit Label Revenue Share (%), by Types 2025 & 2033
- Figure 58: Asia Pacific Wine and Spirit Label Volume Share (%), by Types 2025 & 2033
- Figure 59: Asia Pacific Wine and Spirit Label Revenue (million), by Country 2025 & 2033
- Figure 60: Asia Pacific Wine and Spirit Label Volume (K), by Country 2025 & 2033
- Figure 61: Asia Pacific Wine and Spirit Label Revenue Share (%), by Country 2025 & 2033
- Figure 62: Asia Pacific Wine and Spirit Label Volume Share (%), by Country 2025 & 2033
List of Tables
- Table 1: Global Wine and Spirit Label Revenue million Forecast, by Application 2020 & 2033
- Table 2: Global Wine and Spirit Label Volume K Forecast, by Application 2020 & 2033
- Table 3: Global Wine and Spirit Label Revenue million Forecast, by Types 2020 & 2033
- Table 4: Global Wine and Spirit Label Volume K Forecast, by Types 2020 & 2033
- Table 5: Global Wine and Spirit Label Revenue million Forecast, by Region 2020 & 2033
- Table 6: Global Wine and Spirit Label Volume K Forecast, by Region 2020 & 2033
- Table 7: Global Wine and Spirit Label Revenue million Forecast, by Application 2020 & 2033
- Table 8: Global Wine and Spirit Label Volume K Forecast, by Application 2020 & 2033
- Table 9: Global Wine and Spirit Label Revenue million Forecast, by Types 2020 & 2033
- Table 10: Global Wine and Spirit Label Volume K Forecast, by Types 2020 & 2033
- Table 11: Global Wine and Spirit Label Revenue million Forecast, by Country 2020 & 2033
- Table 12: Global Wine and Spirit Label Volume K Forecast, by Country 2020 & 2033
- Table 13: United States Wine and Spirit Label Revenue (million) Forecast, by Application 2020 & 2033
- Table 14: United States Wine and Spirit Label Volume (K) Forecast, by Application 2020 & 2033
- Table 15: Canada Wine and Spirit Label Revenue (million) Forecast, by Application 2020 & 2033
- Table 16: Canada Wine and Spirit Label Volume (K) Forecast, by Application 2020 & 2033
- Table 17: Mexico Wine and Spirit Label Revenue (million) Forecast, by Application 2020 & 2033
- Table 18: Mexico Wine and Spirit Label Volume (K) Forecast, by Application 2020 & 2033
- Table 19: Global Wine and Spirit Label Revenue million Forecast, by Application 2020 & 2033
- Table 20: Global Wine and Spirit Label Volume K Forecast, by Application 2020 & 2033
- Table 21: Global Wine and Spirit Label Revenue million Forecast, by Types 2020 & 2033
- Table 22: Global Wine and Spirit Label Volume K Forecast, by Types 2020 & 2033
- Table 23: Global Wine and Spirit Label Revenue million Forecast, by Country 2020 & 2033
- Table 24: Global Wine and Spirit Label Volume K Forecast, by Country 2020 & 2033
- Table 25: Brazil Wine and Spirit Label Revenue (million) Forecast, by Application 2020 & 2033
- Table 26: Brazil Wine and Spirit Label Volume (K) Forecast, by Application 2020 & 2033
- Table 27: Argentina Wine and Spirit Label Revenue (million) Forecast, by Application 2020 & 2033
- Table 28: Argentina Wine and Spirit Label Volume (K) Forecast, by Application 2020 & 2033
- Table 29: Rest of South America Wine and Spirit Label Revenue (million) Forecast, by Application 2020 & 2033
- Table 30: Rest of South America Wine and Spirit Label Volume (K) Forecast, by Application 2020 & 2033
- Table 31: Global Wine and Spirit Label Revenue million Forecast, by Application 2020 & 2033
- Table 32: Global Wine and Spirit Label Volume K Forecast, by Application 2020 & 2033
- Table 33: Global Wine and Spirit Label Revenue million Forecast, by Types 2020 & 2033
- Table 34: Global Wine and Spirit Label Volume K Forecast, by Types 2020 & 2033
- Table 35: Global Wine and Spirit Label Revenue million Forecast, by Country 2020 & 2033
- Table 36: Global Wine and Spirit Label Volume K Forecast, by Country 2020 & 2033
- Table 37: United Kingdom Wine and Spirit Label Revenue (million) Forecast, by Application 2020 & 2033
- Table 38: United Kingdom Wine and Spirit Label Volume (K) Forecast, by Application 2020 & 2033
- Table 39: Germany Wine and Spirit Label Revenue (million) Forecast, by Application 2020 & 2033
- Table 40: Germany Wine and Spirit Label Volume (K) Forecast, by Application 2020 & 2033
- Table 41: France Wine and Spirit Label Revenue (million) Forecast, by Application 2020 & 2033
- Table 42: France Wine and Spirit Label Volume (K) Forecast, by Application 2020 & 2033
- Table 43: Italy Wine and Spirit Label Revenue (million) Forecast, by Application 2020 & 2033
- Table 44: Italy Wine and Spirit Label Volume (K) Forecast, by Application 2020 & 2033
- Table 45: Spain Wine and Spirit Label Revenue (million) Forecast, by Application 2020 & 2033
- Table 46: Spain Wine and Spirit Label Volume (K) Forecast, by Application 2020 & 2033
- Table 47: Russia Wine and Spirit Label Revenue (million) Forecast, by Application 2020 & 2033
- Table 48: Russia Wine and Spirit Label Volume (K) Forecast, by Application 2020 & 2033
- Table 49: Benelux Wine and Spirit Label Revenue (million) Forecast, by Application 2020 & 2033
- Table 50: Benelux Wine and Spirit Label Volume (K) Forecast, by Application 2020 & 2033
- Table 51: Nordics Wine and Spirit Label Revenue (million) Forecast, by Application 2020 & 2033
- Table 52: Nordics Wine and Spirit Label Volume (K) Forecast, by Application 2020 & 2033
- Table 53: Rest of Europe Wine and Spirit Label Revenue (million) Forecast, by Application 2020 & 2033
- Table 54: Rest of Europe Wine and Spirit Label Volume (K) Forecast, by Application 2020 & 2033
- Table 55: Global Wine and Spirit Label Revenue million Forecast, by Application 2020 & 2033
- Table 56: Global Wine and Spirit Label Volume K Forecast, by Application 2020 & 2033
- Table 57: Global Wine and Spirit Label Revenue million Forecast, by Types 2020 & 2033
- Table 58: Global Wine and Spirit Label Volume K Forecast, by Types 2020 & 2033
- Table 59: Global Wine and Spirit Label Revenue million Forecast, by Country 2020 & 2033
- Table 60: Global Wine and Spirit Label Volume K Forecast, by Country 2020 & 2033
- Table 61: Turkey Wine and Spirit Label Revenue (million) Forecast, by Application 2020 & 2033
- Table 62: Turkey Wine and Spirit Label Volume (K) Forecast, by Application 2020 & 2033
- Table 63: Israel Wine and Spirit Label Revenue (million) Forecast, by Application 2020 & 2033
- Table 64: Israel Wine and Spirit Label Volume (K) Forecast, by Application 2020 & 2033
- Table 65: GCC Wine and Spirit Label Revenue (million) Forecast, by Application 2020 & 2033
- Table 66: GCC Wine and Spirit Label Volume (K) Forecast, by Application 2020 & 2033
- Table 67: North Africa Wine and Spirit Label Revenue (million) Forecast, by Application 2020 & 2033
- Table 68: North Africa Wine and Spirit Label Volume (K) Forecast, by Application 2020 & 2033
- Table 69: South Africa Wine and Spirit Label Revenue (million) Forecast, by Application 2020 & 2033
- Table 70: South Africa Wine and Spirit Label Volume (K) Forecast, by Application 2020 & 2033
- Table 71: Rest of Middle East & Africa Wine and Spirit Label Revenue (million) Forecast, by Application 2020 & 2033
- Table 72: Rest of Middle East & Africa Wine and Spirit Label Volume (K) Forecast, by Application 2020 & 2033
- Table 73: Global Wine and Spirit Label Revenue million Forecast, by Application 2020 & 2033
- Table 74: Global Wine and Spirit Label Volume K Forecast, by Application 2020 & 2033
- Table 75: Global Wine and Spirit Label Revenue million Forecast, by Types 2020 & 2033
- Table 76: Global Wine and Spirit Label Volume K Forecast, by Types 2020 & 2033
- Table 77: Global Wine and Spirit Label Revenue million Forecast, by Country 2020 & 2033
- Table 78: Global Wine and Spirit Label Volume K Forecast, by Country 2020 & 2033
- Table 79: China Wine and Spirit Label Revenue (million) Forecast, by Application 2020 & 2033
- Table 80: China Wine and Spirit Label Volume (K) Forecast, by Application 2020 & 2033
- Table 81: India Wine and Spirit Label Revenue (million) Forecast, by Application 2020 & 2033
- Table 82: India Wine and Spirit Label Volume (K) Forecast, by Application 2020 & 2033
- Table 83: Japan Wine and Spirit Label Revenue (million) Forecast, by Application 2020 & 2033
- Table 84: Japan Wine and Spirit Label Volume (K) Forecast, by Application 2020 & 2033
- Table 85: South Korea Wine and Spirit Label Revenue (million) Forecast, by Application 2020 & 2033
- Table 86: South Korea Wine and Spirit Label Volume (K) Forecast, by Application 2020 & 2033
- Table 87: ASEAN Wine and Spirit Label Revenue (million) Forecast, by Application 2020 & 2033
- Table 88: ASEAN Wine and Spirit Label Volume (K) Forecast, by Application 2020 & 2033
- Table 89: Oceania Wine and Spirit Label Revenue (million) Forecast, by Application 2020 & 2033
- Table 90: Oceania Wine and Spirit Label Volume (K) Forecast, by Application 2020 & 2033
- Table 91: Rest of Asia Pacific Wine and Spirit Label Revenue (million) Forecast, by Application 2020 & 2033
- Table 92: Rest of Asia Pacific Wine and Spirit Label Volume (K) Forecast, by Application 2020 & 2033
Frequently Asked Questions
1. What is the projected Compound Annual Growth Rate (CAGR) of the Wine and Spirit Label?
The projected CAGR is approximately 4.6%.
2. Which companies are prominent players in the Wine and Spirit Label?
Key companies in the market include Avery Dennison, Asteria Group, Resource Label Group, Amcor, CCL Industries, LINTEC, Berry Global, Cenveo, Multi-Color Corporation, Klckner Pentaplast, Reflex Group, Ultra, UPM Global, Inovar Packaging Group, Smith and McLaurin, QLM Group, Labelys, Prakash Labels, Autajon Group, G3 Enterprises, ID Images, Weber Packaging Solutions.
3. What are the main segments of the Wine and Spirit Label?
The market segments include Application, Types.
4. Can you provide details about the market size?
The market size is estimated to be USD 3790 million as of 2022.
5. What are some drivers contributing to market growth?
N/A
6. What are the notable trends driving market growth?
N/A
7. Are there any restraints impacting market growth?
N/A
8. Can you provide examples of recent developments in the market?
N/A
9. What pricing options are available for accessing the report?
Pricing options include single-user, multi-user, and enterprise licenses priced at USD 4350.00, USD 6525.00, and USD 8700.00 respectively.
10. Is the market size provided in terms of value or volume?
The market size is provided in terms of value, measured in million and volume, measured in K.
11. Are there any specific market keywords associated with the report?
Yes, the market keyword associated with the report is "Wine and Spirit Label," which aids in identifying and referencing the specific market segment covered.
12. How do I determine which pricing option suits my needs best?
The pricing options vary based on user requirements and access needs. Individual users may opt for single-user licenses, while businesses requiring broader access may choose multi-user or enterprise licenses for cost-effective access to the report.
13. Are there any additional resources or data provided in the Wine and Spirit Label report?
While the report offers comprehensive insights, it's advisable to review the specific contents or supplementary materials provided to ascertain if additional resources or data are available.
14. How can I stay updated on further developments or reports in the Wine and Spirit Label?
To stay informed about further developments, trends, and reports in the Wine and Spirit Label, consider subscribing to industry newsletters, following relevant companies and organizations, or regularly checking reputable industry news sources and publications.
Methodology
Step 1 - Identification of Relevant Samples Size from Population Database


Step 2 - Approaches for Defining Global Market Size (Value, Volume* & Price*)

Note*: In applicable scenarios
Step 3 - Data Sources
Primary Research
- Web Analytics
- Survey Reports
- Research Institute
- Latest Research Reports
- Opinion Leaders
Secondary Research
- Annual Reports
- White Paper
- Latest Press Release
- Industry Association
- Paid Database
- Investor Presentations

Step 4 - Data Triangulation
Involves using different sources of information in order to increase the validity of a study
These sources are likely to be stakeholders in a program - participants, other researchers, program staff, other community members, and so on.
Then we put all data in single framework & apply various statistical tools to find out the dynamic on the market.
During the analysis stage, feedback from the stakeholder groups would be compared to determine areas of agreement as well as areas of divergence