

Key Insights
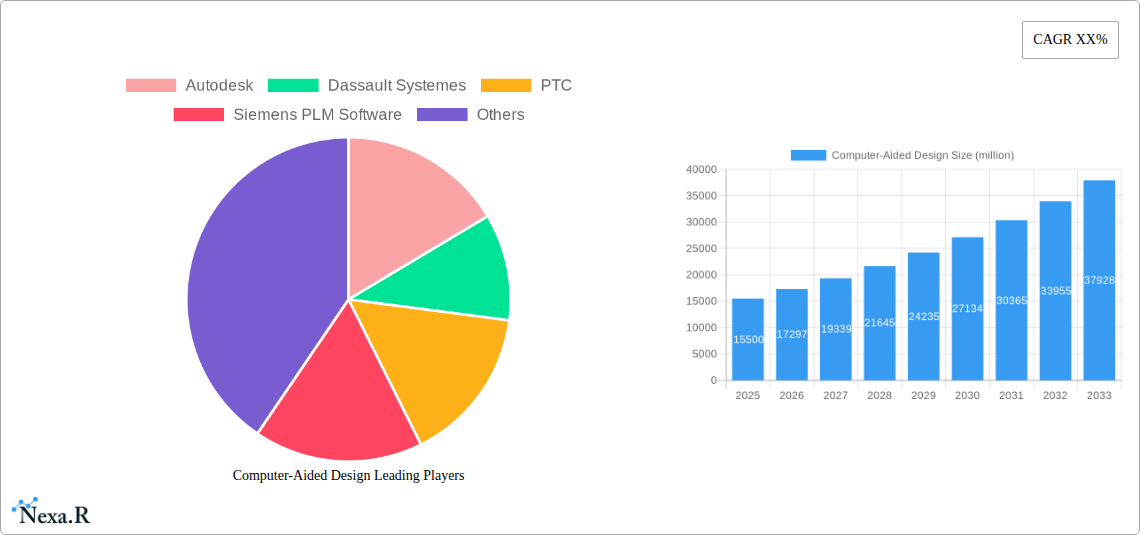
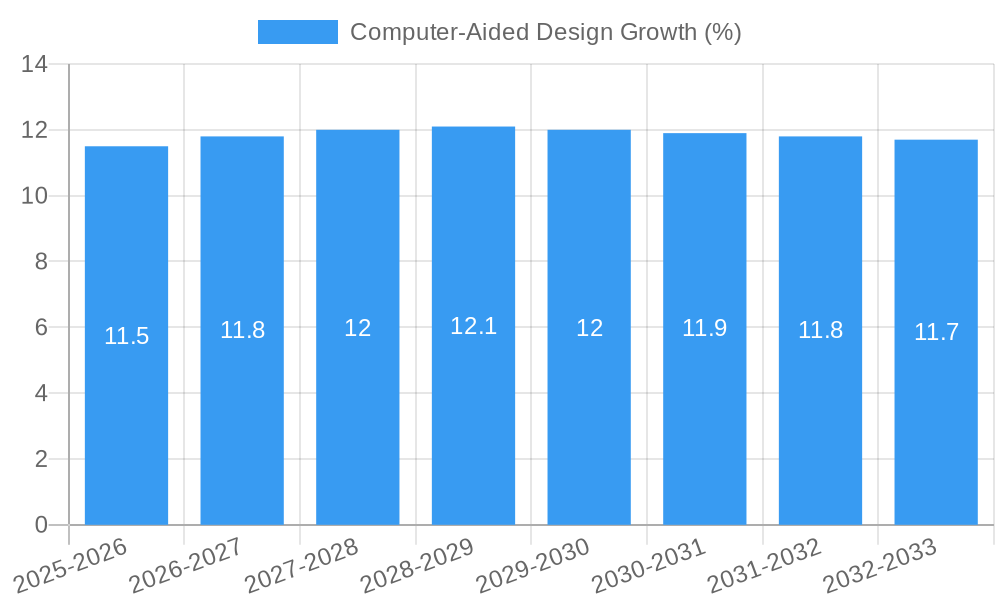
The global Computer-Aided Design (CAD) market is poised for significant expansion, projected to reach an estimated market size of $15,500 million in 2025. This growth is fueled by a robust Compound Annual Growth Rate (CAGR) of 11.5%, driving the market to an estimated $32,100 million by 2033. The burgeoning demand for sophisticated design and simulation tools across various industries is a primary catalyst. The Automotive Industry, a dominant force, leverages CAD for everything from initial concept sketches to complex manufacturing simulations, leading to enhanced product development cycles and improved vehicle performance. Similarly, the Aerospace and Defense Industry relies heavily on CAD for intricate aircraft and defense system design, where precision and innovation are paramount. The Industrial Machinery Industry is also a key beneficiary, utilizing CAD to optimize machine functionality, reduce production costs, and accelerate time-to-market for new equipment.
Further propelling market growth are key trends such as the increasing adoption of cloud-based CAD solutions, which offer enhanced collaboration, accessibility, and scalability. The integration of Artificial Intelligence (AI) and Machine Learning (ML) into CAD software is revolutionizing design processes, enabling generative design, automated drafting, and predictive analysis. Furthermore, the rising popularity of 3D printing and additive manufacturing directly correlates with the demand for advanced CAD tools capable of producing complex, optimized designs for these technologies. While the market experiences strong tailwinds, potential restraints include the high initial investment costs for sophisticated CAD software and hardware, and the ongoing need for skilled professionals to effectively utilize these complex tools. The market is segmented into ECAD (Electronic CAD) and MCAD (Mechanical CAD), with MCAD currently holding a larger share, though ECAD is experiencing rapid growth due to the increasing complexity of electronic systems.
Unlocking Innovation: A Comprehensive Report on the Global Computer-Aided Design (CAD) Market
This in-depth report provides an unparalleled analysis of the global Computer-Aided Design (CAD) market, a critical enabler of product development and innovation across diverse industries. Delving into the intricacies of ECAD and MCAD segments, and their profound impact on sectors like Automotive, Aerospace and Defense, Industrial Machinery, and Electrical & Electronics, this study offers actionable insights for stakeholders. Covering the historical period from 2019 to 2024 and projecting growth through 2033, with a base year of 2025, this report is your definitive guide to the evolving CAD landscape.
Computer-Aided Design Market Dynamics & Structure
The global Computer-Aided Design (CAD) market is characterized by a moderately concentrated landscape, with key players like Autodesk, Dassault Systemes, PTC, and Siemens PLM Software holding significant sway. Technological innovation serves as the primary driver, fueled by advancements in artificial intelligence (AI), cloud-based solutions, and augmented/virtual reality (AR/VR) integration, which are continuously enhancing design workflows and collaboration. Regulatory frameworks, particularly those concerning intellectual property and data security, influence adoption patterns and software development. Competitive product substitutes are emerging in the form of advanced simulation tools and generative design algorithms, pushing traditional CAD functionalities to evolve. End-user demographics are shifting towards a younger, tech-savvy workforce increasingly demanding intuitive, collaborative, and cloud-enabled CAD solutions. Mergers and acquisitions (M&A) remain a strategic tool for market consolidation and capability expansion, with an average of 3-5 significant deals observed annually within the historical period.
- Market Concentration: Dominated by a few key players, but with increasing opportunities for specialized vendors.
- Innovation Drivers: AI-powered design, cloud-native platforms, real-time collaboration, and AR/VR integration.
- Regulatory Influence: Data privacy, cybersecurity standards, and industry-specific compliance requirements.
- Competitive Substitutes: Advanced simulation software, digital twin technologies, and no-code/low-code design platforms.
- End-User Trends: Demand for user-friendly interfaces, mobile accessibility, and integrated ecosystems.
- M&A Activity: Strategic acquisitions for technology integration, market reach expansion, and talent acquisition.
Computer-Aided Design Growth Trends & Insights
The global Computer-Aided Design (CAD) market is poised for robust expansion, projected to reach an impressive $15,500 million units by 2033, with a Compound Annual Growth Rate (CAGR) of approximately 8.5% during the forecast period of 2025-2033. The base year, 2025, sees the market valued at an estimated $9,800 million units, underscoring a significant upward trajectory from historical data. This growth is intrinsically linked to the accelerating adoption rates across nascent industries and the deepening integration of CAD within existing manufacturing paradigms. The historical period (2019-2024) witnessed a steady ascent, fueled by the digital transformation initiatives across key sectors.
Technological disruptions are at the forefront of this evolution. The integration of Artificial Intelligence (AI) within CAD software is revolutionizing design processes, enabling generative design, design optimization, and automated error detection. Cloud-based CAD solutions are gaining immense traction, offering enhanced collaboration, accessibility from any device, and reduced IT infrastructure costs. This shift from on-premise installations to subscription-based cloud services is a major market differentiator. Furthermore, the proliferation of the Internet of Things (IoT) is driving the need for more sophisticated product design capabilities, as connected devices require intricate hardware and software integration, often managed through advanced ECAD and MCAD tools.
Consumer behavior is also playing a pivotal role. There's an increasing demand for highly customized and personalized products, necessitating flexible and responsive design processes that CAD facilitates. The rise of additive manufacturing (3D printing) has also created a symbiotic relationship with CAD, as complex geometries previously impossible to manufacture can now be readily designed and produced. This has opened up new avenues for innovation in prototyping and small-batch production. The growing emphasis on sustainability and product lifecycle management (PLM) further propels CAD adoption, as designers can simulate environmental impacts and optimize materials usage from the initial design stages. The market penetration of advanced CAD functionalities is expected to deepen, moving beyond basic design to encompass simulation, analysis, and manufacturing preparation within a single integrated environment. The estimated market size in 2025 stands at $9,800 million units, with projections indicating a substantial increase due to these powerful growth drivers.
Dominant Regions, Countries, or Segments in Computer-Aided Design
The Automotive Industry stands as the most dominant application segment within the global Computer-Aided Design (CAD) market, consistently driving significant demand for both ECAD and MCAD solutions. This dominance is attributed to the industry's relentless pursuit of innovation, stringent safety regulations, and the ongoing transition towards electric and autonomous vehicles. The sheer complexity of modern vehicle design, encompassing intricate mechanical components, advanced electronics, sophisticated infotainment systems, and aerodynamic optimization, necessitates the comprehensive capabilities offered by CAD software. The market share for CAD in the automotive sector is estimated to be around 28% of the total application market.
Several factors contribute to this leadership. Firstly, substantial investments in research and development within the automotive sector necessitate cutting-edge design tools. Companies are leveraging CAD for everything from conceptualizing new car models and designing powertrains to simulating crashworthiness and optimizing fuel efficiency. Secondly, the growing adoption of Advanced Driver-Assistance Systems (ADAS) and the burgeoning electric vehicle (EV) market are introducing new design challenges and opportunities, particularly in battery management systems, thermal management, and integrated electronic architectures, further boosting the demand for sophisticated ECAD.
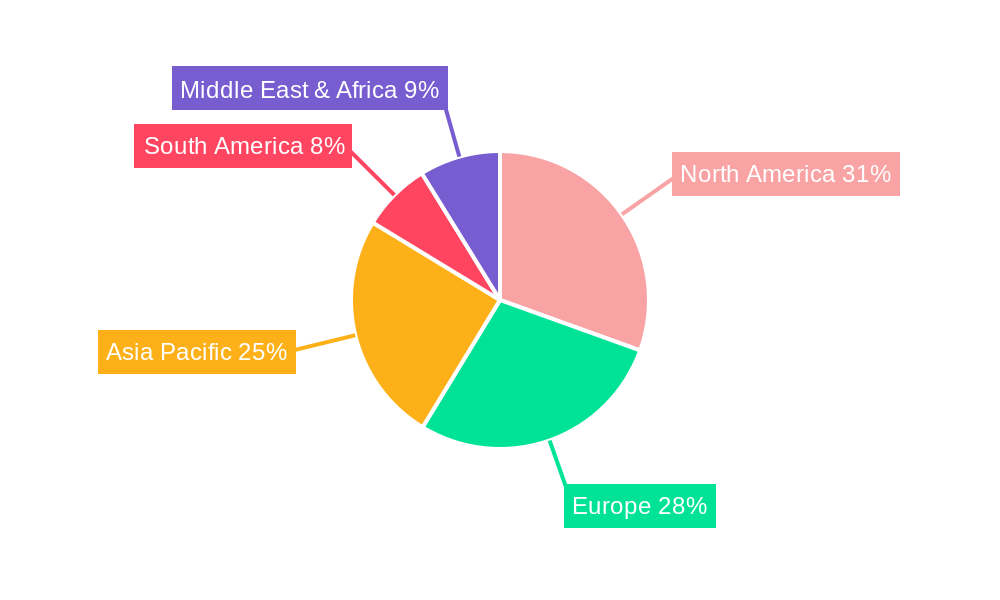
Economically, the automotive industry is a major global contributor, with robust production volumes and a vast supply chain that relies heavily on CAD for component design and manufacturing. Government incentives and stricter emission standards worldwide are also pushing automakers to innovate faster, leading to increased CAD software investment. Geographically, regions with strong automotive manufacturing hubs, such as North America, Europe, and East Asia, are primary consumers of CAD solutions in this segment. Countries like Germany, the United States, Japan, and China are leading the charge in adopting advanced CAD technologies to maintain their competitive edge.
The MCAD segment within automotive is crucial for designing chassis, engines, interiors, and body structures, while ECAD is indispensable for the intricate electrical systems, sensor integration, and power electronics. The market for CAD in the automotive industry is not just about design but also extends to simulation, virtual prototyping, and digital twins, enabling manufacturers to reduce physical prototyping costs and accelerate time-to-market. The growth potential remains exceptionally high as the industry navigates the complex landscape of electrification, connectivity, and autonomous driving, all of which are fundamentally CAD-driven innovations. The total estimated market size for CAD in the automotive industry alone is projected to reach over $4,300 million units by 2033.
Computer-Aided Design Product Landscape
The CAD product landscape is characterized by a relentless drive towards integrated, intelligent, and collaborative solutions. Leading software offerings, such as those from Autodesk, Dassault Systemes, and Siemens PLM Software, are increasingly incorporating AI-driven generative design capabilities, allowing for rapid exploration of optimal design solutions based on specified parameters. Cloud-native platforms are becoming the norm, enabling real-time collaboration among globally distributed teams and seamless data management throughout the product lifecycle. Advanced simulation and analysis tools are deeply embedded within CAD environments, reducing the need for separate software packages and accelerating the design validation process. Furthermore, the integration of AR/VR technologies is transforming product visualization and design reviews, allowing for more immersive and intuitive interactions with digital prototypes. These advancements are not just about creating 3D models but about creating intelligent digital assets that can inform manufacturing, service, and end-of-life processes.
Key Drivers, Barriers & Challenges in Computer-Aided Design
Key Drivers:
- Technological Advancements: The continuous evolution of AI, cloud computing, IoT, and AR/VR is significantly enhancing CAD capabilities, driving adoption.
- Industry 4.0 & Digital Transformation: The widespread adoption of smart manufacturing and digital transformation initiatives necessitates sophisticated design tools.
- Product Complexity & Customization: Increasing demand for intricate and personalized products requires advanced design and simulation capabilities.
- Globalization & Distributed Teams: Cloud-based CAD facilitates seamless collaboration among geographically dispersed engineering and design teams.
- Sustainability & Lifecycle Management: Growing focus on eco-friendly design and product longevity drives the use of CAD for simulation and optimization.
Barriers & Challenges:
- High Initial Investment: The cost of advanced CAD software licenses and accompanying hardware can be a significant barrier for small and medium-sized enterprises (SMEs).
- Steep Learning Curve & Skill Gap: Mastering complex CAD software requires specialized training and skilled personnel, leading to a talent gap.
- Integration Complexity: Integrating CAD systems with existing enterprise resource planning (ERP) and product lifecycle management (PLM) systems can be challenging and costly.
- Cybersecurity Concerns: Cloud-based solutions raise concerns about data security and intellectual property protection, necessitating robust cybersecurity measures.
- Rapid Technological Obsolescence: The fast pace of technological change can lead to rapid obsolescence of software and hardware, requiring continuous investment.
- Supply Chain Disruptions (Indirect Impact): While not a direct CAD barrier, disruptions in the supply of hardware components necessary for running CAD software can indirectly impact its accessibility and deployment.
Emerging Opportunities in Computer-Aided Design
Emerging opportunities in the CAD market are ripe for exploitation. The burgeoning field of digital twins, which are virtual replicas of physical assets, offers immense potential for CAD to play a central role in creating, maintaining, and leveraging these comprehensive digital models for predictive maintenance, performance optimization, and scenario planning. The expansion of additive manufacturing (3D printing) continues to drive demand for CAD software capable of designing highly complex and optimized geometries that were previously impossible to produce. Furthermore, the integration of generative design and AI-powered optimization is moving beyond conceptualization to become a mainstream design methodology, creating a demand for more intelligent and automated design tools. The growing focus on sustainable design and circular economy principles presents an opportunity for CAD solutions that can effectively simulate material impact, optimize for recyclability, and manage product lifecycles efficiently.
Growth Accelerators in the Computer-Aided Design Industry
Several key catalysts are accelerating the growth of the Computer-Aided Design (CAD) industry. The continued digital transformation across all manufacturing sectors is a primary driver, pushing companies to invest in advanced design tools to enhance competitiveness. Technological breakthroughs in AI and machine learning are enabling more intelligent and automated design processes, making CAD more accessible and powerful. Strategic partnerships and acquisitions between CAD vendors and complementary technology providers, such as simulation software companies or cloud service providers, are expanding the integrated capabilities of CAD solutions. Furthermore, the increasing adoption of IoT and connected devices is creating a demand for more sophisticated product designs that can accommodate integrated electronics and sensors, directly benefiting CAD software providers. Market expansion strategies, including the development of industry-specific solutions and accessible subscription models, are also contributing to broader market penetration.
Key Players Shaping the Computer-Aided Design Market
- Autodesk
- Dassault Systemes
- PTC
- Siemens PLM Software
Notable Milestones in Computer-Aided Design Sector
- 2019: Autodesk launches Fusion 360 with expanded generative design capabilities and enhanced cloud collaboration features.
- 2020: Dassault Systemes acquires Medidata Solutions, bolstering its 3DEXPERIENCE platform's capabilities in life sciences, hinting at broader industry application of advanced design.
- 2021: PTC releases Creo 8, featuring significant enhancements in simulation, additive manufacturing, and user experience for mechanical design.
- 2022: Siemens PLM Software introduces next-generation Xcelerator portfolio enhancements, focusing on integrated simulation and digital twin technologies.
- 2023: Rise in cloud-native CAD adoption accelerates, with vendors focusing on subscription models and remote accessibility.
- 2024: Increased integration of AI and machine learning within core CAD functionalities becomes a standard offering across major platforms.
In-Depth Computer-Aided Design Market Outlook
The future of the Computer-Aided Design (CAD) market is exceptionally promising, driven by the relentless march of technological innovation and the ever-increasing demand for sophisticated product development. The ongoing integration of AI and machine learning will continue to transform design processes, making them more efficient, intelligent, and automated. Cloud-based solutions will further democratize access to powerful design tools, fostering greater collaboration and enabling scalability for businesses of all sizes. The expansion of digital twin technologies and the continued evolution of additive manufacturing present significant growth avenues, as CAD becomes even more integral to the entire product lifecycle, from ideation to end-of-life management. Strategic partnerships and a focus on user-centric design will be crucial for capitalizing on emerging opportunities and maintaining a competitive edge in this dynamic and vital market.
Computer-Aided Design Segmentation
-
1. Application
- 1.1. Automotive Industry
- 1.2. Aerospace and Defense Industry
- 1.3. Industrial Machinery Industry
- 1.4. Electrical and Electronics Industry
- 1.5. Others
-
2. Types
- 2.1. ECAD (Electronic CAD)
- 2.2. MCAD (Mechanical CAD)
Computer-Aided Design Segmentation By Geography
-
1. North America
- 1.1. United States
- 1.2. Canada
- 1.3. Mexico
-
2. South America
- 2.1. Brazil
- 2.2. Argentina
- 2.3. Rest of South America
-
3. Europe
- 3.1. United Kingdom
- 3.2. Germany
- 3.3. France
- 3.4. Italy
- 3.5. Spain
- 3.6. Russia
- 3.7. Benelux
- 3.8. Nordics
- 3.9. Rest of Europe
-
4. Middle East & Africa
- 4.1. Turkey
- 4.2. Israel
- 4.3. GCC
- 4.4. North Africa
- 4.5. South Africa
- 4.6. Rest of Middle East & Africa
-
5. Asia Pacific
- 5.1. China
- 5.2. India
- 5.3. Japan
- 5.4. South Korea
- 5.5. ASEAN
- 5.6. Oceania
- 5.7. Rest of Asia Pacific
Computer-Aided Design REPORT HIGHLIGHTS
| Aspects | Details |
|---|---|
| Study Period | 2019-2033 |
| Base Year | 2024 |
| Estimated Year | 2025 |
| Forecast Period | 2025-2033 |
| Historical Period | 2019-2024 |
| Growth Rate | CAGR of XX% from 2019-2033 |
| Segmentation |
|
Table of Contents
- 1. Introduction
- 1.1. Research Scope
- 1.2. Market Segmentation
- 1.3. Research Methodology
- 1.4. Definitions and Assumptions
- 2. Executive Summary
- 2.1. Introduction
- 3. Market Dynamics
- 3.1. Introduction
- 3.2. Market Drivers
- 3.3. Market Restrains
- 3.4. Market Trends
- 4. Market Factor Analysis
- 4.1. Porters Five Forces
- 4.2. Supply/Value Chain
- 4.3. PESTEL analysis
- 4.4. Market Entropy
- 4.5. Patent/Trademark Analysis
- 5. Global Computer-Aided Design Analysis, Insights and Forecast, 2019-2031
- 5.1. Market Analysis, Insights and Forecast - by Application
- 5.1.1. Automotive Industry
- 5.1.2. Aerospace and Defense Industry
- 5.1.3. Industrial Machinery Industry
- 5.1.4. Electrical and Electronics Industry
- 5.1.5. Others
- 5.2. Market Analysis, Insights and Forecast - by Types
- 5.2.1. ECAD (Electronic CAD)
- 5.2.2. MCAD (Mechanical CAD)
- 5.3. Market Analysis, Insights and Forecast - by Region
- 5.3.1. North America
- 5.3.2. South America
- 5.3.3. Europe
- 5.3.4. Middle East & Africa
- 5.3.5. Asia Pacific
- 5.1. Market Analysis, Insights and Forecast - by Application
- 6. North America Computer-Aided Design Analysis, Insights and Forecast, 2019-2031
- 6.1. Market Analysis, Insights and Forecast - by Application
- 6.1.1. Automotive Industry
- 6.1.2. Aerospace and Defense Industry
- 6.1.3. Industrial Machinery Industry
- 6.1.4. Electrical and Electronics Industry
- 6.1.5. Others
- 6.2. Market Analysis, Insights and Forecast - by Types
- 6.2.1. ECAD (Electronic CAD)
- 6.2.2. MCAD (Mechanical CAD)
- 6.1. Market Analysis, Insights and Forecast - by Application
- 7. South America Computer-Aided Design Analysis, Insights and Forecast, 2019-2031
- 7.1. Market Analysis, Insights and Forecast - by Application
- 7.1.1. Automotive Industry
- 7.1.2. Aerospace and Defense Industry
- 7.1.3. Industrial Machinery Industry
- 7.1.4. Electrical and Electronics Industry
- 7.1.5. Others
- 7.2. Market Analysis, Insights and Forecast - by Types
- 7.2.1. ECAD (Electronic CAD)
- 7.2.2. MCAD (Mechanical CAD)
- 7.1. Market Analysis, Insights and Forecast - by Application
- 8. Europe Computer-Aided Design Analysis, Insights and Forecast, 2019-2031
- 8.1. Market Analysis, Insights and Forecast - by Application
- 8.1.1. Automotive Industry
- 8.1.2. Aerospace and Defense Industry
- 8.1.3. Industrial Machinery Industry
- 8.1.4. Electrical and Electronics Industry
- 8.1.5. Others
- 8.2. Market Analysis, Insights and Forecast - by Types
- 8.2.1. ECAD (Electronic CAD)
- 8.2.2. MCAD (Mechanical CAD)
- 8.1. Market Analysis, Insights and Forecast - by Application
- 9. Middle East & Africa Computer-Aided Design Analysis, Insights and Forecast, 2019-2031
- 9.1. Market Analysis, Insights and Forecast - by Application
- 9.1.1. Automotive Industry
- 9.1.2. Aerospace and Defense Industry
- 9.1.3. Industrial Machinery Industry
- 9.1.4. Electrical and Electronics Industry
- 9.1.5. Others
- 9.2. Market Analysis, Insights and Forecast - by Types
- 9.2.1. ECAD (Electronic CAD)
- 9.2.2. MCAD (Mechanical CAD)
- 9.1. Market Analysis, Insights and Forecast - by Application
- 10. Asia Pacific Computer-Aided Design Analysis, Insights and Forecast, 2019-2031
- 10.1. Market Analysis, Insights and Forecast - by Application
- 10.1.1. Automotive Industry
- 10.1.2. Aerospace and Defense Industry
- 10.1.3. Industrial Machinery Industry
- 10.1.4. Electrical and Electronics Industry
- 10.1.5. Others
- 10.2. Market Analysis, Insights and Forecast - by Types
- 10.2.1. ECAD (Electronic CAD)
- 10.2.2. MCAD (Mechanical CAD)
- 10.1. Market Analysis, Insights and Forecast - by Application
- 11. Competitive Analysis
- 11.1. Global Market Share Analysis 2024
- 11.2. Company Profiles
- 11.2.1 Autodesk
- 11.2.1.1. Overview
- 11.2.1.2. Products
- 11.2.1.3. SWOT Analysis
- 11.2.1.4. Recent Developments
- 11.2.1.5. Financials (Based on Availability)
- 11.2.2 Dassault Systemes
- 11.2.2.1. Overview
- 11.2.2.2. Products
- 11.2.2.3. SWOT Analysis
- 11.2.2.4. Recent Developments
- 11.2.2.5. Financials (Based on Availability)
- 11.2.3 PTC
- 11.2.3.1. Overview
- 11.2.3.2. Products
- 11.2.3.3. SWOT Analysis
- 11.2.3.4. Recent Developments
- 11.2.3.5. Financials (Based on Availability)
- 11.2.4 Siemens PLM Software
- 11.2.4.1. Overview
- 11.2.4.2. Products
- 11.2.4.3. SWOT Analysis
- 11.2.4.4. Recent Developments
- 11.2.4.5. Financials (Based on Availability)
- 11.2.1 Autodesk
List of Figures
- Figure 1: Global Computer-Aided Design Revenue Breakdown (million, %) by Region 2024 & 2032
- Figure 2: North America Computer-Aided Design Revenue (million), by Application 2024 & 2032
- Figure 3: North America Computer-Aided Design Revenue Share (%), by Application 2024 & 2032
- Figure 4: North America Computer-Aided Design Revenue (million), by Types 2024 & 2032
- Figure 5: North America Computer-Aided Design Revenue Share (%), by Types 2024 & 2032
- Figure 6: North America Computer-Aided Design Revenue (million), by Country 2024 & 2032
- Figure 7: North America Computer-Aided Design Revenue Share (%), by Country 2024 & 2032
- Figure 8: South America Computer-Aided Design Revenue (million), by Application 2024 & 2032
- Figure 9: South America Computer-Aided Design Revenue Share (%), by Application 2024 & 2032
- Figure 10: South America Computer-Aided Design Revenue (million), by Types 2024 & 2032
- Figure 11: South America Computer-Aided Design Revenue Share (%), by Types 2024 & 2032
- Figure 12: South America Computer-Aided Design Revenue (million), by Country 2024 & 2032
- Figure 13: South America Computer-Aided Design Revenue Share (%), by Country 2024 & 2032
- Figure 14: Europe Computer-Aided Design Revenue (million), by Application 2024 & 2032
- Figure 15: Europe Computer-Aided Design Revenue Share (%), by Application 2024 & 2032
- Figure 16: Europe Computer-Aided Design Revenue (million), by Types 2024 & 2032
- Figure 17: Europe Computer-Aided Design Revenue Share (%), by Types 2024 & 2032
- Figure 18: Europe Computer-Aided Design Revenue (million), by Country 2024 & 2032
- Figure 19: Europe Computer-Aided Design Revenue Share (%), by Country 2024 & 2032
- Figure 20: Middle East & Africa Computer-Aided Design Revenue (million), by Application 2024 & 2032
- Figure 21: Middle East & Africa Computer-Aided Design Revenue Share (%), by Application 2024 & 2032
- Figure 22: Middle East & Africa Computer-Aided Design Revenue (million), by Types 2024 & 2032
- Figure 23: Middle East & Africa Computer-Aided Design Revenue Share (%), by Types 2024 & 2032
- Figure 24: Middle East & Africa Computer-Aided Design Revenue (million), by Country 2024 & 2032
- Figure 25: Middle East & Africa Computer-Aided Design Revenue Share (%), by Country 2024 & 2032
- Figure 26: Asia Pacific Computer-Aided Design Revenue (million), by Application 2024 & 2032
- Figure 27: Asia Pacific Computer-Aided Design Revenue Share (%), by Application 2024 & 2032
- Figure 28: Asia Pacific Computer-Aided Design Revenue (million), by Types 2024 & 2032
- Figure 29: Asia Pacific Computer-Aided Design Revenue Share (%), by Types 2024 & 2032
- Figure 30: Asia Pacific Computer-Aided Design Revenue (million), by Country 2024 & 2032
- Figure 31: Asia Pacific Computer-Aided Design Revenue Share (%), by Country 2024 & 2032
List of Tables
- Table 1: Global Computer-Aided Design Revenue million Forecast, by Region 2019 & 2032
- Table 2: Global Computer-Aided Design Revenue million Forecast, by Application 2019 & 2032
- Table 3: Global Computer-Aided Design Revenue million Forecast, by Types 2019 & 2032
- Table 4: Global Computer-Aided Design Revenue million Forecast, by Region 2019 & 2032
- Table 5: Global Computer-Aided Design Revenue million Forecast, by Application 2019 & 2032
- Table 6: Global Computer-Aided Design Revenue million Forecast, by Types 2019 & 2032
- Table 7: Global Computer-Aided Design Revenue million Forecast, by Country 2019 & 2032
- Table 8: United States Computer-Aided Design Revenue (million) Forecast, by Application 2019 & 2032
- Table 9: Canada Computer-Aided Design Revenue (million) Forecast, by Application 2019 & 2032
- Table 10: Mexico Computer-Aided Design Revenue (million) Forecast, by Application 2019 & 2032
- Table 11: Global Computer-Aided Design Revenue million Forecast, by Application 2019 & 2032
- Table 12: Global Computer-Aided Design Revenue million Forecast, by Types 2019 & 2032
- Table 13: Global Computer-Aided Design Revenue million Forecast, by Country 2019 & 2032
- Table 14: Brazil Computer-Aided Design Revenue (million) Forecast, by Application 2019 & 2032
- Table 15: Argentina Computer-Aided Design Revenue (million) Forecast, by Application 2019 & 2032
- Table 16: Rest of South America Computer-Aided Design Revenue (million) Forecast, by Application 2019 & 2032
- Table 17: Global Computer-Aided Design Revenue million Forecast, by Application 2019 & 2032
- Table 18: Global Computer-Aided Design Revenue million Forecast, by Types 2019 & 2032
- Table 19: Global Computer-Aided Design Revenue million Forecast, by Country 2019 & 2032
- Table 20: United Kingdom Computer-Aided Design Revenue (million) Forecast, by Application 2019 & 2032
- Table 21: Germany Computer-Aided Design Revenue (million) Forecast, by Application 2019 & 2032
- Table 22: France Computer-Aided Design Revenue (million) Forecast, by Application 2019 & 2032
- Table 23: Italy Computer-Aided Design Revenue (million) Forecast, by Application 2019 & 2032
- Table 24: Spain Computer-Aided Design Revenue (million) Forecast, by Application 2019 & 2032
- Table 25: Russia Computer-Aided Design Revenue (million) Forecast, by Application 2019 & 2032
- Table 26: Benelux Computer-Aided Design Revenue (million) Forecast, by Application 2019 & 2032
- Table 27: Nordics Computer-Aided Design Revenue (million) Forecast, by Application 2019 & 2032
- Table 28: Rest of Europe Computer-Aided Design Revenue (million) Forecast, by Application 2019 & 2032
- Table 29: Global Computer-Aided Design Revenue million Forecast, by Application 2019 & 2032
- Table 30: Global Computer-Aided Design Revenue million Forecast, by Types 2019 & 2032
- Table 31: Global Computer-Aided Design Revenue million Forecast, by Country 2019 & 2032
- Table 32: Turkey Computer-Aided Design Revenue (million) Forecast, by Application 2019 & 2032
- Table 33: Israel Computer-Aided Design Revenue (million) Forecast, by Application 2019 & 2032
- Table 34: GCC Computer-Aided Design Revenue (million) Forecast, by Application 2019 & 2032
- Table 35: North Africa Computer-Aided Design Revenue (million) Forecast, by Application 2019 & 2032
- Table 36: South Africa Computer-Aided Design Revenue (million) Forecast, by Application 2019 & 2032
- Table 37: Rest of Middle East & Africa Computer-Aided Design Revenue (million) Forecast, by Application 2019 & 2032
- Table 38: Global Computer-Aided Design Revenue million Forecast, by Application 2019 & 2032
- Table 39: Global Computer-Aided Design Revenue million Forecast, by Types 2019 & 2032
- Table 40: Global Computer-Aided Design Revenue million Forecast, by Country 2019 & 2032
- Table 41: China Computer-Aided Design Revenue (million) Forecast, by Application 2019 & 2032
- Table 42: India Computer-Aided Design Revenue (million) Forecast, by Application 2019 & 2032
- Table 43: Japan Computer-Aided Design Revenue (million) Forecast, by Application 2019 & 2032
- Table 44: South Korea Computer-Aided Design Revenue (million) Forecast, by Application 2019 & 2032
- Table 45: ASEAN Computer-Aided Design Revenue (million) Forecast, by Application 2019 & 2032
- Table 46: Oceania Computer-Aided Design Revenue (million) Forecast, by Application 2019 & 2032
- Table 47: Rest of Asia Pacific Computer-Aided Design Revenue (million) Forecast, by Application 2019 & 2032
Frequently Asked Questions
1. What is the projected Compound Annual Growth Rate (CAGR) of the Computer-Aided Design?
The projected CAGR is approximately XX%.
2. Which companies are prominent players in the Computer-Aided Design?
Key companies in the market include Autodesk, Dassault Systemes, PTC, Siemens PLM Software.
3. What are the main segments of the Computer-Aided Design?
The market segments include Application, Types.
4. Can you provide details about the market size?
The market size is estimated to be USD XXX million as of 2022.
5. What are some drivers contributing to market growth?
N/A
6. What are the notable trends driving market growth?
N/A
7. Are there any restraints impacting market growth?
N/A
8. Can you provide examples of recent developments in the market?
N/A
9. What pricing options are available for accessing the report?
Pricing options include single-user, multi-user, and enterprise licenses priced at USD 3350.00, USD 5025.00, and USD 6700.00 respectively.
10. Is the market size provided in terms of value or volume?
The market size is provided in terms of value, measured in million.
11. Are there any specific market keywords associated with the report?
Yes, the market keyword associated with the report is "Computer-Aided Design," which aids in identifying and referencing the specific market segment covered.
12. How do I determine which pricing option suits my needs best?
The pricing options vary based on user requirements and access needs. Individual users may opt for single-user licenses, while businesses requiring broader access may choose multi-user or enterprise licenses for cost-effective access to the report.
13. Are there any additional resources or data provided in the Computer-Aided Design report?
While the report offers comprehensive insights, it's advisable to review the specific contents or supplementary materials provided to ascertain if additional resources or data are available.
14. How can I stay updated on further developments or reports in the Computer-Aided Design?
To stay informed about further developments, trends, and reports in the Computer-Aided Design, consider subscribing to industry newsletters, following relevant companies and organizations, or regularly checking reputable industry news sources and publications.
Methodology
Step 1 - Identification of Relevant Samples Size from Population Database


Step 2 - Approaches for Defining Global Market Size (Value, Volume* & Price*)

Note*: In applicable scenarios
Step 3 - Data Sources
Primary Research
- Web Analytics
- Survey Reports
- Research Institute
- Latest Research Reports
- Opinion Leaders
Secondary Research
- Annual Reports
- White Paper
- Latest Press Release
- Industry Association
- Paid Database
- Investor Presentations

Step 4 - Data Triangulation
Involves using different sources of information in order to increase the validity of a study
These sources are likely to be stakeholders in a program - participants, other researchers, program staff, other community members, and so on.
Then we put all data in single framework & apply various statistical tools to find out the dynamic on the market.
During the analysis stage, feedback from the stakeholder groups would be compared to determine areas of agreement as well as areas of divergence
