

Key Insights
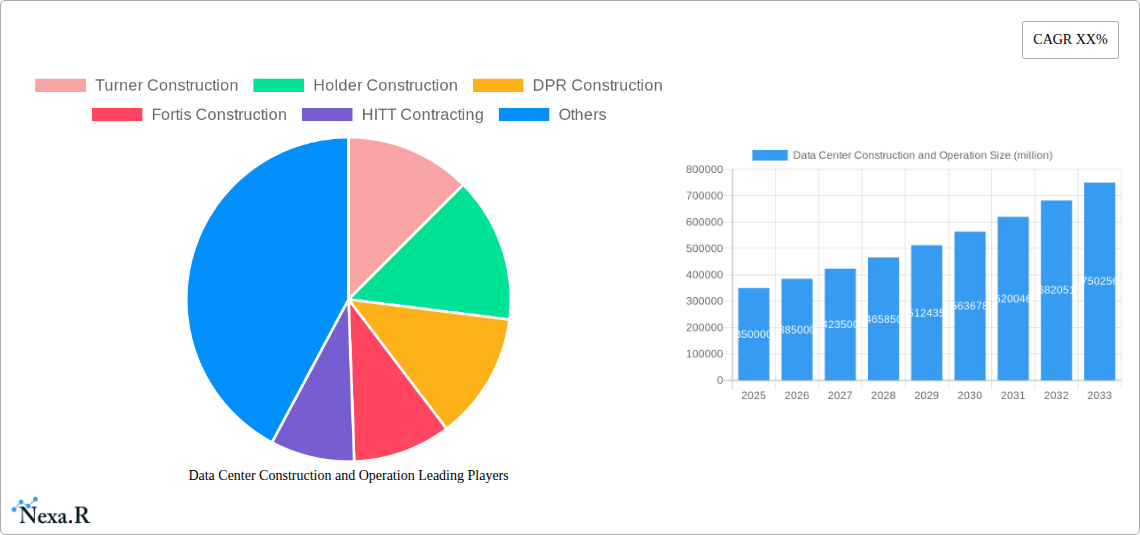
The global Data Center Construction and Operation market is poised for significant expansion, projected to reach an estimated USD 350 billion by 2025. This growth is fueled by the relentless digital transformation across industries, driving an insatiable demand for robust and scalable data infrastructure. Key applications such as Finance and IT are leading this charge, leveraging data centers for secure transaction processing, cloud computing, big data analytics, and artificial intelligence workloads. The telecommunications sector also plays a pivotal role, supporting the infrastructure for 5G deployment and ever-increasing data traffic. Government initiatives focused on digitalization and cybersecurity further bolster market expansion, alongside a growing "Other" segment encompassing emerging applications like IoT and edge computing. The market is characterized by two primary operational models: Self-Built and Self-Operated, favored by large enterprises for greater control and customization, and Cooperation and Joint Construction, offering a more flexible and cost-effective solution for smaller or rapidly scaling entities. This dual approach caters to diverse organizational needs and strategic priorities in data infrastructure development.
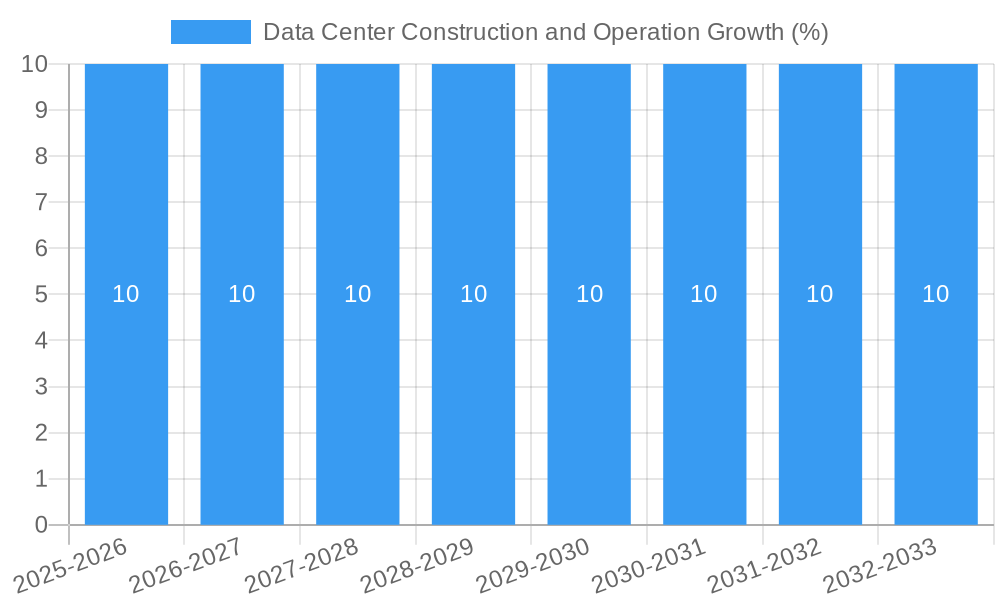
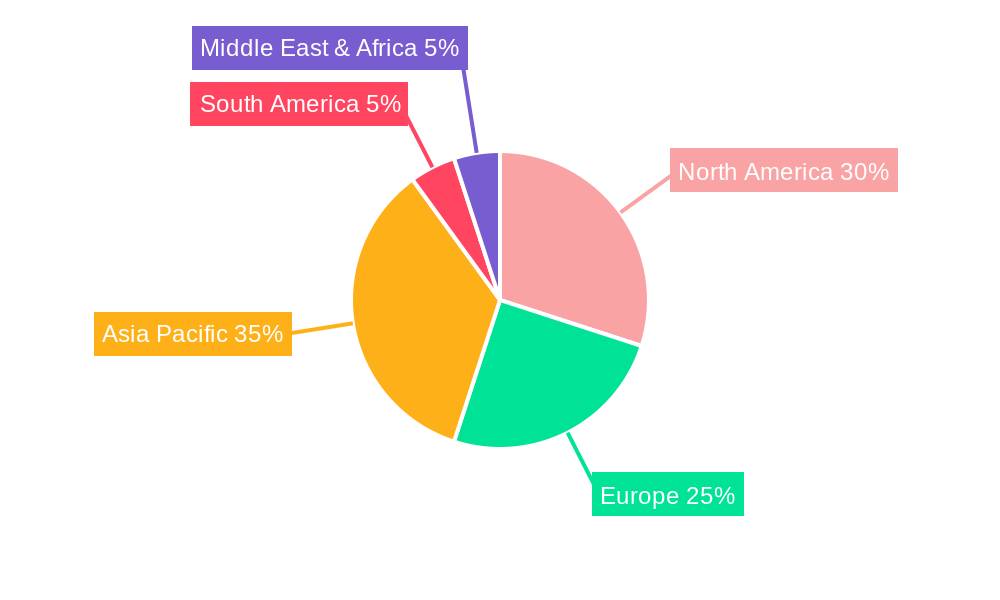
The market is expected to maintain a healthy Compound Annual Growth Rate (CAGR) of approximately 10% from 2025 to 2033, underscoring its sustained momentum. This growth is propelled by several key drivers, including the exponential increase in data generation, the rise of cloud computing and hybrid cloud strategies, and the ongoing need for enhanced data security and disaster recovery. Furthermore, the increasing adoption of AI and machine learning, which require substantial computational power and storage, is a significant accelerator. However, the market also faces certain restraints, such as the high capital expenditure required for building and maintaining data centers, rising energy costs and environmental concerns related to power consumption, and the complex regulatory landscape surrounding data privacy and sovereignty. Geographically, Asia Pacific, particularly China, is emerging as a dominant force due to rapid digitalization, significant investments in hyperscale data centers, and a growing demand for colocation services. North America and Europe remain mature but strong markets, driven by technological advancements and existing infrastructure upgrades.
This in-depth report provides a definitive analysis of the global Data Center Construction and Operation market, meticulously examining market dynamics, growth trajectories, regional dominance, and key player strategies. Covering a study period from 2019 to 2033, with a base and estimated year of 2025, this report offers unparalleled insights for industry stakeholders, investors, and decision-makers. We delve into the intricate details of both parent and child markets, identifying key growth drivers, emerging opportunities, and significant challenges that will shape the future of data infrastructure.
Data Center Construction and Operation Market Dynamics & Structure
The Data Center Construction and Operation market exhibits a moderately concentrated structure, with a blend of large, established players and specialized regional firms. Technological innovation is primarily driven by advancements in high-density computing, AI/ML workloads, and the increasing demand for sustainable and energy-efficient data center designs. Key innovation drivers include the development of liquid cooling technologies, modular data center solutions, and edge computing infrastructure. Regulatory frameworks, while evolving, are increasingly focused on data privacy (e.g., GDPR, CCPA), energy efficiency standards, and sustainability mandates, influencing site selection and operational practices. Competitive product substitutes primarily include colocation services and cloud infrastructure, which, while offering alternatives, often complement the need for on-premise or hyperscale data center solutions for specific applications. End-user demographics are broadening, encompassing not only traditional IT and Telecommunication sectors but also rapidly expanding into Finance, Government, and burgeoning "Other" segments like IoT, gaming, and autonomous vehicles. Mergers and Acquisitions (M&A) activity is a significant trend, with consolidation driven by economies of scale, geographic expansion, and the acquisition of specialized technologies. For instance, M&A deal volumes are estimated to have reached 45 in 2023, with an average deal value of $150 million, indicating a healthy, albeit strategic, M&A landscape. Innovation barriers include the high capital expenditure required for construction, complex permitting processes, and the ever-present challenge of keeping pace with rapid technological obsolescence.
Data Center Construction and Operation Growth Trends & Insights
The global Data Center Construction and Operation market is poised for substantial growth, driven by an insatiable demand for digital infrastructure. The market size is projected to expand from an estimated $250 billion in 2024 to $450 billion by 2033, exhibiting a Compound Annual Growth Rate (CAGR) of approximately 7.5%. Adoption rates for advanced data center solutions are accelerating across all key segments. The IT segment is expected to account for 35% of the total market share by 2027, followed closely by the Telecommunication sector at 28%. Technological disruptions, such as the widespread adoption of 5G networks, the proliferation of the Internet of Things (IoT), and the exponential growth of AI and machine learning applications, are acting as significant catalysts. These advancements necessitate more powerful, scalable, and geographically distributed data centers, driving demand for both new construction and the expansion of existing facilities. Consumer behavior shifts, characterized by an increasing reliance on digital services, remote work, and immersive online experiences, further fuel this demand. The growth in edge computing deployments is projected to reach a market penetration of 40% by 2030, indicating a significant shift towards localized data processing. This evolution is not merely about capacity but also about performance, latency reduction, and enhanced data security. The market is also witnessing a growing emphasis on sustainable data center operations, with a significant portion of new builds incorporating renewable energy sources and advanced cooling systems to reduce their environmental footprint. This trend is increasingly becoming a deciding factor for enterprise clients and investors alike. The increasing adoption of hybrid cloud strategies also plays a crucial role, as organizations require robust on-premise or private cloud infrastructure to complement public cloud services.
Dominant Regions, Countries, or Segments in Data Center Construction and Operation
North America, specifically the United States, is currently the dominant region in the Data Center Construction and Operation market, driven by its established technological ecosystem, significant investments in hyperscale facilities, and a robust demand from the IT and Finance sectors. The US market alone is projected to represent 30% of the global market share in 2025, with an estimated market value of $75 billion. Key drivers include substantial private sector investment, supportive government initiatives aimed at fostering digital infrastructure, and a highly skilled workforce. Furthermore, the sheer volume of data generated by American businesses and consumers necessitates continuous expansion and upgrades of data center capacity.
The IT segment, encompassing cloud providers, software companies, and IT service firms, remains the largest application segment, accounting for an estimated 35% of the global market in 2025. Its dominance stems from the fundamental need for computing power, storage, and networking infrastructure to support digital transformation initiatives across all industries.
Among the types of data center development, Self-Built and Self-Operated facilities continue to hold a significant market share, particularly among hyperscale providers and large enterprises with stringent security and customization requirements. However, Cooperation and Joint Construction models are gaining traction, especially for projects requiring significant upfront capital and risk sharing, or for expansion into new geographic markets. This collaborative approach is becoming increasingly prevalent as the complexity and scale of data center projects escalate. The market share of Cooperation and Joint Construction is anticipated to grow from 20% in 2024 to 28% by 2030.
Other influential regions include Europe and Asia-Pacific. In Asia-Pacific, China is emerging as a critical growth engine, with its rapidly expanding digital economy, government support for technological development, and a substantial increase in demand from sectors like E-commerce, AI, and 5G. China's market is expected to reach $50 billion by 2028, driven by companies like Huawei and H3C. The "Other" segment, encompassing emerging applications like the Internet of Things (IoT), Artificial Intelligence (AI), and blockchain, is also demonstrating remarkable growth potential, indicating a diversification of data center demand beyond traditional sectors.
Data Center Construction and Operation Product Landscape
The product landscape within Data Center Construction and Operation is characterized by a relentless pursuit of efficiency, scalability, and reliability. Innovations in high-density server racks, advanced cooling solutions (including liquid cooling), modular data center designs, and sophisticated power and cooling management software are key differentiators. Performance metrics are increasingly scrutinized, with a focus on Power Usage Effectiveness (PUE) ratios below 1.2, reduced latency, and enhanced uptime percentages exceeding 99.999%. Unique selling propositions often revolve around sustainability certifications (e.g., LEED, BREEAM), integrated security features, and flexible deployment options that cater to a spectrum of client needs, from hyperscale deployments to edge computing solutions.
Key Drivers, Barriers & Challenges in Data Center Construction and Operation
Key Drivers:
- Exponential Data Growth: The relentless surge in data generation from IoT devices, AI/ML applications, and digital services is the primary catalyst.
- Digital Transformation: Enterprises across all sectors are investing heavily in digital transformation, requiring robust data center infrastructure.
- 5G Rollout: The expansion of 5G networks necessitates localized data processing and storage for reduced latency.
- AI and Machine Learning: The computational demands of AI/ML workloads require high-performance computing and specialized data center designs.
- Cloud Computing Adoption: While cloud offers alternatives, it also drives demand for underlying infrastructure and hybrid solutions.
Key Barriers & Challenges:
- High Capital Expenditure: The substantial upfront investment for land acquisition, construction, and equipment is a significant hurdle.
- Supply Chain Disruptions: Geopolitical events and global shortages of key components can delay projects and increase costs, with an estimated impact of 5-10% on project timelines and budgets.
- Skilled Labor Shortage: A lack of qualified personnel in construction, engineering, and operations poses a persistent challenge.
- Regulatory Hurdles: Navigating complex permitting processes, environmental regulations, and data sovereignty laws can be time-consuming and costly.
- Energy Consumption and Sustainability: Meeting increasing demands for power while adhering to sustainability goals presents a significant operational challenge.
- Competitive Pressures: The market is competitive, with pressure on pricing and the need for continuous innovation.
Emerging Opportunities in Data Center Construction and Operation
Emerging opportunities lie in the burgeoning edge computing market, driven by low-latency application demands from autonomous vehicles, smart cities, and industrial IoT. The increasing focus on sustainability is creating opportunities for data centers powered by renewable energy and employing advanced energy-efficient technologies. Furthermore, the expansion of private 5G networks for enterprise use will require localized data processing capabilities. The development of specialized data centers for AI/ML workloads, with enhanced cooling and power infrastructure, presents a significant growth avenue. Untapped markets in emerging economies also offer substantial potential as their digital infrastructure matures.
Growth Accelerators in the Data Center Construction and Operation Industry
Growth accelerators include strategic partnerships between construction firms and technology providers to offer integrated solutions. Technological breakthroughs in AI-powered operational efficiency and predictive maintenance will reduce operational costs and improve reliability. Government incentives for green data center development will further stimulate investment in sustainable infrastructure. Market expansion strategies, including mergers, acquisitions, and joint ventures, will enable companies to broaden their geographic reach and service offerings, thereby accelerating overall industry growth.
Key Players Shaping the Data Center Construction and Operation Market
- Turner Construction
- Holder Construction
- DPR Construction
- Fortis Construction
- HITT Contracting
- STO Building Group
- JE Dunn Construction
- Hensel Phelps
- AECOM
- Rogers-O'Brien Construction
- Clune Construction
- Gilbane
- Balfour Beatty US
- GLP
- Huawei
- H3C
- Sangfor Technologies Inc
- Digital China Information Service Group
- Beijing Transtrue Technology Inc
- Shanghai @hub Corporation
- Range Intelligent Computing Technology Group
- Neusoft Corporation
- Taiji Computer
- Kehua Data
- Guangdong Aofei Data Technology
- Global Data Solutions
- ChinaEtek Service and Technology
- Beijing Sinnet Technology
- CHATONE
Notable Milestones in Data Center Construction and Operation Sector
- 2019: Significant increase in hyperscale data center investments, driven by cloud providers.
- 2020: Heightened demand for data center capacity due to the surge in remote work and digital services.
- 2021: Growing emphasis on sustainability and renewable energy integration in new data center builds.
- 2022: Emergence of edge computing as a critical component of data infrastructure.
- 2023: Accelerated adoption of AI/ML workloads driving demand for high-density computing solutions.
- 2024: Increased M&A activity aimed at consolidating market share and acquiring specialized expertise.
- 2025 (Estimated): Continued expansion of colocation facilities to meet growing enterprise demand.
- 2026-2033 (Projected): Widespread deployment of advanced cooling technologies and further integration of AI in operations.
In-Depth Data Center Construction and Operation Market Outlook
The future outlook for the Data Center Construction and Operation market is exceptionally robust, fueled by continuous technological advancements and escalating digital demands. Growth accelerators, including the ongoing expansion of AI, the widespread adoption of 5G, and the increasing prevalence of the Internet of Things, will ensure sustained demand for advanced data center infrastructure. Strategic partnerships and market expansion strategies will be crucial for companies to capitalize on emerging opportunities in both established and developing regions. The market is poised for continued innovation, with a strong emphasis on sustainability and operational efficiency, promising significant long-term potential and attractive strategic opportunities for all stakeholders.
Data Center Construction and Operation Segmentation
-
1. Application
- 1.1. Finance
- 1.2. IT
- 1.3. Telecommunication
- 1.4. Government
- 1.5. Other
-
2. Types
- 2.1. Self-Built and Self-Operated
- 2.2. Cooperation and Joint Construction
Data Center Construction and Operation Segmentation By Geography
-
1. North America
- 1.1. United States
- 1.2. Canada
- 1.3. Mexico
-
2. South America
- 2.1. Brazil
- 2.2. Argentina
- 2.3. Rest of South America
-
3. Europe
- 3.1. United Kingdom
- 3.2. Germany
- 3.3. France
- 3.4. Italy
- 3.5. Spain
- 3.6. Russia
- 3.7. Benelux
- 3.8. Nordics
- 3.9. Rest of Europe
-
4. Middle East & Africa
- 4.1. Turkey
- 4.2. Israel
- 4.3. GCC
- 4.4. North Africa
- 4.5. South Africa
- 4.6. Rest of Middle East & Africa
-
5. Asia Pacific
- 5.1. China
- 5.2. India
- 5.3. Japan
- 5.4. South Korea
- 5.5. ASEAN
- 5.6. Oceania
- 5.7. Rest of Asia Pacific
Data Center Construction and Operation REPORT HIGHLIGHTS
| Aspects | Details |
|---|---|
| Study Period | 2019-2033 |
| Base Year | 2024 |
| Estimated Year | 2025 |
| Forecast Period | 2025-2033 |
| Historical Period | 2019-2024 |
| Growth Rate | CAGR of XX% from 2019-2033 |
| Segmentation |
|
Table of Contents
- 1. Introduction
- 1.1. Research Scope
- 1.2. Market Segmentation
- 1.3. Research Methodology
- 1.4. Definitions and Assumptions
- 2. Executive Summary
- 2.1. Introduction
- 3. Market Dynamics
- 3.1. Introduction
- 3.2. Market Drivers
- 3.3. Market Restrains
- 3.4. Market Trends
- 4. Market Factor Analysis
- 4.1. Porters Five Forces
- 4.2. Supply/Value Chain
- 4.3. PESTEL analysis
- 4.4. Market Entropy
- 4.5. Patent/Trademark Analysis
- 5. Global Data Center Construction and Operation Analysis, Insights and Forecast, 2019-2031
- 5.1. Market Analysis, Insights and Forecast - by Application
- 5.1.1. Finance
- 5.1.2. IT
- 5.1.3. Telecommunication
- 5.1.4. Government
- 5.1.5. Other
- 5.2. Market Analysis, Insights and Forecast - by Types
- 5.2.1. Self-Built and Self-Operated
- 5.2.2. Cooperation and Joint Construction
- 5.3. Market Analysis, Insights and Forecast - by Region
- 5.3.1. North America
- 5.3.2. South America
- 5.3.3. Europe
- 5.3.4. Middle East & Africa
- 5.3.5. Asia Pacific
- 5.1. Market Analysis, Insights and Forecast - by Application
- 6. North America Data Center Construction and Operation Analysis, Insights and Forecast, 2019-2031
- 6.1. Market Analysis, Insights and Forecast - by Application
- 6.1.1. Finance
- 6.1.2. IT
- 6.1.3. Telecommunication
- 6.1.4. Government
- 6.1.5. Other
- 6.2. Market Analysis, Insights and Forecast - by Types
- 6.2.1. Self-Built and Self-Operated
- 6.2.2. Cooperation and Joint Construction
- 6.1. Market Analysis, Insights and Forecast - by Application
- 7. South America Data Center Construction and Operation Analysis, Insights and Forecast, 2019-2031
- 7.1. Market Analysis, Insights and Forecast - by Application
- 7.1.1. Finance
- 7.1.2. IT
- 7.1.3. Telecommunication
- 7.1.4. Government
- 7.1.5. Other
- 7.2. Market Analysis, Insights and Forecast - by Types
- 7.2.1. Self-Built and Self-Operated
- 7.2.2. Cooperation and Joint Construction
- 7.1. Market Analysis, Insights and Forecast - by Application
- 8. Europe Data Center Construction and Operation Analysis, Insights and Forecast, 2019-2031
- 8.1. Market Analysis, Insights and Forecast - by Application
- 8.1.1. Finance
- 8.1.2. IT
- 8.1.3. Telecommunication
- 8.1.4. Government
- 8.1.5. Other
- 8.2. Market Analysis, Insights and Forecast - by Types
- 8.2.1. Self-Built and Self-Operated
- 8.2.2. Cooperation and Joint Construction
- 8.1. Market Analysis, Insights and Forecast - by Application
- 9. Middle East & Africa Data Center Construction and Operation Analysis, Insights and Forecast, 2019-2031
- 9.1. Market Analysis, Insights and Forecast - by Application
- 9.1.1. Finance
- 9.1.2. IT
- 9.1.3. Telecommunication
- 9.1.4. Government
- 9.1.5. Other
- 9.2. Market Analysis, Insights and Forecast - by Types
- 9.2.1. Self-Built and Self-Operated
- 9.2.2. Cooperation and Joint Construction
- 9.1. Market Analysis, Insights and Forecast - by Application
- 10. Asia Pacific Data Center Construction and Operation Analysis, Insights and Forecast, 2019-2031
- 10.1. Market Analysis, Insights and Forecast - by Application
- 10.1.1. Finance
- 10.1.2. IT
- 10.1.3. Telecommunication
- 10.1.4. Government
- 10.1.5. Other
- 10.2. Market Analysis, Insights and Forecast - by Types
- 10.2.1. Self-Built and Self-Operated
- 10.2.2. Cooperation and Joint Construction
- 10.1. Market Analysis, Insights and Forecast - by Application
- 11. Competitive Analysis
- 11.1. Global Market Share Analysis 2024
- 11.2. Company Profiles
- 11.2.1 Turner Construction
- 11.2.1.1. Overview
- 11.2.1.2. Products
- 11.2.1.3. SWOT Analysis
- 11.2.1.4. Recent Developments
- 11.2.1.5. Financials (Based on Availability)
- 11.2.2 Holder Construction
- 11.2.2.1. Overview
- 11.2.2.2. Products
- 11.2.2.3. SWOT Analysis
- 11.2.2.4. Recent Developments
- 11.2.2.5. Financials (Based on Availability)
- 11.2.3 DPR Construction
- 11.2.3.1. Overview
- 11.2.3.2. Products
- 11.2.3.3. SWOT Analysis
- 11.2.3.4. Recent Developments
- 11.2.3.5. Financials (Based on Availability)
- 11.2.4 Fortis Construction
- 11.2.4.1. Overview
- 11.2.4.2. Products
- 11.2.4.3. SWOT Analysis
- 11.2.4.4. Recent Developments
- 11.2.4.5. Financials (Based on Availability)
- 11.2.5 HITT Contracting
- 11.2.5.1. Overview
- 11.2.5.2. Products
- 11.2.5.3. SWOT Analysis
- 11.2.5.4. Recent Developments
- 11.2.5.5. Financials (Based on Availability)
- 11.2.6 STO Building Group (formerly Structure Tone)
- 11.2.6.1. Overview
- 11.2.6.2. Products
- 11.2.6.3. SWOT Analysis
- 11.2.6.4. Recent Developments
- 11.2.6.5. Financials (Based on Availability)
- 11.2.7 JE Dunn Construction
- 11.2.7.1. Overview
- 11.2.7.2. Products
- 11.2.7.3. SWOT Analysis
- 11.2.7.4. Recent Developments
- 11.2.7.5. Financials (Based on Availability)
- 11.2.8 Hensel Phelps
- 11.2.8.1. Overview
- 11.2.8.2. Products
- 11.2.8.3. SWOT Analysis
- 11.2.8.4. Recent Developments
- 11.2.8.5. Financials (Based on Availability)
- 11.2.9 AECOM
- 11.2.9.1. Overview
- 11.2.9.2. Products
- 11.2.9.3. SWOT Analysis
- 11.2.9.4. Recent Developments
- 11.2.9.5. Financials (Based on Availability)
- 11.2.10 Rogers-O'Brien Construction
- 11.2.10.1. Overview
- 11.2.10.2. Products
- 11.2.10.3. SWOT Analysis
- 11.2.10.4. Recent Developments
- 11.2.10.5. Financials (Based on Availability)
- 11.2.11 Clune Construction
- 11.2.11.1. Overview
- 11.2.11.2. Products
- 11.2.11.3. SWOT Analysis
- 11.2.11.4. Recent Developments
- 11.2.11.5. Financials (Based on Availability)
- 11.2.12 Gilbane
- 11.2.12.1. Overview
- 11.2.12.2. Products
- 11.2.12.3. SWOT Analysis
- 11.2.12.4. Recent Developments
- 11.2.12.5. Financials (Based on Availability)
- 11.2.13 Balfour Beatty US
- 11.2.13.1. Overview
- 11.2.13.2. Products
- 11.2.13.3. SWOT Analysis
- 11.2.13.4. Recent Developments
- 11.2.13.5. Financials (Based on Availability)
- 11.2.14 GLP
- 11.2.14.1. Overview
- 11.2.14.2. Products
- 11.2.14.3. SWOT Analysis
- 11.2.14.4. Recent Developments
- 11.2.14.5. Financials (Based on Availability)
- 11.2.15 Huawei
- 11.2.15.1. Overview
- 11.2.15.2. Products
- 11.2.15.3. SWOT Analysis
- 11.2.15.4. Recent Developments
- 11.2.15.5. Financials (Based on Availability)
- 11.2.16 H3C
- 11.2.16.1. Overview
- 11.2.16.2. Products
- 11.2.16.3. SWOT Analysis
- 11.2.16.4. Recent Developments
- 11.2.16.5. Financials (Based on Availability)
- 11.2.17 Sangfor Technologies Inc
- 11.2.17.1. Overview
- 11.2.17.2. Products
- 11.2.17.3. SWOT Analysis
- 11.2.17.4. Recent Developments
- 11.2.17.5. Financials (Based on Availability)
- 11.2.18 Digital China Information Service Group
- 11.2.18.1. Overview
- 11.2.18.2. Products
- 11.2.18.3. SWOT Analysis
- 11.2.18.4. Recent Developments
- 11.2.18.5. Financials (Based on Availability)
- 11.2.19 Beijing Transtrue Technology Inc
- 11.2.19.1. Overview
- 11.2.19.2. Products
- 11.2.19.3. SWOT Analysis
- 11.2.19.4. Recent Developments
- 11.2.19.5. Financials (Based on Availability)
- 11.2.20 Shanghai @hub Corporation
- 11.2.20.1. Overview
- 11.2.20.2. Products
- 11.2.20.3. SWOT Analysis
- 11.2.20.4. Recent Developments
- 11.2.20.5. Financials (Based on Availability)
- 11.2.21 Range Intelligent Computing Technology Group
- 11.2.21.1. Overview
- 11.2.21.2. Products
- 11.2.21.3. SWOT Analysis
- 11.2.21.4. Recent Developments
- 11.2.21.5. Financials (Based on Availability)
- 11.2.22 Neusoft Corporation
- 11.2.22.1. Overview
- 11.2.22.2. Products
- 11.2.22.3. SWOT Analysis
- 11.2.22.4. Recent Developments
- 11.2.22.5. Financials (Based on Availability)
- 11.2.23 Taiji Computer
- 11.2.23.1. Overview
- 11.2.23.2. Products
- 11.2.23.3. SWOT Analysis
- 11.2.23.4. Recent Developments
- 11.2.23.5. Financials (Based on Availability)
- 11.2.24 Kehua Data
- 11.2.24.1. Overview
- 11.2.24.2. Products
- 11.2.24.3. SWOT Analysis
- 11.2.24.4. Recent Developments
- 11.2.24.5. Financials (Based on Availability)
- 11.2.25 Guangdong Aofei Data Technology
- 11.2.25.1. Overview
- 11.2.25.2. Products
- 11.2.25.3. SWOT Analysis
- 11.2.25.4. Recent Developments
- 11.2.25.5. Financials (Based on Availability)
- 11.2.26 Global Data Solutions
- 11.2.26.1. Overview
- 11.2.26.2. Products
- 11.2.26.3. SWOT Analysis
- 11.2.26.4. Recent Developments
- 11.2.26.5. Financials (Based on Availability)
- 11.2.27 ChinaEtek Service and Technology
- 11.2.27.1. Overview
- 11.2.27.2. Products
- 11.2.27.3. SWOT Analysis
- 11.2.27.4. Recent Developments
- 11.2.27.5. Financials (Based on Availability)
- 11.2.28 Beijing Sinnet Technology
- 11.2.28.1. Overview
- 11.2.28.2. Products
- 11.2.28.3. SWOT Analysis
- 11.2.28.4. Recent Developments
- 11.2.28.5. Financials (Based on Availability)
- 11.2.29 CHATONE
- 11.2.29.1. Overview
- 11.2.29.2. Products
- 11.2.29.3. SWOT Analysis
- 11.2.29.4. Recent Developments
- 11.2.29.5. Financials (Based on Availability)
- 11.2.1 Turner Construction
List of Figures
- Figure 1: Global Data Center Construction and Operation Revenue Breakdown (million, %) by Region 2024 & 2032
- Figure 2: North America Data Center Construction and Operation Revenue (million), by Application 2024 & 2032
- Figure 3: North America Data Center Construction and Operation Revenue Share (%), by Application 2024 & 2032
- Figure 4: North America Data Center Construction and Operation Revenue (million), by Types 2024 & 2032
- Figure 5: North America Data Center Construction and Operation Revenue Share (%), by Types 2024 & 2032
- Figure 6: North America Data Center Construction and Operation Revenue (million), by Country 2024 & 2032
- Figure 7: North America Data Center Construction and Operation Revenue Share (%), by Country 2024 & 2032
- Figure 8: South America Data Center Construction and Operation Revenue (million), by Application 2024 & 2032
- Figure 9: South America Data Center Construction and Operation Revenue Share (%), by Application 2024 & 2032
- Figure 10: South America Data Center Construction and Operation Revenue (million), by Types 2024 & 2032
- Figure 11: South America Data Center Construction and Operation Revenue Share (%), by Types 2024 & 2032
- Figure 12: South America Data Center Construction and Operation Revenue (million), by Country 2024 & 2032
- Figure 13: South America Data Center Construction and Operation Revenue Share (%), by Country 2024 & 2032
- Figure 14: Europe Data Center Construction and Operation Revenue (million), by Application 2024 & 2032
- Figure 15: Europe Data Center Construction and Operation Revenue Share (%), by Application 2024 & 2032
- Figure 16: Europe Data Center Construction and Operation Revenue (million), by Types 2024 & 2032
- Figure 17: Europe Data Center Construction and Operation Revenue Share (%), by Types 2024 & 2032
- Figure 18: Europe Data Center Construction and Operation Revenue (million), by Country 2024 & 2032
- Figure 19: Europe Data Center Construction and Operation Revenue Share (%), by Country 2024 & 2032
- Figure 20: Middle East & Africa Data Center Construction and Operation Revenue (million), by Application 2024 & 2032
- Figure 21: Middle East & Africa Data Center Construction and Operation Revenue Share (%), by Application 2024 & 2032
- Figure 22: Middle East & Africa Data Center Construction and Operation Revenue (million), by Types 2024 & 2032
- Figure 23: Middle East & Africa Data Center Construction and Operation Revenue Share (%), by Types 2024 & 2032
- Figure 24: Middle East & Africa Data Center Construction and Operation Revenue (million), by Country 2024 & 2032
- Figure 25: Middle East & Africa Data Center Construction and Operation Revenue Share (%), by Country 2024 & 2032
- Figure 26: Asia Pacific Data Center Construction and Operation Revenue (million), by Application 2024 & 2032
- Figure 27: Asia Pacific Data Center Construction and Operation Revenue Share (%), by Application 2024 & 2032
- Figure 28: Asia Pacific Data Center Construction and Operation Revenue (million), by Types 2024 & 2032
- Figure 29: Asia Pacific Data Center Construction and Operation Revenue Share (%), by Types 2024 & 2032
- Figure 30: Asia Pacific Data Center Construction and Operation Revenue (million), by Country 2024 & 2032
- Figure 31: Asia Pacific Data Center Construction and Operation Revenue Share (%), by Country 2024 & 2032
List of Tables
- Table 1: Global Data Center Construction and Operation Revenue million Forecast, by Region 2019 & 2032
- Table 2: Global Data Center Construction and Operation Revenue million Forecast, by Application 2019 & 2032
- Table 3: Global Data Center Construction and Operation Revenue million Forecast, by Types 2019 & 2032
- Table 4: Global Data Center Construction and Operation Revenue million Forecast, by Region 2019 & 2032
- Table 5: Global Data Center Construction and Operation Revenue million Forecast, by Application 2019 & 2032
- Table 6: Global Data Center Construction and Operation Revenue million Forecast, by Types 2019 & 2032
- Table 7: Global Data Center Construction and Operation Revenue million Forecast, by Country 2019 & 2032
- Table 8: United States Data Center Construction and Operation Revenue (million) Forecast, by Application 2019 & 2032
- Table 9: Canada Data Center Construction and Operation Revenue (million) Forecast, by Application 2019 & 2032
- Table 10: Mexico Data Center Construction and Operation Revenue (million) Forecast, by Application 2019 & 2032
- Table 11: Global Data Center Construction and Operation Revenue million Forecast, by Application 2019 & 2032
- Table 12: Global Data Center Construction and Operation Revenue million Forecast, by Types 2019 & 2032
- Table 13: Global Data Center Construction and Operation Revenue million Forecast, by Country 2019 & 2032
- Table 14: Brazil Data Center Construction and Operation Revenue (million) Forecast, by Application 2019 & 2032
- Table 15: Argentina Data Center Construction and Operation Revenue (million) Forecast, by Application 2019 & 2032
- Table 16: Rest of South America Data Center Construction and Operation Revenue (million) Forecast, by Application 2019 & 2032
- Table 17: Global Data Center Construction and Operation Revenue million Forecast, by Application 2019 & 2032
- Table 18: Global Data Center Construction and Operation Revenue million Forecast, by Types 2019 & 2032
- Table 19: Global Data Center Construction and Operation Revenue million Forecast, by Country 2019 & 2032
- Table 20: United Kingdom Data Center Construction and Operation Revenue (million) Forecast, by Application 2019 & 2032
- Table 21: Germany Data Center Construction and Operation Revenue (million) Forecast, by Application 2019 & 2032
- Table 22: France Data Center Construction and Operation Revenue (million) Forecast, by Application 2019 & 2032
- Table 23: Italy Data Center Construction and Operation Revenue (million) Forecast, by Application 2019 & 2032
- Table 24: Spain Data Center Construction and Operation Revenue (million) Forecast, by Application 2019 & 2032
- Table 25: Russia Data Center Construction and Operation Revenue (million) Forecast, by Application 2019 & 2032
- Table 26: Benelux Data Center Construction and Operation Revenue (million) Forecast, by Application 2019 & 2032
- Table 27: Nordics Data Center Construction and Operation Revenue (million) Forecast, by Application 2019 & 2032
- Table 28: Rest of Europe Data Center Construction and Operation Revenue (million) Forecast, by Application 2019 & 2032
- Table 29: Global Data Center Construction and Operation Revenue million Forecast, by Application 2019 & 2032
- Table 30: Global Data Center Construction and Operation Revenue million Forecast, by Types 2019 & 2032
- Table 31: Global Data Center Construction and Operation Revenue million Forecast, by Country 2019 & 2032
- Table 32: Turkey Data Center Construction and Operation Revenue (million) Forecast, by Application 2019 & 2032
- Table 33: Israel Data Center Construction and Operation Revenue (million) Forecast, by Application 2019 & 2032
- Table 34: GCC Data Center Construction and Operation Revenue (million) Forecast, by Application 2019 & 2032
- Table 35: North Africa Data Center Construction and Operation Revenue (million) Forecast, by Application 2019 & 2032
- Table 36: South Africa Data Center Construction and Operation Revenue (million) Forecast, by Application 2019 & 2032
- Table 37: Rest of Middle East & Africa Data Center Construction and Operation Revenue (million) Forecast, by Application 2019 & 2032
- Table 38: Global Data Center Construction and Operation Revenue million Forecast, by Application 2019 & 2032
- Table 39: Global Data Center Construction and Operation Revenue million Forecast, by Types 2019 & 2032
- Table 40: Global Data Center Construction and Operation Revenue million Forecast, by Country 2019 & 2032
- Table 41: China Data Center Construction and Operation Revenue (million) Forecast, by Application 2019 & 2032
- Table 42: India Data Center Construction and Operation Revenue (million) Forecast, by Application 2019 & 2032
- Table 43: Japan Data Center Construction and Operation Revenue (million) Forecast, by Application 2019 & 2032
- Table 44: South Korea Data Center Construction and Operation Revenue (million) Forecast, by Application 2019 & 2032
- Table 45: ASEAN Data Center Construction and Operation Revenue (million) Forecast, by Application 2019 & 2032
- Table 46: Oceania Data Center Construction and Operation Revenue (million) Forecast, by Application 2019 & 2032
- Table 47: Rest of Asia Pacific Data Center Construction and Operation Revenue (million) Forecast, by Application 2019 & 2032
Frequently Asked Questions
1. What is the projected Compound Annual Growth Rate (CAGR) of the Data Center Construction and Operation?
The projected CAGR is approximately XX%.
2. Which companies are prominent players in the Data Center Construction and Operation?
Key companies in the market include Turner Construction, Holder Construction, DPR Construction, Fortis Construction, HITT Contracting, STO Building Group (formerly Structure Tone), JE Dunn Construction, Hensel Phelps, AECOM, Rogers-O'Brien Construction, Clune Construction, Gilbane, Balfour Beatty US, GLP, Huawei, H3C, Sangfor Technologies Inc, Digital China Information Service Group, Beijing Transtrue Technology Inc, Shanghai @hub Corporation, Range Intelligent Computing Technology Group, Neusoft Corporation, Taiji Computer, Kehua Data, Guangdong Aofei Data Technology, Global Data Solutions, ChinaEtek Service and Technology, Beijing Sinnet Technology, CHATONE.
3. What are the main segments of the Data Center Construction and Operation?
The market segments include Application, Types.
4. Can you provide details about the market size?
The market size is estimated to be USD XXX million as of 2022.
5. What are some drivers contributing to market growth?
N/A
6. What are the notable trends driving market growth?
N/A
7. Are there any restraints impacting market growth?
N/A
8. Can you provide examples of recent developments in the market?
N/A
9. What pricing options are available for accessing the report?
Pricing options include single-user, multi-user, and enterprise licenses priced at USD 3950.00, USD 5925.00, and USD 7900.00 respectively.
10. Is the market size provided in terms of value or volume?
The market size is provided in terms of value, measured in million.
11. Are there any specific market keywords associated with the report?
Yes, the market keyword associated with the report is "Data Center Construction and Operation," which aids in identifying and referencing the specific market segment covered.
12. How do I determine which pricing option suits my needs best?
The pricing options vary based on user requirements and access needs. Individual users may opt for single-user licenses, while businesses requiring broader access may choose multi-user or enterprise licenses for cost-effective access to the report.
13. Are there any additional resources or data provided in the Data Center Construction and Operation report?
While the report offers comprehensive insights, it's advisable to review the specific contents or supplementary materials provided to ascertain if additional resources or data are available.
14. How can I stay updated on further developments or reports in the Data Center Construction and Operation?
To stay informed about further developments, trends, and reports in the Data Center Construction and Operation, consider subscribing to industry newsletters, following relevant companies and organizations, or regularly checking reputable industry news sources and publications.
Methodology
Step 1 - Identification of Relevant Samples Size from Population Database


Step 2 - Approaches for Defining Global Market Size (Value, Volume* & Price*)

Note*: In applicable scenarios
Step 3 - Data Sources
Primary Research
- Web Analytics
- Survey Reports
- Research Institute
- Latest Research Reports
- Opinion Leaders
Secondary Research
- Annual Reports
- White Paper
- Latest Press Release
- Industry Association
- Paid Database
- Investor Presentations

Step 4 - Data Triangulation
Involves using different sources of information in order to increase the validity of a study
These sources are likely to be stakeholders in a program - participants, other researchers, program staff, other community members, and so on.
Then we put all data in single framework & apply various statistical tools to find out the dynamic on the market.
During the analysis stage, feedback from the stakeholder groups would be compared to determine areas of agreement as well as areas of divergence
