

Key Insights
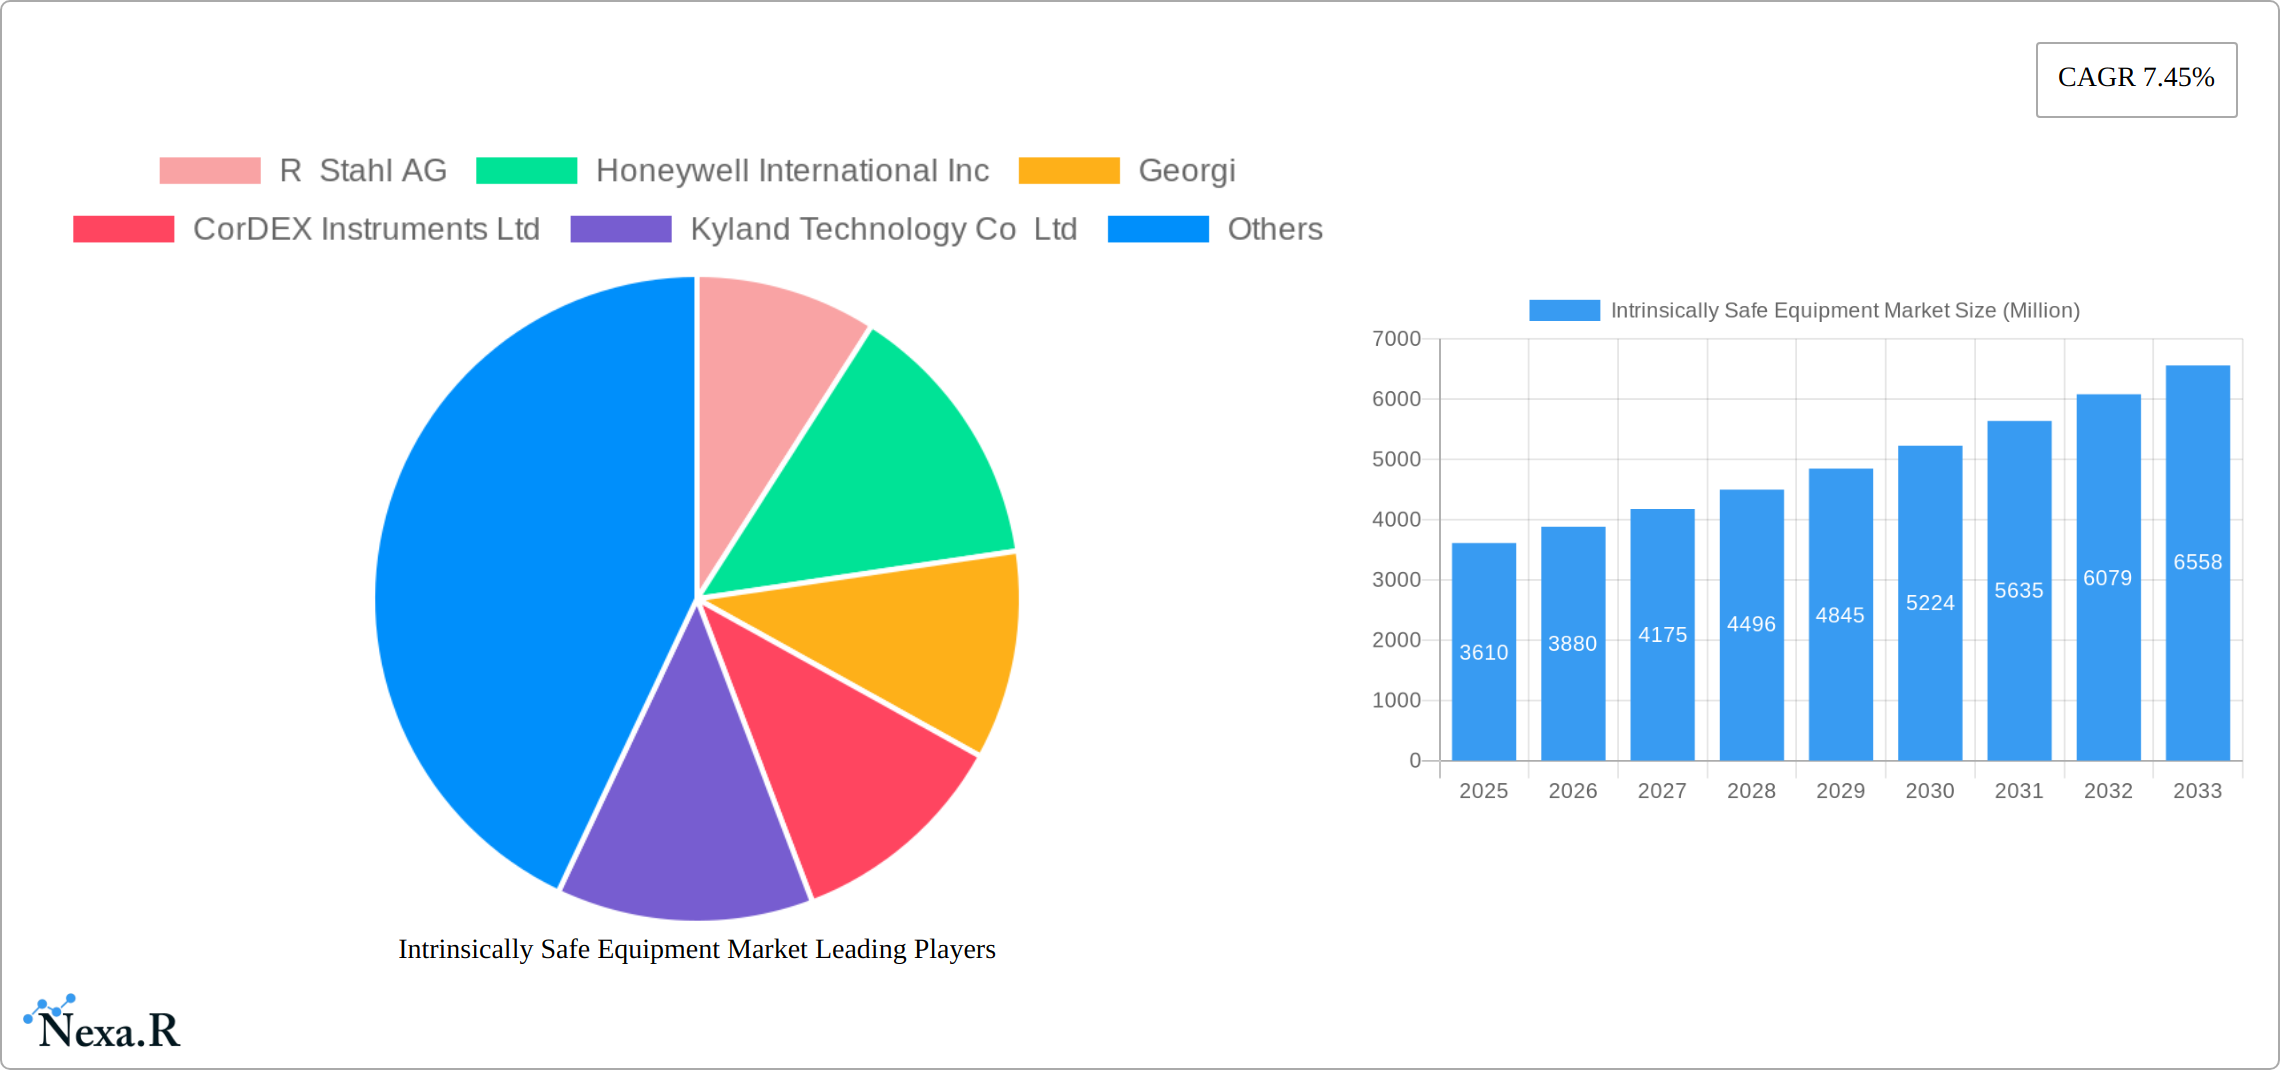
The intrinsically safe equipment market, valued at $3.61 billion in 2025, is projected to experience robust growth, driven by a compound annual growth rate (CAGR) of 7.45% from 2025 to 2033. This expansion is fueled by several key factors. The increasing demand for safety and regulatory compliance across hazardous industries, such as oil and gas, mining, and chemical processing, is a primary driver. These industries are increasingly adopting intrinsically safe equipment to mitigate risks associated with explosions and fires, thereby reducing operational downtime and enhancing worker safety. Technological advancements in sensor technology, miniaturization, and wireless communication are further contributing to market growth. The incorporation of advanced features like improved diagnostics, data analytics, and remote monitoring capabilities is enhancing the functionality and appeal of intrinsically safe equipment. Growth is also influenced by the expanding adoption of automation and digitalization in hazardous environments, which requires robust and reliable intrinsically safe equipment. The market's segmentation reflects this diversity, with significant contributions from sensors, detectors, and transmitters across various end-user industries and geographical zones. Competition is intense, with established players like R. Stahl AG and Honeywell International Inc. alongside other significant industry players, leading to continuous innovation and competitive pricing.
While the market shows significant potential, certain restraints could impact its trajectory. The high initial investment cost associated with intrinsically safe equipment might deter some smaller companies from adopting it. Furthermore, the complexity of selecting and installing appropriate equipment requires specialized expertise, creating a barrier for some users. However, the long-term benefits, including reduced risk, improved safety, and increased productivity, outweigh the initial investment. The ongoing emphasis on worker safety and environmental protection, coupled with stringent government regulations, will continue to drive demand, ensuring the market’s sustained growth over the forecast period. Regional variations in growth rates are expected, with North America and Asia-Pacific likely to exhibit the highest growth rates due to increased industrial activity and infrastructural development.
Intrinsically Safe Equipment Market: A Comprehensive Report (2019-2033)
This in-depth report provides a comprehensive analysis of the Intrinsically Safe Equipment market, encompassing market dynamics, growth trends, regional dominance, product landscape, key players, and future outlook. The report covers the period from 2019 to 2033, with 2025 serving as the base year and a forecast period extending to 2033. The total market size is projected to reach xx Million units by 2033, presenting significant opportunities for industry professionals.
Intrinsically Safe Equipment Market Dynamics & Structure
The intrinsically safe equipment market is characterized by a moderately concentrated structure, with key players such as R Stahl AG, Honeywell International Inc., and Pepperl+Fuchs holding significant market share. Technological innovation, driven by advancements in sensor technology, wireless communication, and data analytics, is a primary growth driver. Stringent safety regulations across various industries, particularly in oil & gas, mining, and chemical processing, further shape market dynamics. The market experiences competition from alternative safety solutions, though intrinsically safe equipment maintains a strong position due to its inherent safety features. Mergers and acquisitions (M&A) activity has been moderate in recent years, with approximately xx M&A deals recorded between 2019 and 2024.
- Market Concentration: Moderately concentrated, with top 5 players holding approximately xx% market share in 2024.
- Technological Innovation: Advancements in sensor technology, IoT integration, and predictive maintenance solutions are key drivers.
- Regulatory Landscape: Stringent safety regulations (e.g., ATEX, IECEx) are crucial market shaping factors.
- Competitive Substitutes: Alternative safety solutions exist but intrinsically safe equipment retains its dominance due to its inherent safety features.
- End-User Demographics: Dominated by Oil & Gas, Mining, and Chemical sectors.
- M&A Trends: Moderate activity observed, with xx M&A deals recorded between 2019 and 2024. Further consolidation is anticipated.
Intrinsically Safe Equipment Market Growth Trends & Insights
The intrinsically safe equipment market demonstrated robust growth throughout the historical period (2019-2024), achieving a CAGR of [Insert Precise CAGR Percentage]%. This expansion is primarily attributed to the escalating demand from high-risk sectors, a heightened awareness of workplace safety regulations, and continuous technological advancements leading to enhanced equipment capabilities and reduced operational costs. The market is projected to maintain its upward trajectory during the forecast period (2025-2033), propelled by factors such as the widespread adoption of Industry 4.0 technologies, the increasing emphasis on predictive maintenance strategies, and the expansion of infrastructure projects across key industrial sectors. Market penetration is anticipated to reach [Insert Precise Market Penetration Percentage] by 2033, with a projected CAGR of [Insert Precise CAGR Percentage]% during the forecast period. The integration of cutting-edge technologies, such as Artificial Intelligence (AI) and Machine Learning (ML) for predictive maintenance, is expected to significantly contribute to the market's growth trajectory during the forecast period. Specific growth segments within the market include [Mention specific high-growth segments e.g., wireless intrinsically safe devices, specific application areas].
Dominant Regions, Countries, or Segments in Intrinsically Safe Equipment Market
The North American and European regions currently dominate the intrinsically safe equipment market, driven by strong industrial activity, stringent safety regulations, and high adoption rates of advanced technologies. Within these regions, the Oil & Gas and Chemical sectors are the leading end-users. However, the Asia-Pacific region is projected to witness significant growth during the forecast period, fueled by substantial investments in infrastructure development and industrialization.
- Leading Regions: North America and Europe (xx% combined market share in 2024).
- Leading End-User: Oil & Gas (xx% market share in 2024) followed by Chemical and Petrochemical and Mining sectors.
- Fastest-Growing Region: Asia-Pacific, driven by rapid industrialization and infrastructure development.
- Key Growth Drivers: Stringent safety regulations, increasing industrial activity, rising awareness of worker safety, technological advancements (IoT, AI).
Intrinsically Safe Equipment Market Product Landscape
The intrinsically safe equipment market offers a wide range of products, including sensors, detectors, switches, transmitters, isolators, LED indicators, and other specialized equipment. Recent innovations focus on enhancing functionalities, improving durability, and integrating advanced technologies like wireless communication and data analytics for remote monitoring and predictive maintenance. These advancements improve operational efficiency and safety in hazardous environments. The emphasis is on smaller, more reliable, and easily integrated products with enhanced data capabilities.
Key Drivers, Barriers & Challenges in Intrinsically Safe Equipment Market
Key Drivers:
- Surging demand from hazardous industries (oil and gas, mining, chemical processing, pharmaceuticals, etc.).
- Stringent global safety regulations and compliance mandates, driving adoption.
- Significant technological advancements in sensor technology, wireless communication protocols (e.g., Bluetooth, Wi-Fi), and sophisticated data analytics capabilities.
- Growing adoption of Industry 4.0 technologies, fostering digitalization and automation across industrial processes.
- Increased investment in infrastructure projects globally, demanding robust and safe equipment solutions.
Key Challenges & Restraints:
- High initial capital expenditure for intrinsically safe equipment, potentially hindering adoption by smaller companies.
- Complex installation and maintenance procedures requiring specialized training and expertise.
- Potential supply chain disruptions and fluctuations in raw material prices impacting component availability and production lead times.
- Intense competition among established players, leading to price pressures and the need for differentiation through innovative solutions.
- The need for ongoing compliance with evolving safety standards and regulations.
Emerging Opportunities in Intrinsically Safe Equipment Market
- Expansion into emerging markets with growing industrial sectors.
- Development of advanced sensors and detectors with improved accuracy and reliability.
- Integration of AI and ML for predictive maintenance and anomaly detection.
- Growing demand for IoT-enabled intrinsically safe equipment for remote monitoring and control.
- Development of intrinsically safe equipment for new applications (e.g., renewable energy).
Growth Accelerators in the Intrinsically Safe Equipment Market Industry
Technological advancements such as the integration of AI and machine learning for predictive maintenance and the development of more sophisticated sensors are key growth catalysts. Strategic partnerships between equipment manufacturers and technology providers can further accelerate innovation. Expansion into emerging markets and the development of cost-effective solutions will also significantly drive market growth in the long term.
Key Players Shaping the Intrinsically Safe Equipment Market Market
- R Stahl AG
- Honeywell International Inc
- Georgi
- CorDEX Instruments Ltd
- Kyland Technology Co Ltd
- Eaton Corporation PLC
- Fluke Corporation (Fortive Corporation)
- Bayco Products Inc
- Banner Engineering Corp
- Pepperl + Fuchs
- OMEGA Engineering (Spectris PLC)
Notable Milestones in Intrinsically Safe Equipment Market Sector
- November 2023: Amazon Inc. launched AWS Monitron, leveraging ML for predictive maintenance in industrial equipment. This introduces a new level of proactive safety management.
- September 2023: Red Sky Lighting partnered with Daly Middle East, expanding distribution of intrinsically safe lighting solutions across the GCC region. This significantly boosts market reach in a key area.
In-Depth Intrinsically Safe Equipment Market Market Outlook
The intrinsically safe equipment market is poised for continued growth, driven by technological advancements, increasing demand from various industries, and stringent safety regulations. Strategic partnerships, investments in R&D, and expansion into untapped markets will play a crucial role in shaping the market's future. The market's long-term potential is significant, with opportunities for innovation, expansion, and substantial market share gains for companies that can successfully adapt to evolving industry needs.
Intrinsically Safe Equipment Market Segmentation
-
1. Zone
- 1.1. Zone 0
- 1.2. Zone 20
- 1.3. Zone 1
- 1.4. Zone 21
- 1.5. Zone 22
-
2. Class
- 2.1. Class 1
- 2.2. Class 2
- 2.3. Class 3
-
3. Products
- 3.1. Sensors
- 3.2. Detectors
- 3.3. Switches
- 3.4. Transmitters
- 3.5. Isolators
- 3.6. LED Indicators
- 3.7. Others Products
-
4. End User
- 4.1. Oil and Gas
- 4.2. Mining
- 4.3. Power
- 4.4. Chemical and Petrochemical
- 4.5. Processing
- 4.6. Other End Users
Intrinsically Safe Equipment Market Segmentation By Geography
-
1. North America
- 1.1. United States
- 1.2. Canada
-
2. Europe
- 2.1. Germany
- 2.2. United Kingdom
- 2.3. France
- 2.4. Rest of Europe
-
3. Asia Pacific
- 3.1. China
- 3.2. Japan
- 3.3. India
- 3.4. Rest of Asia Pacific
-
4. Latin America
- 4.1. Brazil
- 4.2. Mexico
- 4.3. Argentina
- 4.4. Rest of Latin America
- 5. Middle East
-
6. Saudi Arabia
- 6.1. United Arab Emirates
- 6.2. Rest of Middle East

Intrinsically Safe Equipment Market REPORT HIGHLIGHTS
| Aspects | Details |
|---|---|
| Study Period | 2019-2033 |
| Base Year | 2024 |
| Estimated Year | 2025 |
| Forecast Period | 2025-2033 |
| Historical Period | 2019-2024 |
| Growth Rate | CAGR of 7.45% from 2019-2033 |
| Segmentation |
|
Table of Contents
- 1. Introduction
- 1.1. Research Scope
- 1.2. Market Segmentation
- 1.3. Research Methodology
- 1.4. Definitions and Assumptions
- 2. Executive Summary
- 2.1. Introduction
- 3. Market Dynamics
- 3.1. Introduction
- 3.2. Market Drivers
- 3.2.1 Increasing Number of Government Regulations; Growing Energy Requirements
- 3.2.2 Driving the Demand for Exploration of New Mines and Oil and Gas Resources
- 3.3. Market Restrains
- 3.3.1. ; High Cost of Energy-efficient Pumps; Fluctuations in the Price of Raw Materials
- 3.4. Market Trends
- 3.4.1. Oil and Gas End User Segment is Expected to Hold a Significant Market Share
- 4. Market Factor Analysis
- 4.1. Porters Five Forces
- 4.2. Supply/Value Chain
- 4.3. PESTEL analysis
- 4.4. Market Entropy
- 4.5. Patent/Trademark Analysis
- 5. Global Intrinsically Safe Equipment Market Analysis, Insights and Forecast, 2019-2031
- 5.1. Market Analysis, Insights and Forecast - by Zone
- 5.1.1. Zone 0
- 5.1.2. Zone 20
- 5.1.3. Zone 1
- 5.1.4. Zone 21
- 5.1.5. Zone 22
- 5.2. Market Analysis, Insights and Forecast - by Class
- 5.2.1. Class 1
- 5.2.2. Class 2
- 5.2.3. Class 3
- 5.3. Market Analysis, Insights and Forecast - by Products
- 5.3.1. Sensors
- 5.3.2. Detectors
- 5.3.3. Switches
- 5.3.4. Transmitters
- 5.3.5. Isolators
- 5.3.6. LED Indicators
- 5.3.7. Others Products
- 5.4. Market Analysis, Insights and Forecast - by End User
- 5.4.1. Oil and Gas
- 5.4.2. Mining
- 5.4.3. Power
- 5.4.4. Chemical and Petrochemical
- 5.4.5. Processing
- 5.4.6. Other End Users
- 5.5. Market Analysis, Insights and Forecast - by Region
- 5.5.1. North America
- 5.5.2. Europe
- 5.5.3. Asia Pacific
- 5.5.4. Latin America
- 5.5.5. Middle East
- 5.5.6. Saudi Arabia
- 5.1. Market Analysis, Insights and Forecast - by Zone
- 6. North America Intrinsically Safe Equipment Market Analysis, Insights and Forecast, 2019-2031
- 6.1. Market Analysis, Insights and Forecast - by Zone
- 6.1.1. Zone 0
- 6.1.2. Zone 20
- 6.1.3. Zone 1
- 6.1.4. Zone 21
- 6.1.5. Zone 22
- 6.2. Market Analysis, Insights and Forecast - by Class
- 6.2.1. Class 1
- 6.2.2. Class 2
- 6.2.3. Class 3
- 6.3. Market Analysis, Insights and Forecast - by Products
- 6.3.1. Sensors
- 6.3.2. Detectors
- 6.3.3. Switches
- 6.3.4. Transmitters
- 6.3.5. Isolators
- 6.3.6. LED Indicators
- 6.3.7. Others Products
- 6.4. Market Analysis, Insights and Forecast - by End User
- 6.4.1. Oil and Gas
- 6.4.2. Mining
- 6.4.3. Power
- 6.4.4. Chemical and Petrochemical
- 6.4.5. Processing
- 6.4.6. Other End Users
- 6.1. Market Analysis, Insights and Forecast - by Zone
- 7. Europe Intrinsically Safe Equipment Market Analysis, Insights and Forecast, 2019-2031
- 7.1. Market Analysis, Insights and Forecast - by Zone
- 7.1.1. Zone 0
- 7.1.2. Zone 20
- 7.1.3. Zone 1
- 7.1.4. Zone 21
- 7.1.5. Zone 22
- 7.2. Market Analysis, Insights and Forecast - by Class
- 7.2.1. Class 1
- 7.2.2. Class 2
- 7.2.3. Class 3
- 7.3. Market Analysis, Insights and Forecast - by Products
- 7.3.1. Sensors
- 7.3.2. Detectors
- 7.3.3. Switches
- 7.3.4. Transmitters
- 7.3.5. Isolators
- 7.3.6. LED Indicators
- 7.3.7. Others Products
- 7.4. Market Analysis, Insights and Forecast - by End User
- 7.4.1. Oil and Gas
- 7.4.2. Mining
- 7.4.3. Power
- 7.4.4. Chemical and Petrochemical
- 7.4.5. Processing
- 7.4.6. Other End Users
- 7.1. Market Analysis, Insights and Forecast - by Zone
- 8. Asia Pacific Intrinsically Safe Equipment Market Analysis, Insights and Forecast, 2019-2031
- 8.1. Market Analysis, Insights and Forecast - by Zone
- 8.1.1. Zone 0
- 8.1.2. Zone 20
- 8.1.3. Zone 1
- 8.1.4. Zone 21
- 8.1.5. Zone 22
- 8.2. Market Analysis, Insights and Forecast - by Class
- 8.2.1. Class 1
- 8.2.2. Class 2
- 8.2.3. Class 3
- 8.3. Market Analysis, Insights and Forecast - by Products
- 8.3.1. Sensors
- 8.3.2. Detectors
- 8.3.3. Switches
- 8.3.4. Transmitters
- 8.3.5. Isolators
- 8.3.6. LED Indicators
- 8.3.7. Others Products
- 8.4. Market Analysis, Insights and Forecast - by End User
- 8.4.1. Oil and Gas
- 8.4.2. Mining
- 8.4.3. Power
- 8.4.4. Chemical and Petrochemical
- 8.4.5. Processing
- 8.4.6. Other End Users
- 8.1. Market Analysis, Insights and Forecast - by Zone
- 9. Latin America Intrinsically Safe Equipment Market Analysis, Insights and Forecast, 2019-2031
- 9.1. Market Analysis, Insights and Forecast - by Zone
- 9.1.1. Zone 0
- 9.1.2. Zone 20
- 9.1.3. Zone 1
- 9.1.4. Zone 21
- 9.1.5. Zone 22
- 9.2. Market Analysis, Insights and Forecast - by Class
- 9.2.1. Class 1
- 9.2.2. Class 2
- 9.2.3. Class 3
- 9.3. Market Analysis, Insights and Forecast - by Products
- 9.3.1. Sensors
- 9.3.2. Detectors
- 9.3.3. Switches
- 9.3.4. Transmitters
- 9.3.5. Isolators
- 9.3.6. LED Indicators
- 9.3.7. Others Products
- 9.4. Market Analysis, Insights and Forecast - by End User
- 9.4.1. Oil and Gas
- 9.4.2. Mining
- 9.4.3. Power
- 9.4.4. Chemical and Petrochemical
- 9.4.5. Processing
- 9.4.6. Other End Users
- 9.1. Market Analysis, Insights and Forecast - by Zone
- 10. Middle East Intrinsically Safe Equipment Market Analysis, Insights and Forecast, 2019-2031
- 10.1. Market Analysis, Insights and Forecast - by Zone
- 10.1.1. Zone 0
- 10.1.2. Zone 20
- 10.1.3. Zone 1
- 10.1.4. Zone 21
- 10.1.5. Zone 22
- 10.2. Market Analysis, Insights and Forecast - by Class
- 10.2.1. Class 1
- 10.2.2. Class 2
- 10.2.3. Class 3
- 10.3. Market Analysis, Insights and Forecast - by Products
- 10.3.1. Sensors
- 10.3.2. Detectors
- 10.3.3. Switches
- 10.3.4. Transmitters
- 10.3.5. Isolators
- 10.3.6. LED Indicators
- 10.3.7. Others Products
- 10.4. Market Analysis, Insights and Forecast - by End User
- 10.4.1. Oil and Gas
- 10.4.2. Mining
- 10.4.3. Power
- 10.4.4. Chemical and Petrochemical
- 10.4.5. Processing
- 10.4.6. Other End Users
- 10.1. Market Analysis, Insights and Forecast - by Zone
- 11. Saudi Arabia Intrinsically Safe Equipment Market Analysis, Insights and Forecast, 2019-2031
- 11.1. Market Analysis, Insights and Forecast - by Zone
- 11.1.1. Zone 0
- 11.1.2. Zone 20
- 11.1.3. Zone 1
- 11.1.4. Zone 21
- 11.1.5. Zone 22
- 11.2. Market Analysis, Insights and Forecast - by Class
- 11.2.1. Class 1
- 11.2.2. Class 2
- 11.2.3. Class 3
- 11.3. Market Analysis, Insights and Forecast - by Products
- 11.3.1. Sensors
- 11.3.2. Detectors
- 11.3.3. Switches
- 11.3.4. Transmitters
- 11.3.5. Isolators
- 11.3.6. LED Indicators
- 11.3.7. Others Products
- 11.4. Market Analysis, Insights and Forecast - by End User
- 11.4.1. Oil and Gas
- 11.4.2. Mining
- 11.4.3. Power
- 11.4.4. Chemical and Petrochemical
- 11.4.5. Processing
- 11.4.6. Other End Users
- 11.1. Market Analysis, Insights and Forecast - by Zone
- 12. North America Intrinsically Safe Equipment Market Analysis, Insights and Forecast, 2019-2031
- 12.1. Market Analysis, Insights and Forecast - By Country/Sub-region
- 12.1.1 United States
- 12.1.2 Canada
- 13. Europe Intrinsically Safe Equipment Market Analysis, Insights and Forecast, 2019-2031
- 13.1. Market Analysis, Insights and Forecast - By Country/Sub-region
- 13.1.1 Germany
- 13.1.2 United Kingdom
- 13.1.3 France
- 13.1.4 Rest of Europe
- 14. Asia Pacific Intrinsically Safe Equipment Market Analysis, Insights and Forecast, 2019-2031
- 14.1. Market Analysis, Insights and Forecast - By Country/Sub-region
- 14.1.1 China
- 14.1.2 Japan
- 14.1.3 India
- 14.1.4 Rest of Asia Pacific
- 15. Latin America Intrinsically Safe Equipment Market Analysis, Insights and Forecast, 2019-2031
- 15.1. Market Analysis, Insights and Forecast - By Country/Sub-region
- 15.1.1 Brazil
- 15.1.2 Mexico
- 15.1.3 Argentina
- 15.1.4 Rest of Latin America
- 16. Middle East Intrinsically Safe Equipment Market Analysis, Insights and Forecast, 2019-2031
- 16.1. Market Analysis, Insights and Forecast - By Country/Sub-region
- 16.1.1.
- 17. Saudi Arabia Intrinsically Safe Equipment Market Analysis, Insights and Forecast, 2019-2031
- 17.1. Market Analysis, Insights and Forecast - By Country/Sub-region
- 17.1.1 United Arab Emirates
- 17.1.2 Rest of Middle East
- 18. Competitive Analysis
- 18.1. Global Market Share Analysis 2024
- 18.2. Company Profiles
- 18.2.1 R Stahl AG
- 18.2.1.1. Overview
- 18.2.1.2. Products
- 18.2.1.3. SWOT Analysis
- 18.2.1.4. Recent Developments
- 18.2.1.5. Financials (Based on Availability)
- 18.2.2 Honeywell International Inc
- 18.2.2.1. Overview
- 18.2.2.2. Products
- 18.2.2.3. SWOT Analysis
- 18.2.2.4. Recent Developments
- 18.2.2.5. Financials (Based on Availability)
- 18.2.3 Georgi
- 18.2.3.1. Overview
- 18.2.3.2. Products
- 18.2.3.3. SWOT Analysis
- 18.2.3.4. Recent Developments
- 18.2.3.5. Financials (Based on Availability)
- 18.2.4 CorDEX Instruments Ltd
- 18.2.4.1. Overview
- 18.2.4.2. Products
- 18.2.4.3. SWOT Analysis
- 18.2.4.4. Recent Developments
- 18.2.4.5. Financials (Based on Availability)
- 18.2.5 Kyland Technology Co Ltd
- 18.2.5.1. Overview
- 18.2.5.2. Products
- 18.2.5.3. SWOT Analysis
- 18.2.5.4. Recent Developments
- 18.2.5.5. Financials (Based on Availability)
- 18.2.6 Eaton Corporation PLC
- 18.2.6.1. Overview
- 18.2.6.2. Products
- 18.2.6.3. SWOT Analysis
- 18.2.6.4. Recent Developments
- 18.2.6.5. Financials (Based on Availability)
- 18.2.7 Fluke Corporation (Fortive Corporation)
- 18.2.7.1. Overview
- 18.2.7.2. Products
- 18.2.7.3. SWOT Analysis
- 18.2.7.4. Recent Developments
- 18.2.7.5. Financials (Based on Availability)
- 18.2.8 Bayco Products Inc
- 18.2.8.1. Overview
- 18.2.8.2. Products
- 18.2.8.3. SWOT Analysis
- 18.2.8.4. Recent Developments
- 18.2.8.5. Financials (Based on Availability)
- 18.2.9 Banner Engineering Corp
- 18.2.9.1. Overview
- 18.2.9.2. Products
- 18.2.9.3. SWOT Analysis
- 18.2.9.4. Recent Developments
- 18.2.9.5. Financials (Based on Availability)
- 18.2.10 Pepperl + Fuchs
- 18.2.10.1. Overview
- 18.2.10.2. Products
- 18.2.10.3. SWOT Analysis
- 18.2.10.4. Recent Developments
- 18.2.10.5. Financials (Based on Availability)
- 18.2.11 OMEGA Engineering (Spectris PLC)
- 18.2.11.1. Overview
- 18.2.11.2. Products
- 18.2.11.3. SWOT Analysis
- 18.2.11.4. Recent Developments
- 18.2.11.5. Financials (Based on Availability)
- 18.2.1 R Stahl AG
List of Figures
- Figure 1: Global Intrinsically Safe Equipment Market Revenue Breakdown (Million, %) by Region 2024 & 2032
- Figure 2: North America Intrinsically Safe Equipment Market Revenue (Million), by Country 2024 & 2032
- Figure 3: North America Intrinsically Safe Equipment Market Revenue Share (%), by Country 2024 & 2032
- Figure 4: Europe Intrinsically Safe Equipment Market Revenue (Million), by Country 2024 & 2032
- Figure 5: Europe Intrinsically Safe Equipment Market Revenue Share (%), by Country 2024 & 2032
- Figure 6: Asia Pacific Intrinsically Safe Equipment Market Revenue (Million), by Country 2024 & 2032
- Figure 7: Asia Pacific Intrinsically Safe Equipment Market Revenue Share (%), by Country 2024 & 2032
- Figure 8: Latin America Intrinsically Safe Equipment Market Revenue (Million), by Country 2024 & 2032
- Figure 9: Latin America Intrinsically Safe Equipment Market Revenue Share (%), by Country 2024 & 2032
- Figure 10: Middle East Intrinsically Safe Equipment Market Revenue (Million), by Country 2024 & 2032
- Figure 11: Middle East Intrinsically Safe Equipment Market Revenue Share (%), by Country 2024 & 2032
- Figure 12: Saudi Arabia Intrinsically Safe Equipment Market Revenue (Million), by Country 2024 & 2032
- Figure 13: Saudi Arabia Intrinsically Safe Equipment Market Revenue Share (%), by Country 2024 & 2032
- Figure 14: North America Intrinsically Safe Equipment Market Revenue (Million), by Zone 2024 & 2032
- Figure 15: North America Intrinsically Safe Equipment Market Revenue Share (%), by Zone 2024 & 2032
- Figure 16: North America Intrinsically Safe Equipment Market Revenue (Million), by Class 2024 & 2032
- Figure 17: North America Intrinsically Safe Equipment Market Revenue Share (%), by Class 2024 & 2032
- Figure 18: North America Intrinsically Safe Equipment Market Revenue (Million), by Products 2024 & 2032
- Figure 19: North America Intrinsically Safe Equipment Market Revenue Share (%), by Products 2024 & 2032
- Figure 20: North America Intrinsically Safe Equipment Market Revenue (Million), by End User 2024 & 2032
- Figure 21: North America Intrinsically Safe Equipment Market Revenue Share (%), by End User 2024 & 2032
- Figure 22: North America Intrinsically Safe Equipment Market Revenue (Million), by Country 2024 & 2032
- Figure 23: North America Intrinsically Safe Equipment Market Revenue Share (%), by Country 2024 & 2032
- Figure 24: Europe Intrinsically Safe Equipment Market Revenue (Million), by Zone 2024 & 2032
- Figure 25: Europe Intrinsically Safe Equipment Market Revenue Share (%), by Zone 2024 & 2032
- Figure 26: Europe Intrinsically Safe Equipment Market Revenue (Million), by Class 2024 & 2032
- Figure 27: Europe Intrinsically Safe Equipment Market Revenue Share (%), by Class 2024 & 2032
- Figure 28: Europe Intrinsically Safe Equipment Market Revenue (Million), by Products 2024 & 2032
- Figure 29: Europe Intrinsically Safe Equipment Market Revenue Share (%), by Products 2024 & 2032
- Figure 30: Europe Intrinsically Safe Equipment Market Revenue (Million), by End User 2024 & 2032
- Figure 31: Europe Intrinsically Safe Equipment Market Revenue Share (%), by End User 2024 & 2032
- Figure 32: Europe Intrinsically Safe Equipment Market Revenue (Million), by Country 2024 & 2032
- Figure 33: Europe Intrinsically Safe Equipment Market Revenue Share (%), by Country 2024 & 2032
- Figure 34: Asia Pacific Intrinsically Safe Equipment Market Revenue (Million), by Zone 2024 & 2032
- Figure 35: Asia Pacific Intrinsically Safe Equipment Market Revenue Share (%), by Zone 2024 & 2032
- Figure 36: Asia Pacific Intrinsically Safe Equipment Market Revenue (Million), by Class 2024 & 2032
- Figure 37: Asia Pacific Intrinsically Safe Equipment Market Revenue Share (%), by Class 2024 & 2032
- Figure 38: Asia Pacific Intrinsically Safe Equipment Market Revenue (Million), by Products 2024 & 2032
- Figure 39: Asia Pacific Intrinsically Safe Equipment Market Revenue Share (%), by Products 2024 & 2032
- Figure 40: Asia Pacific Intrinsically Safe Equipment Market Revenue (Million), by End User 2024 & 2032
- Figure 41: Asia Pacific Intrinsically Safe Equipment Market Revenue Share (%), by End User 2024 & 2032
- Figure 42: Asia Pacific Intrinsically Safe Equipment Market Revenue (Million), by Country 2024 & 2032
- Figure 43: Asia Pacific Intrinsically Safe Equipment Market Revenue Share (%), by Country 2024 & 2032
- Figure 44: Latin America Intrinsically Safe Equipment Market Revenue (Million), by Zone 2024 & 2032
- Figure 45: Latin America Intrinsically Safe Equipment Market Revenue Share (%), by Zone 2024 & 2032
- Figure 46: Latin America Intrinsically Safe Equipment Market Revenue (Million), by Class 2024 & 2032
- Figure 47: Latin America Intrinsically Safe Equipment Market Revenue Share (%), by Class 2024 & 2032
- Figure 48: Latin America Intrinsically Safe Equipment Market Revenue (Million), by Products 2024 & 2032
- Figure 49: Latin America Intrinsically Safe Equipment Market Revenue Share (%), by Products 2024 & 2032
- Figure 50: Latin America Intrinsically Safe Equipment Market Revenue (Million), by End User 2024 & 2032
- Figure 51: Latin America Intrinsically Safe Equipment Market Revenue Share (%), by End User 2024 & 2032
- Figure 52: Latin America Intrinsically Safe Equipment Market Revenue (Million), by Country 2024 & 2032
- Figure 53: Latin America Intrinsically Safe Equipment Market Revenue Share (%), by Country 2024 & 2032
- Figure 54: Middle East Intrinsically Safe Equipment Market Revenue (Million), by Zone 2024 & 2032
- Figure 55: Middle East Intrinsically Safe Equipment Market Revenue Share (%), by Zone 2024 & 2032
- Figure 56: Middle East Intrinsically Safe Equipment Market Revenue (Million), by Class 2024 & 2032
- Figure 57: Middle East Intrinsically Safe Equipment Market Revenue Share (%), by Class 2024 & 2032
- Figure 58: Middle East Intrinsically Safe Equipment Market Revenue (Million), by Products 2024 & 2032
- Figure 59: Middle East Intrinsically Safe Equipment Market Revenue Share (%), by Products 2024 & 2032
- Figure 60: Middle East Intrinsically Safe Equipment Market Revenue (Million), by End User 2024 & 2032
- Figure 61: Middle East Intrinsically Safe Equipment Market Revenue Share (%), by End User 2024 & 2032
- Figure 62: Middle East Intrinsically Safe Equipment Market Revenue (Million), by Country 2024 & 2032
- Figure 63: Middle East Intrinsically Safe Equipment Market Revenue Share (%), by Country 2024 & 2032
- Figure 64: Saudi Arabia Intrinsically Safe Equipment Market Revenue (Million), by Zone 2024 & 2032
- Figure 65: Saudi Arabia Intrinsically Safe Equipment Market Revenue Share (%), by Zone 2024 & 2032
- Figure 66: Saudi Arabia Intrinsically Safe Equipment Market Revenue (Million), by Class 2024 & 2032
- Figure 67: Saudi Arabia Intrinsically Safe Equipment Market Revenue Share (%), by Class 2024 & 2032
- Figure 68: Saudi Arabia Intrinsically Safe Equipment Market Revenue (Million), by Products 2024 & 2032
- Figure 69: Saudi Arabia Intrinsically Safe Equipment Market Revenue Share (%), by Products 2024 & 2032
- Figure 70: Saudi Arabia Intrinsically Safe Equipment Market Revenue (Million), by End User 2024 & 2032
- Figure 71: Saudi Arabia Intrinsically Safe Equipment Market Revenue Share (%), by End User 2024 & 2032
- Figure 72: Saudi Arabia Intrinsically Safe Equipment Market Revenue (Million), by Country 2024 & 2032
- Figure 73: Saudi Arabia Intrinsically Safe Equipment Market Revenue Share (%), by Country 2024 & 2032
List of Tables
- Table 1: Global Intrinsically Safe Equipment Market Revenue Million Forecast, by Region 2019 & 2032
- Table 2: Global Intrinsically Safe Equipment Market Revenue Million Forecast, by Zone 2019 & 2032
- Table 3: Global Intrinsically Safe Equipment Market Revenue Million Forecast, by Class 2019 & 2032
- Table 4: Global Intrinsically Safe Equipment Market Revenue Million Forecast, by Products 2019 & 2032
- Table 5: Global Intrinsically Safe Equipment Market Revenue Million Forecast, by End User 2019 & 2032
- Table 6: Global Intrinsically Safe Equipment Market Revenue Million Forecast, by Region 2019 & 2032
- Table 7: Global Intrinsically Safe Equipment Market Revenue Million Forecast, by Country 2019 & 2032
- Table 8: United States Intrinsically Safe Equipment Market Revenue (Million) Forecast, by Application 2019 & 2032
- Table 9: Canada Intrinsically Safe Equipment Market Revenue (Million) Forecast, by Application 2019 & 2032
- Table 10: Global Intrinsically Safe Equipment Market Revenue Million Forecast, by Country 2019 & 2032
- Table 11: Germany Intrinsically Safe Equipment Market Revenue (Million) Forecast, by Application 2019 & 2032
- Table 12: United Kingdom Intrinsically Safe Equipment Market Revenue (Million) Forecast, by Application 2019 & 2032
- Table 13: France Intrinsically Safe Equipment Market Revenue (Million) Forecast, by Application 2019 & 2032
- Table 14: Rest of Europe Intrinsically Safe Equipment Market Revenue (Million) Forecast, by Application 2019 & 2032
- Table 15: Global Intrinsically Safe Equipment Market Revenue Million Forecast, by Country 2019 & 2032
- Table 16: China Intrinsically Safe Equipment Market Revenue (Million) Forecast, by Application 2019 & 2032
- Table 17: Japan Intrinsically Safe Equipment Market Revenue (Million) Forecast, by Application 2019 & 2032
- Table 18: India Intrinsically Safe Equipment Market Revenue (Million) Forecast, by Application 2019 & 2032
- Table 19: Rest of Asia Pacific Intrinsically Safe Equipment Market Revenue (Million) Forecast, by Application 2019 & 2032
- Table 20: Global Intrinsically Safe Equipment Market Revenue Million Forecast, by Country 2019 & 2032
- Table 21: Brazil Intrinsically Safe Equipment Market Revenue (Million) Forecast, by Application 2019 & 2032
- Table 22: Mexico Intrinsically Safe Equipment Market Revenue (Million) Forecast, by Application 2019 & 2032
- Table 23: Argentina Intrinsically Safe Equipment Market Revenue (Million) Forecast, by Application 2019 & 2032
- Table 24: Rest of Latin America Intrinsically Safe Equipment Market Revenue (Million) Forecast, by Application 2019 & 2032
- Table 25: Global Intrinsically Safe Equipment Market Revenue Million Forecast, by Country 2019 & 2032
- Table 26: Intrinsically Safe Equipment Market Revenue (Million) Forecast, by Application 2019 & 2032
- Table 27: Global Intrinsically Safe Equipment Market Revenue Million Forecast, by Country 2019 & 2032
- Table 28: United Arab Emirates Intrinsically Safe Equipment Market Revenue (Million) Forecast, by Application 2019 & 2032
- Table 29: Rest of Middle East Intrinsically Safe Equipment Market Revenue (Million) Forecast, by Application 2019 & 2032
- Table 30: Global Intrinsically Safe Equipment Market Revenue Million Forecast, by Zone 2019 & 2032
- Table 31: Global Intrinsically Safe Equipment Market Revenue Million Forecast, by Class 2019 & 2032
- Table 32: Global Intrinsically Safe Equipment Market Revenue Million Forecast, by Products 2019 & 2032
- Table 33: Global Intrinsically Safe Equipment Market Revenue Million Forecast, by End User 2019 & 2032
- Table 34: Global Intrinsically Safe Equipment Market Revenue Million Forecast, by Country 2019 & 2032
- Table 35: United States Intrinsically Safe Equipment Market Revenue (Million) Forecast, by Application 2019 & 2032
- Table 36: Canada Intrinsically Safe Equipment Market Revenue (Million) Forecast, by Application 2019 & 2032
- Table 37: Global Intrinsically Safe Equipment Market Revenue Million Forecast, by Zone 2019 & 2032
- Table 38: Global Intrinsically Safe Equipment Market Revenue Million Forecast, by Class 2019 & 2032
- Table 39: Global Intrinsically Safe Equipment Market Revenue Million Forecast, by Products 2019 & 2032
- Table 40: Global Intrinsically Safe Equipment Market Revenue Million Forecast, by End User 2019 & 2032
- Table 41: Global Intrinsically Safe Equipment Market Revenue Million Forecast, by Country 2019 & 2032
- Table 42: Germany Intrinsically Safe Equipment Market Revenue (Million) Forecast, by Application 2019 & 2032
- Table 43: United Kingdom Intrinsically Safe Equipment Market Revenue (Million) Forecast, by Application 2019 & 2032
- Table 44: France Intrinsically Safe Equipment Market Revenue (Million) Forecast, by Application 2019 & 2032
- Table 45: Rest of Europe Intrinsically Safe Equipment Market Revenue (Million) Forecast, by Application 2019 & 2032
- Table 46: Global Intrinsically Safe Equipment Market Revenue Million Forecast, by Zone 2019 & 2032
- Table 47: Global Intrinsically Safe Equipment Market Revenue Million Forecast, by Class 2019 & 2032
- Table 48: Global Intrinsically Safe Equipment Market Revenue Million Forecast, by Products 2019 & 2032
- Table 49: Global Intrinsically Safe Equipment Market Revenue Million Forecast, by End User 2019 & 2032
- Table 50: Global Intrinsically Safe Equipment Market Revenue Million Forecast, by Country 2019 & 2032
- Table 51: China Intrinsically Safe Equipment Market Revenue (Million) Forecast, by Application 2019 & 2032
- Table 52: Japan Intrinsically Safe Equipment Market Revenue (Million) Forecast, by Application 2019 & 2032
- Table 53: India Intrinsically Safe Equipment Market Revenue (Million) Forecast, by Application 2019 & 2032
- Table 54: Rest of Asia Pacific Intrinsically Safe Equipment Market Revenue (Million) Forecast, by Application 2019 & 2032
- Table 55: Global Intrinsically Safe Equipment Market Revenue Million Forecast, by Zone 2019 & 2032
- Table 56: Global Intrinsically Safe Equipment Market Revenue Million Forecast, by Class 2019 & 2032
- Table 57: Global Intrinsically Safe Equipment Market Revenue Million Forecast, by Products 2019 & 2032
- Table 58: Global Intrinsically Safe Equipment Market Revenue Million Forecast, by End User 2019 & 2032
- Table 59: Global Intrinsically Safe Equipment Market Revenue Million Forecast, by Country 2019 & 2032
- Table 60: Brazil Intrinsically Safe Equipment Market Revenue (Million) Forecast, by Application 2019 & 2032
- Table 61: Mexico Intrinsically Safe Equipment Market Revenue (Million) Forecast, by Application 2019 & 2032
- Table 62: Argentina Intrinsically Safe Equipment Market Revenue (Million) Forecast, by Application 2019 & 2032
- Table 63: Rest of Latin America Intrinsically Safe Equipment Market Revenue (Million) Forecast, by Application 2019 & 2032
- Table 64: Global Intrinsically Safe Equipment Market Revenue Million Forecast, by Zone 2019 & 2032
- Table 65: Global Intrinsically Safe Equipment Market Revenue Million Forecast, by Class 2019 & 2032
- Table 66: Global Intrinsically Safe Equipment Market Revenue Million Forecast, by Products 2019 & 2032
- Table 67: Global Intrinsically Safe Equipment Market Revenue Million Forecast, by End User 2019 & 2032
- Table 68: Global Intrinsically Safe Equipment Market Revenue Million Forecast, by Country 2019 & 2032
- Table 69: Global Intrinsically Safe Equipment Market Revenue Million Forecast, by Zone 2019 & 2032
- Table 70: Global Intrinsically Safe Equipment Market Revenue Million Forecast, by Class 2019 & 2032
- Table 71: Global Intrinsically Safe Equipment Market Revenue Million Forecast, by Products 2019 & 2032
- Table 72: Global Intrinsically Safe Equipment Market Revenue Million Forecast, by End User 2019 & 2032
- Table 73: Global Intrinsically Safe Equipment Market Revenue Million Forecast, by Country 2019 & 2032
- Table 74: United Arab Emirates Intrinsically Safe Equipment Market Revenue (Million) Forecast, by Application 2019 & 2032
- Table 75: Rest of Middle East Intrinsically Safe Equipment Market Revenue (Million) Forecast, by Application 2019 & 2032
Frequently Asked Questions
1. What is the projected Compound Annual Growth Rate (CAGR) of the Intrinsically Safe Equipment Market?
The projected CAGR is approximately 7.45%.
2. Which companies are prominent players in the Intrinsically Safe Equipment Market?
Key companies in the market include R Stahl AG, Honeywell International Inc, Georgi, CorDEX Instruments Ltd, Kyland Technology Co Ltd, Eaton Corporation PLC, Fluke Corporation (Fortive Corporation), Bayco Products Inc, Banner Engineering Corp, Pepperl + Fuchs, OMEGA Engineering (Spectris PLC).
3. What are the main segments of the Intrinsically Safe Equipment Market?
The market segments include Zone, Class, Products, End User.
4. Can you provide details about the market size?
The market size is estimated to be USD 3.61 Million as of 2022.
5. What are some drivers contributing to market growth?
Increasing Number of Government Regulations; Growing Energy Requirements. Driving the Demand for Exploration of New Mines and Oil and Gas Resources.
6. What are the notable trends driving market growth?
Oil and Gas End User Segment is Expected to Hold a Significant Market Share.
7. Are there any restraints impacting market growth?
; High Cost of Energy-efficient Pumps; Fluctuations in the Price of Raw Materials.
8. Can you provide examples of recent developments in the market?
November 2023 - Amazon Inc. launched an AWS Monitron solution that uses machine learning (ML) to identify anomalies in industrial equipment for predictive maintenance. It includes wireless sensors for vibration and temperature monitoring; gateways for automatic data transfer to AWS Cloud, a service that analyses the data for anomalies using ML; and an accompanying mobile app to configure the devices and get operating behavior reports and machine failure alerts.
9. What pricing options are available for accessing the report?
Pricing options include single-user, multi-user, and enterprise licenses priced at USD 4750, USD 5250, and USD 8750 respectively.
10. Is the market size provided in terms of value or volume?
The market size is provided in terms of value, measured in Million.
11. Are there any specific market keywords associated with the report?
Yes, the market keyword associated with the report is "Intrinsically Safe Equipment Market," which aids in identifying and referencing the specific market segment covered.
12. How do I determine which pricing option suits my needs best?
The pricing options vary based on user requirements and access needs. Individual users may opt for single-user licenses, while businesses requiring broader access may choose multi-user or enterprise licenses for cost-effective access to the report.
13. Are there any additional resources or data provided in the Intrinsically Safe Equipment Market report?
While the report offers comprehensive insights, it's advisable to review the specific contents or supplementary materials provided to ascertain if additional resources or data are available.
14. How can I stay updated on further developments or reports in the Intrinsically Safe Equipment Market?
To stay informed about further developments, trends, and reports in the Intrinsically Safe Equipment Market, consider subscribing to industry newsletters, following relevant companies and organizations, or regularly checking reputable industry news sources and publications.
Methodology
Step 1 - Identification of Relevant Samples Size from Population Database


Step 2 - Approaches for Defining Global Market Size (Value, Volume* & Price*)

Note*: In applicable scenarios
Step 3 - Data Sources
Primary Research
- Web Analytics
- Survey Reports
- Research Institute
- Latest Research Reports
- Opinion Leaders
Secondary Research
- Annual Reports
- White Paper
- Latest Press Release
- Industry Association
- Paid Database
- Investor Presentations

Step 4 - Data Triangulation
Involves using different sources of information in order to increase the validity of a study
These sources are likely to be stakeholders in a program - participants, other researchers, program staff, other community members, and so on.
Then we put all data in single framework & apply various statistical tools to find out the dynamic on the market.
During the analysis stage, feedback from the stakeholder groups would be compared to determine areas of agreement as well as areas of divergence
