

Key Insights
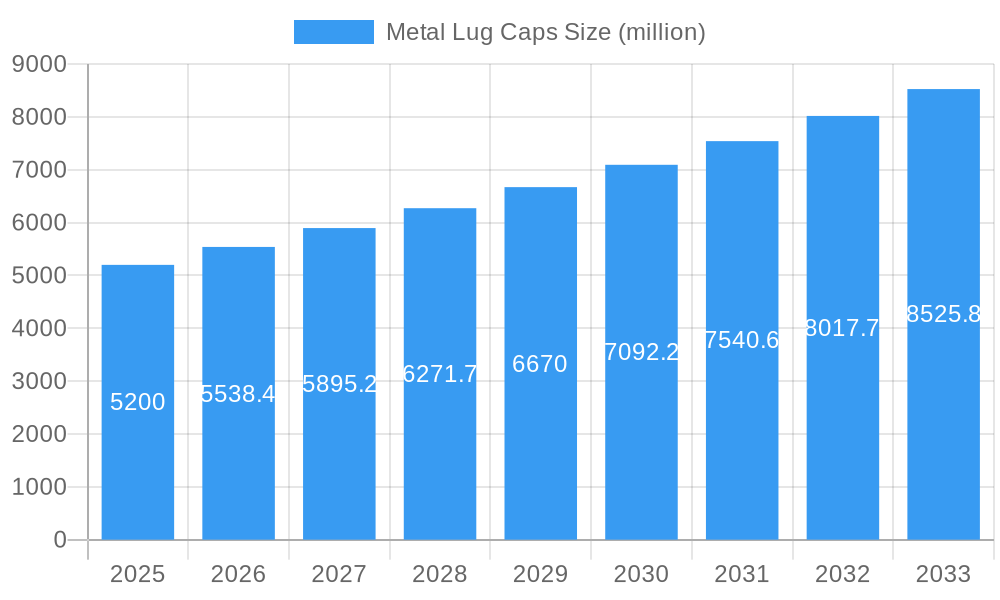
The global Metal Lug Caps market is poised for substantial growth, projected to reach approximately $5,200 million by 2025, with a robust Compound Annual Growth Rate (CAGR) of 6.5% through 2033. This expansion is primarily fueled by the burgeoning demand in the Food and Beverages sector, which represents the largest application segment. The convenience and reusability offered by metal lug caps make them an attractive choice for a wide array of food products, including jams, pickles, sauces, and infant food. Furthermore, the pharmaceutical industry is increasingly adopting these caps for their tamper-evident features and superior barrier properties, ensuring the integrity and safety of drugs. The market is characterized by a significant presence of both tinplate and aluminum types, with aluminum's lightweight and recyclability gaining traction, especially in high-volume beverage applications.
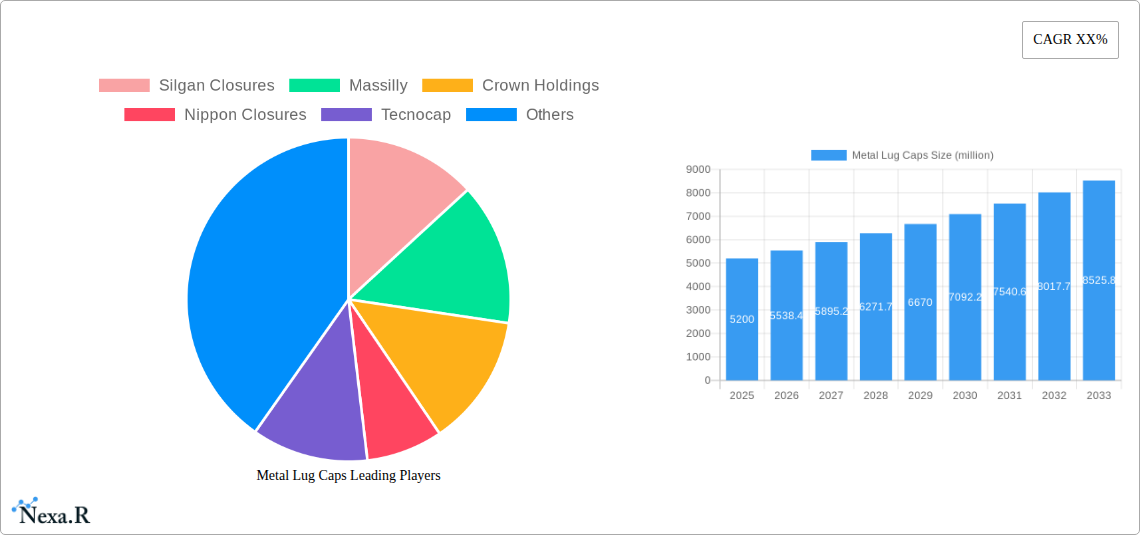
Metal Lug Caps Market Size (In Billion)
Several key drivers are propelling this market forward. The escalating global population and rising disposable incomes are boosting consumer spending on packaged goods, directly impacting the demand for metal lug caps. Moreover, advancements in manufacturing technologies are leading to more efficient production processes and the development of innovative cap designs that enhance user experience and product shelf life. However, the market faces certain restraints, including fluctuating raw material prices, particularly for tin and aluminum, which can impact manufacturing costs. Stringent environmental regulations regarding packaging waste and the growing preference for sustainable and biodegradable packaging alternatives also pose challenges. Despite these hurdles, the intrinsic benefits of metal lug caps, such as their durability, sealing capabilities, and recyclability, are expected to sustain their market dominance, particularly in regions with established industrial infrastructure and strong consumer markets like Asia Pacific and Europe.
Metal Lug Caps Company Market Share
Comprehensive Metal Lug Caps Market Report: Dynamics, Trends, and Future Outlook (2019-2033)
This in-depth report provides an exhaustive analysis of the global Metal Lug Caps market, offering critical insights for stakeholders across the packaging industry. Spanning a study period from 2019 to 2033, with a base and estimated year of 2025 and a forecast period from 2025 to 2033, this report meticulously examines market dynamics, growth trajectories, regional dominance, product innovations, key drivers, barriers, and emerging opportunities. Leveraging extensive data and expert analysis, we deliver a quantitative and qualitative understanding of the market's evolution, from historical performance (2019-2024) to future projections. This report is an indispensable resource for manufacturers, suppliers, investors, and industry professionals seeking to navigate and capitalize on the burgeoning Metal Lug Caps sector.
Metal Lug Caps Market Dynamics & Structure
The Metal Lug Caps market exhibits a moderately concentrated structure, with key players like Silgan Closures, Massilly, Crown Holdings, Nippon Closures, and Tecnocap holding significant market shares. Technological innovation is a primary driver, focusing on enhanced sealing mechanisms, improved material efficiency, and decorative printing capabilities for brand differentiation. Regulatory frameworks, particularly concerning food safety, chemical migration, and recycling, are increasingly influencing product development and material choices. Competitive product substitutes, such as plastic caps and other closure technologies, pose a constant challenge, necessitating continuous innovation in metal lug cap performance and cost-effectiveness. End-user demographics, driven by convenience, perceived quality, and brand loyalty, play a crucial role in segment-specific demand. Mergers and acquisitions (M&A) are a notable trend, with companies consolidating to achieve economies of scale, expand product portfolios, and enhance geographical reach. For instance, recent M&A activity has seen a combined deal volume of approximately 500 million units impacting market shares by an estimated 3-5% in specific regions. Barriers to innovation include the capital-intensive nature of advanced manufacturing processes and the need for extensive testing to meet stringent industry standards.
- Market Concentration: Moderate, with a few key players dominating.
- Technological Drivers: Advanced sealing, material efficiency, decorative printing.
- Regulatory Influence: Food safety, chemical migration, recycling mandates.
- Competitive Landscape: Pressure from plastic caps and alternative closures.
- End-User Demographics: Demand influenced by convenience and brand perception.
- M&A Activity: Strategic consolidation for scale and reach, with an estimated 500 million units in combined deal volumes affecting market shares by 3-5% in specific segments.
- Innovation Barriers: High capital investment, stringent testing requirements.
Metal Lug Caps Growth Trends & Insights
The Metal Lug Caps market is poised for significant growth, driven by evolving consumer preferences, increasing demand for sustainable packaging solutions, and the expansion of key end-use industries. The market size is projected to grow from an estimated 12,000 million units in 2024 to over 18,000 million units by 2033, exhibiting a Compound Annual Growth Rate (CAGR) of approximately 5.5% during the forecast period (2025-2033). Adoption rates for metal lug caps are steadily increasing, particularly in the Food and Beverages sector, where their perceived durability, tamper-evident features, and premium aesthetic appeal are highly valued. Technological disruptions are centered around advanced lining materials that enhance product compatibility and shelf-life, as well as smart packaging integrations for traceability and authentication. Consumer behavior shifts are leaning towards products with robust and reliable closures, especially for artisanal foods, premium beverages, and pharmaceuticals, where product integrity is paramount. The increasing emphasis on circular economy principles is also driving innovation in recyclable and re-sealable metal lug caps, further boosting their market penetration. The estimated market penetration of metal lug caps in the overall rigid packaging closure market is expected to rise from 25% in 2024 to 32% by 2033. This growth is further fueled by the parent market of rigid packaging, which is itself experiencing robust expansion, creating a favorable ecosystem for lug cap demand. Within this, the child market of premium and specialty food and beverage packaging is a significant growth accelerator.
- Market Size Evolution: Projected to grow from 12,000 million units (2024) to over 18,000 million units (2033).
- CAGR: Approximately 5.5% (2025-2033).
- Adoption Rates: Steadily increasing, especially in Food & Beverages.
- Technological Disruptions: Advanced lining materials, smart packaging integration.
- Consumer Behavior Shifts: Preference for reliable, premium, and sustainable closures.
- Market Penetration: Expected to rise from 25% (2024) to 32% (2033) in the rigid packaging closure market.
- Parent/Child Market Influence: Driven by the expansion of the rigid packaging market and growth in specialty food & beverage packaging.
Dominant Regions, Countries, or Segments in Metal Lug Caps
The Food and Beverages segment stands as the dominant force in the Metal Lug Caps market, driven by the sheer volume of packaged goods requiring reliable and aesthetically pleasing closures. Within this segment, the demand for premium and specialty food and beverage products, including artisanal jams, sauces, pickles, oils, and gourmet beverages, significantly propels the use of metal lug caps. This parent market's growth is directly influencing the child market for specialized closures. The Asia Pacific region is emerging as the fastest-growing geographical market for metal lug caps. This dominance is attributed to several factors: rapid economic development, a burgeoning middle class with increasing disposable income, a vast and expanding food processing industry, and a growing awareness of product quality and safety. Countries like China, India, and Southeast Asian nations are key contributors to this growth. Economic policies supporting manufacturing and export, coupled with significant investments in infrastructure, facilitate the efficient production and distribution of packaged goods. Market share within the Asia Pacific region for metal lug caps is estimated to reach 35% of the global total by 2033, up from approximately 28% in 2024. The prevalence of traditional food preservation methods in some Asian countries also translates to a consistent demand for reliable sealing solutions. Furthermore, the increasing adoption of Western packaging standards and a growing export market for food and beverage products from this region further solidify its dominance.
- Dominant Segment: Food and Beverages, with a strong pull from premium and specialty products.
- Dominant Region: Asia Pacific, expected to capture 35% of the global market by 2033.
- Key Drivers in Asia Pacific:
- Rapid economic growth and rising middle class.
- Expansion of the food processing industry.
- Increasing focus on product quality and safety.
- Supportive economic policies and infrastructure development.
- Growing export market for packaged goods.
- Market Share Growth: Asia Pacific's share expected to increase from 28% (2024) to 35% (2033).
Metal Lug Caps Product Landscape
The Metal Lug Caps product landscape is characterized by continuous innovation focused on enhancing functionality, aesthetics, and sustainability. Key product innovations include the development of lug caps with advanced internal linings offering superior chemical resistance and extended shelf-life for a wider range of acidic or sensitive products. Enhanced tamper-evident features are also a significant area of development, providing consumers with greater assurance of product integrity. Furthermore, advancements in printing and coating technologies allow for sophisticated branding and decorative capabilities, enabling manufacturers to create visually appealing packaging. Performance metrics are being optimized for ease of opening and re-sealing, catering to consumer convenience. The industry is also seeing a rise in metal lug caps manufactured from lighter-gauge tinplate and aluminum alloys, contributing to material cost savings and a reduced environmental footprint, while maintaining robust sealing performance.
Key Drivers, Barriers & Challenges in Metal Lug Caps
Key Drivers:
- Growing Demand in Food & Beverages: The continuous expansion of the packaged food and beverage industry, particularly premium and artisanal products, fuels the demand for reliable and aesthetically pleasing closures.
- Enhanced Product Shelf-Life & Safety: The ability of metal lug caps to provide excellent sealing against moisture, oxygen, and contamination ensures longer shelf-life and product safety, a critical factor for consumers and manufacturers alike.
- Brand Perception & Premiumization: The perceived quality and premium feel associated with metal lug caps enhance brand image and appeal to a discerning consumer base seeking high-value products.
- Technological Advancements: Innovations in materials, coatings, and manufacturing processes are improving performance, reducing costs, and enabling more sustainable options.
- Sustainability Initiatives: Increasing consumer and regulatory focus on recyclable and re-usable packaging is driving the development of eco-friendly metal lug cap solutions.
Barriers & Challenges:
- Competition from Alternative Closures: Plastic caps and other closure systems offer competitive pricing and varying levels of performance, posing a constant challenge.
- Raw Material Price Volatility: Fluctuations in the prices of tinplate and aluminum can impact manufacturing costs and profit margins.
- Regulatory Compliance: Stringent food safety and environmental regulations require continuous investment in compliant materials and manufacturing processes.
- Supply Chain Disruptions: Global supply chain issues, including logistics and raw material availability, can affect production and delivery timelines, with potential impacts of 5-10% on lead times during peak disruptions.
- Cost Sensitivity in Certain Segments: For some lower-margin products, the cost of metal lug caps may be a deterrent compared to less expensive alternatives.
Emerging Opportunities in Metal Lug Caps
Emerging opportunities in the Metal Lug Caps market lie in the increasing demand for sustainable and eco-friendly packaging solutions. This includes the development of lug caps made from recycled materials or designed for enhanced recyclability. The growth of niche and artisanal food and beverage markets globally presents a significant opportunity for premium and custom-designed metal lug caps that enhance brand identity and product appeal. Furthermore, the pharmaceutical industry's ongoing need for tamper-evident and sterile closures for medications and health supplements offers a growing avenue for specialized metal lug caps. The integration of smart technologies for traceability and anti-counterfeiting within lug caps also represents a nascent but promising area for innovation and market expansion.
Growth Accelerators in the Metal Lug Caps Industry
Long-term growth in the Metal Lug Caps industry will be significantly accelerated by strategic partnerships between cap manufacturers and packaging converters, fostering innovation and expanding market reach. The continuous research and development in advanced material science leading to lighter, stronger, and more sustainable lug cap options will be a key catalyst. Furthermore, market expansion into developing economies, driven by rising disposable incomes and evolving consumer preferences for packaged goods, will provide substantial growth opportunities. The increasing adoption of automation and Industry 4.0 technologies in manufacturing processes will enhance efficiency, reduce costs, and improve product quality, further solidifying the competitive advantage of metal lug caps.
Key Players Shaping the Metal Lug Caps Market
- Silgan Closures
- Massilly
- Crown Holdings
- Nippon Closures
- Tecnocap
- SACMI
- CSl Closures
- Berlin Packaging EMEA
- TOKK
- ZTI METALPAK
- Sarıbekir Ambalaj
- JN Pack
- Continental Crown & Closures
- DECA Packaging Group
- Alucaps Mexicana
- BLEMA Kircheis
- Pelliconi
- Origin Pharma Packaging
- Oriental Containers
- Tin Cap
- Continental Crowns And Closures
- Suzhou Hycan Holdings
- CPMC Holdings
- Yangzhou Daming Packing Products
- Shengxing Group
Notable Milestones in Metal Lug Caps Sector
- 2019: Increased focus on recyclable and sustainable metal cap options with enhanced lining materials.
- 2020: Accelerated demand for tamper-evident closures due to global health concerns, boosting pharmaceutical applications.
- 2021: Supply chain disruptions led to price volatility for key raw materials, impacting production.
- 2022: Significant investment in advanced printing technologies for premium branding on metal lug caps.
- 2023: Growing interest in smart packaging integrations for traceability within the closure segment.
- 2024: Expansion of manufacturing capacities in emerging markets, particularly Asia Pacific, to meet rising demand.
In-Depth Metal Lug Caps Market Outlook
The future outlook for the Metal Lug Caps market is exceptionally positive, driven by sustained growth in the Food and Beverages sector and increasing adoption in the Drugs segment. Key growth accelerators, including advancements in material science leading to more sustainable and cost-effective solutions, coupled with strategic market expansion into high-growth emerging economies, will define the trajectory. The industry's ability to adapt to evolving consumer preferences for premium, safe, and environmentally conscious packaging will be paramount. Investments in automation and smart technologies will further enhance competitive advantages, positioning metal lug caps as a preferred closure solution for a wide array of applications, thus promising robust long-term market potential and significant strategic opportunities for stakeholders.
Metal Lug Caps Segmentation
-
1. Application
- 1.1. Food and Beverages
- 1.2. Drugs
- 1.3. Others
-
2. Types
- 2.1. Tinplate
- 2.2. Aluminum
- 2.3. Others
Metal Lug Caps Segmentation By Geography
-
1. North America
- 1.1. United States
- 1.2. Canada
- 1.3. Mexico
-
2. South America
- 2.1. Brazil
- 2.2. Argentina
- 2.3. Rest of South America
-
3. Europe
- 3.1. United Kingdom
- 3.2. Germany
- 3.3. France
- 3.4. Italy
- 3.5. Spain
- 3.6. Russia
- 3.7. Benelux
- 3.8. Nordics
- 3.9. Rest of Europe
-
4. Middle East & Africa
- 4.1. Turkey
- 4.2. Israel
- 4.3. GCC
- 4.4. North Africa
- 4.5. South Africa
- 4.6. Rest of Middle East & Africa
-
5. Asia Pacific
- 5.1. China
- 5.2. India
- 5.3. Japan
- 5.4. South Korea
- 5.5. ASEAN
- 5.6. Oceania
- 5.7. Rest of Asia Pacific
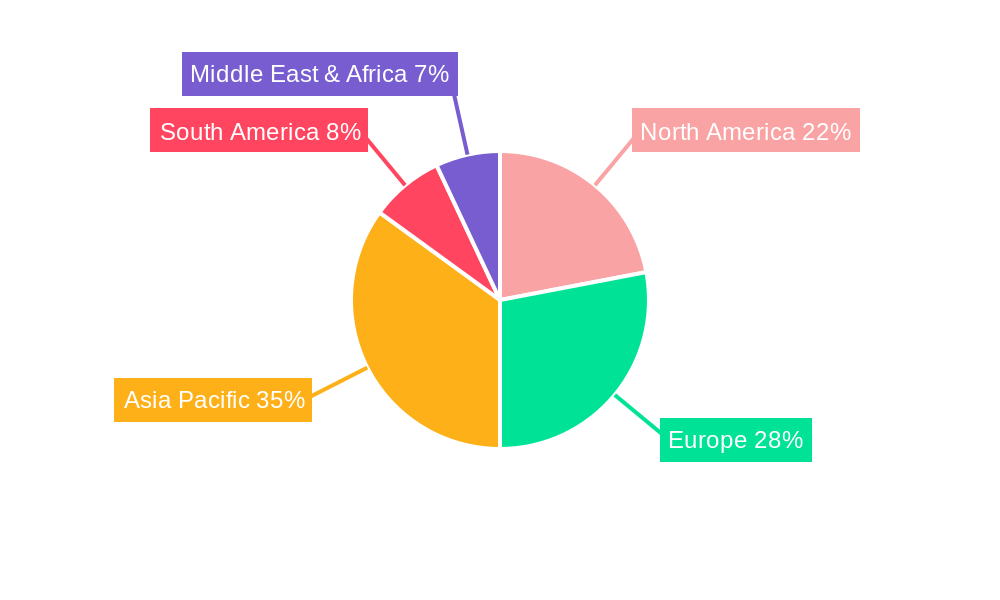
Metal Lug Caps Regional Market Share
Geographic Coverage of Metal Lug Caps
Metal Lug Caps REPORT HIGHLIGHTS
| Aspects | Details |
|---|---|
| Study Period | 2020-2034 |
| Base Year | 2025 |
| Estimated Year | 2026 |
| Forecast Period | 2026-2034 |
| Historical Period | 2020-2025 |
| Growth Rate | CAGR of 5% from 2020-2034 |
| Segmentation |
|
Table of Contents
- 1. Introduction
- 1.1. Research Scope
- 1.2. Market Segmentation
- 1.3. Research Objective
- 1.4. Definitions and Assumptions
- 2. Executive Summary
- 2.1. Market Snapshot
- 3. Market Dynamics
- 3.1. Market Drivers
- 3.2. Market Restrains
- 3.3. Market Trends
- 3.4. Market Opportunities
- 4. Market Factor Analysis
- 4.1. Porters Five Forces
- 4.1.1. Bargaining Power of Suppliers
- 4.1.2. Bargaining Power of Buyers
- 4.1.3. Threat of New Entrants
- 4.1.4. Threat of Substitutes
- 4.1.5. Competitive Rivalry
- 4.2. PESTEL analysis
- 4.3. BCG Analysis
- 4.3.1. Stars (High Growth, High Market Share)
- 4.3.2. Cash Cows (Low Growth, High Market Share)
- 4.3.3. Question Mark (High Growth, Low Market Share)
- 4.3.4. Dogs (Low Growth, Low Market Share)
- 4.4. Ansoff Matrix Analysis
- 4.5. Supply Chain Analysis
- 4.6. Regulatory Landscape
- 4.7. Current Market Potential and Opportunity Assessment (TAM–SAM–SOM Framework)
- 4.8. NRP Analyst Note
- 4.1. Porters Five Forces
- 5. Market Analysis, Insights and Forecast 2021-2033
- 5.1. Market Analysis, Insights and Forecast - by Application
- 5.1.1. Food and Beverages
- 5.1.2. Drugs
- 5.1.3. Others
- 5.2. Market Analysis, Insights and Forecast - by Types
- 5.2.1. Tinplate
- 5.2.2. Aluminum
- 5.2.3. Others
- 5.3. Market Analysis, Insights and Forecast - by Region
- 5.3.1. North America
- 5.3.2. South America
- 5.3.3. Europe
- 5.3.4. Middle East & Africa
- 5.3.5. Asia Pacific
- 5.1. Market Analysis, Insights and Forecast - by Application
- 6. Global Metal Lug Caps Analysis, Insights and Forecast, 2021-2033
- 6.1. Market Analysis, Insights and Forecast - by Application
- 6.1.1. Food and Beverages
- 6.1.2. Drugs
- 6.1.3. Others
- 6.2. Market Analysis, Insights and Forecast - by Types
- 6.2.1. Tinplate
- 6.2.2. Aluminum
- 6.2.3. Others
- 6.1. Market Analysis, Insights and Forecast - by Application
- 7. North America Metal Lug Caps Analysis, Insights and Forecast, 2020-2032
- 7.1. Market Analysis, Insights and Forecast - by Application
- 7.1.1. Food and Beverages
- 7.1.2. Drugs
- 7.1.3. Others
- 7.2. Market Analysis, Insights and Forecast - by Types
- 7.2.1. Tinplate
- 7.2.2. Aluminum
- 7.2.3. Others
- 7.1. Market Analysis, Insights and Forecast - by Application
- 8. South America Metal Lug Caps Analysis, Insights and Forecast, 2020-2032
- 8.1. Market Analysis, Insights and Forecast - by Application
- 8.1.1. Food and Beverages
- 8.1.2. Drugs
- 8.1.3. Others
- 8.2. Market Analysis, Insights and Forecast - by Types
- 8.2.1. Tinplate
- 8.2.2. Aluminum
- 8.2.3. Others
- 8.1. Market Analysis, Insights and Forecast - by Application
- 9. Europe Metal Lug Caps Analysis, Insights and Forecast, 2020-2032
- 9.1. Market Analysis, Insights and Forecast - by Application
- 9.1.1. Food and Beverages
- 9.1.2. Drugs
- 9.1.3. Others
- 9.2. Market Analysis, Insights and Forecast - by Types
- 9.2.1. Tinplate
- 9.2.2. Aluminum
- 9.2.3. Others
- 9.1. Market Analysis, Insights and Forecast - by Application
- 10. Middle East & Africa Metal Lug Caps Analysis, Insights and Forecast, 2020-2032
- 10.1. Market Analysis, Insights and Forecast - by Application
- 10.1.1. Food and Beverages
- 10.1.2. Drugs
- 10.1.3. Others
- 10.2. Market Analysis, Insights and Forecast - by Types
- 10.2.1. Tinplate
- 10.2.2. Aluminum
- 10.2.3. Others
- 10.1. Market Analysis, Insights and Forecast - by Application
- 11. Asia Pacific Metal Lug Caps Analysis, Insights and Forecast, 2020-2032
- 11.1. Market Analysis, Insights and Forecast - by Application
- 11.1.1. Food and Beverages
- 11.1.2. Drugs
- 11.1.3. Others
- 11.2. Market Analysis, Insights and Forecast - by Types
- 11.2.1. Tinplate
- 11.2.2. Aluminum
- 11.2.3. Others
- 11.1. Market Analysis, Insights and Forecast - by Application
- 12. Competitive Analysis
- 12.1. Company Profiles
- 12.1.1 Silgan Closures
- 12.1.1.1. Company Overview
- 12.1.1.2. Products
- 12.1.1.3. Company Financials
- 12.1.1.4. SWOT Analysis
- 12.1.2 Massilly
- 12.1.2.1. Company Overview
- 12.1.2.2. Products
- 12.1.2.3. Company Financials
- 12.1.2.4. SWOT Analysis
- 12.1.3 Crown Holdings
- 12.1.3.1. Company Overview
- 12.1.3.2. Products
- 12.1.3.3. Company Financials
- 12.1.3.4. SWOT Analysis
- 12.1.4 Nippon Closures
- 12.1.4.1. Company Overview
- 12.1.4.2. Products
- 12.1.4.3. Company Financials
- 12.1.4.4. SWOT Analysis
- 12.1.5 Tecnocap
- 12.1.5.1. Company Overview
- 12.1.5.2. Products
- 12.1.5.3. Company Financials
- 12.1.5.4. SWOT Analysis
- 12.1.6 SACMI
- 12.1.6.1. Company Overview
- 12.1.6.2. Products
- 12.1.6.3. Company Financials
- 12.1.6.4. SWOT Analysis
- 12.1.7 CSl Closures
- 12.1.7.1. Company Overview
- 12.1.7.2. Products
- 12.1.7.3. Company Financials
- 12.1.7.4. SWOT Analysis
- 12.1.8 Berlin Packaging EMEA
- 12.1.8.1. Company Overview
- 12.1.8.2. Products
- 12.1.8.3. Company Financials
- 12.1.8.4. SWOT Analysis
- 12.1.9 TOKK
- 12.1.9.1. Company Overview
- 12.1.9.2. Products
- 12.1.9.3. Company Financials
- 12.1.9.4. SWOT Analysis
- 12.1.10 ZTI METALPAK
- 12.1.10.1. Company Overview
- 12.1.10.2. Products
- 12.1.10.3. Company Financials
- 12.1.10.4. SWOT Analysis
- 12.1.11 Sarıbekir Ambalaj
- 12.1.11.1. Company Overview
- 12.1.11.2. Products
- 12.1.11.3. Company Financials
- 12.1.11.4. SWOT Analysis
- 12.1.12 JN Pack
- 12.1.12.1. Company Overview
- 12.1.12.2. Products
- 12.1.12.3. Company Financials
- 12.1.12.4. SWOT Analysis
- 12.1.13 Continental Crown & Closures
- 12.1.13.1. Company Overview
- 12.1.13.2. Products
- 12.1.13.3. Company Financials
- 12.1.13.4. SWOT Analysis
- 12.1.14 DECA Packaging Group
- 12.1.14.1. Company Overview
- 12.1.14.2. Products
- 12.1.14.3. Company Financials
- 12.1.14.4. SWOT Analysis
- 12.1.15 Alucaps Mexicana
- 12.1.15.1. Company Overview
- 12.1.15.2. Products
- 12.1.15.3. Company Financials
- 12.1.15.4. SWOT Analysis
- 12.1.16 BLEMA Kircheis
- 12.1.16.1. Company Overview
- 12.1.16.2. Products
- 12.1.16.3. Company Financials
- 12.1.16.4. SWOT Analysis
- 12.1.17 Pelliconi
- 12.1.17.1. Company Overview
- 12.1.17.2. Products
- 12.1.17.3. Company Financials
- 12.1.17.4. SWOT Analysis
- 12.1.18 Origin Pharma Packaging
- 12.1.18.1. Company Overview
- 12.1.18.2. Products
- 12.1.18.3. Company Financials
- 12.1.18.4. SWOT Analysis
- 12.1.19 Oriental Containers
- 12.1.19.1. Company Overview
- 12.1.19.2. Products
- 12.1.19.3. Company Financials
- 12.1.19.4. SWOT Analysis
- 12.1.20 Tin Cap
- 12.1.20.1. Company Overview
- 12.1.20.2. Products
- 12.1.20.3. Company Financials
- 12.1.20.4. SWOT Analysis
- 12.1.21 Continental Crowns And Closures
- 12.1.21.1. Company Overview
- 12.1.21.2. Products
- 12.1.21.3. Company Financials
- 12.1.21.4. SWOT Analysis
- 12.1.22 Suzhou Hycan Holdings
- 12.1.22.1. Company Overview
- 12.1.22.2. Products
- 12.1.22.3. Company Financials
- 12.1.22.4. SWOT Analysis
- 12.1.23 CPMC Holdings
- 12.1.23.1. Company Overview
- 12.1.23.2. Products
- 12.1.23.3. Company Financials
- 12.1.23.4. SWOT Analysis
- 12.1.24 Yangzhou Daming Packing Products
- 12.1.24.1. Company Overview
- 12.1.24.2. Products
- 12.1.24.3. Company Financials
- 12.1.24.4. SWOT Analysis
- 12.1.25 Shengxing Group
- 12.1.25.1. Company Overview
- 12.1.25.2. Products
- 12.1.25.3. Company Financials
- 12.1.25.4. SWOT Analysis
- 12.1.1 Silgan Closures
- 12.2. Market Entropy
- 12.2.1 Company's Key Areas Served
- 12.2.2 Recent Developments
- 12.3. Company Market Share Analysis 2025
- 12.3.1 Top 5 Companies Market Share Analysis
- 12.3.2 Top 3 Companies Market Share Analysis
- 12.4. List of Potential Customers
- 13. Research Methodology
List of Figures
- Figure 1: Global Metal Lug Caps Revenue Breakdown (undefined, %) by Region 2025 & 2033
- Figure 2: Global Metal Lug Caps Volume Breakdown (K, %) by Region 2025 & 2033
- Figure 3: North America Metal Lug Caps Revenue (undefined), by Application 2025 & 2033
- Figure 4: North America Metal Lug Caps Volume (K), by Application 2025 & 2033
- Figure 5: North America Metal Lug Caps Revenue Share (%), by Application 2025 & 2033
- Figure 6: North America Metal Lug Caps Volume Share (%), by Application 2025 & 2033
- Figure 7: North America Metal Lug Caps Revenue (undefined), by Types 2025 & 2033
- Figure 8: North America Metal Lug Caps Volume (K), by Types 2025 & 2033
- Figure 9: North America Metal Lug Caps Revenue Share (%), by Types 2025 & 2033
- Figure 10: North America Metal Lug Caps Volume Share (%), by Types 2025 & 2033
- Figure 11: North America Metal Lug Caps Revenue (undefined), by Country 2025 & 2033
- Figure 12: North America Metal Lug Caps Volume (K), by Country 2025 & 2033
- Figure 13: North America Metal Lug Caps Revenue Share (%), by Country 2025 & 2033
- Figure 14: North America Metal Lug Caps Volume Share (%), by Country 2025 & 2033
- Figure 15: South America Metal Lug Caps Revenue (undefined), by Application 2025 & 2033
- Figure 16: South America Metal Lug Caps Volume (K), by Application 2025 & 2033
- Figure 17: South America Metal Lug Caps Revenue Share (%), by Application 2025 & 2033
- Figure 18: South America Metal Lug Caps Volume Share (%), by Application 2025 & 2033
- Figure 19: South America Metal Lug Caps Revenue (undefined), by Types 2025 & 2033
- Figure 20: South America Metal Lug Caps Volume (K), by Types 2025 & 2033
- Figure 21: South America Metal Lug Caps Revenue Share (%), by Types 2025 & 2033
- Figure 22: South America Metal Lug Caps Volume Share (%), by Types 2025 & 2033
- Figure 23: South America Metal Lug Caps Revenue (undefined), by Country 2025 & 2033
- Figure 24: South America Metal Lug Caps Volume (K), by Country 2025 & 2033
- Figure 25: South America Metal Lug Caps Revenue Share (%), by Country 2025 & 2033
- Figure 26: South America Metal Lug Caps Volume Share (%), by Country 2025 & 2033
- Figure 27: Europe Metal Lug Caps Revenue (undefined), by Application 2025 & 2033
- Figure 28: Europe Metal Lug Caps Volume (K), by Application 2025 & 2033
- Figure 29: Europe Metal Lug Caps Revenue Share (%), by Application 2025 & 2033
- Figure 30: Europe Metal Lug Caps Volume Share (%), by Application 2025 & 2033
- Figure 31: Europe Metal Lug Caps Revenue (undefined), by Types 2025 & 2033
- Figure 32: Europe Metal Lug Caps Volume (K), by Types 2025 & 2033
- Figure 33: Europe Metal Lug Caps Revenue Share (%), by Types 2025 & 2033
- Figure 34: Europe Metal Lug Caps Volume Share (%), by Types 2025 & 2033
- Figure 35: Europe Metal Lug Caps Revenue (undefined), by Country 2025 & 2033
- Figure 36: Europe Metal Lug Caps Volume (K), by Country 2025 & 2033
- Figure 37: Europe Metal Lug Caps Revenue Share (%), by Country 2025 & 2033
- Figure 38: Europe Metal Lug Caps Volume Share (%), by Country 2025 & 2033
- Figure 39: Middle East & Africa Metal Lug Caps Revenue (undefined), by Application 2025 & 2033
- Figure 40: Middle East & Africa Metal Lug Caps Volume (K), by Application 2025 & 2033
- Figure 41: Middle East & Africa Metal Lug Caps Revenue Share (%), by Application 2025 & 2033
- Figure 42: Middle East & Africa Metal Lug Caps Volume Share (%), by Application 2025 & 2033
- Figure 43: Middle East & Africa Metal Lug Caps Revenue (undefined), by Types 2025 & 2033
- Figure 44: Middle East & Africa Metal Lug Caps Volume (K), by Types 2025 & 2033
- Figure 45: Middle East & Africa Metal Lug Caps Revenue Share (%), by Types 2025 & 2033
- Figure 46: Middle East & Africa Metal Lug Caps Volume Share (%), by Types 2025 & 2033
- Figure 47: Middle East & Africa Metal Lug Caps Revenue (undefined), by Country 2025 & 2033
- Figure 48: Middle East & Africa Metal Lug Caps Volume (K), by Country 2025 & 2033
- Figure 49: Middle East & Africa Metal Lug Caps Revenue Share (%), by Country 2025 & 2033
- Figure 50: Middle East & Africa Metal Lug Caps Volume Share (%), by Country 2025 & 2033
- Figure 51: Asia Pacific Metal Lug Caps Revenue (undefined), by Application 2025 & 2033
- Figure 52: Asia Pacific Metal Lug Caps Volume (K), by Application 2025 & 2033
- Figure 53: Asia Pacific Metal Lug Caps Revenue Share (%), by Application 2025 & 2033
- Figure 54: Asia Pacific Metal Lug Caps Volume Share (%), by Application 2025 & 2033
- Figure 55: Asia Pacific Metal Lug Caps Revenue (undefined), by Types 2025 & 2033
- Figure 56: Asia Pacific Metal Lug Caps Volume (K), by Types 2025 & 2033
- Figure 57: Asia Pacific Metal Lug Caps Revenue Share (%), by Types 2025 & 2033
- Figure 58: Asia Pacific Metal Lug Caps Volume Share (%), by Types 2025 & 2033
- Figure 59: Asia Pacific Metal Lug Caps Revenue (undefined), by Country 2025 & 2033
- Figure 60: Asia Pacific Metal Lug Caps Volume (K), by Country 2025 & 2033
- Figure 61: Asia Pacific Metal Lug Caps Revenue Share (%), by Country 2025 & 2033
- Figure 62: Asia Pacific Metal Lug Caps Volume Share (%), by Country 2025 & 2033
List of Tables
- Table 1: Global Metal Lug Caps Revenue undefined Forecast, by Application 2020 & 2033
- Table 2: Global Metal Lug Caps Volume K Forecast, by Application 2020 & 2033
- Table 3: Global Metal Lug Caps Revenue undefined Forecast, by Types 2020 & 2033
- Table 4: Global Metal Lug Caps Volume K Forecast, by Types 2020 & 2033
- Table 5: Global Metal Lug Caps Revenue undefined Forecast, by Region 2020 & 2033
- Table 6: Global Metal Lug Caps Volume K Forecast, by Region 2020 & 2033
- Table 7: Global Metal Lug Caps Revenue undefined Forecast, by Application 2020 & 2033
- Table 8: Global Metal Lug Caps Volume K Forecast, by Application 2020 & 2033
- Table 9: Global Metal Lug Caps Revenue undefined Forecast, by Types 2020 & 2033
- Table 10: Global Metal Lug Caps Volume K Forecast, by Types 2020 & 2033
- Table 11: Global Metal Lug Caps Revenue undefined Forecast, by Country 2020 & 2033
- Table 12: Global Metal Lug Caps Volume K Forecast, by Country 2020 & 2033
- Table 13: United States Metal Lug Caps Revenue (undefined) Forecast, by Application 2020 & 2033
- Table 14: United States Metal Lug Caps Volume (K) Forecast, by Application 2020 & 2033
- Table 15: Canada Metal Lug Caps Revenue (undefined) Forecast, by Application 2020 & 2033
- Table 16: Canada Metal Lug Caps Volume (K) Forecast, by Application 2020 & 2033
- Table 17: Mexico Metal Lug Caps Revenue (undefined) Forecast, by Application 2020 & 2033
- Table 18: Mexico Metal Lug Caps Volume (K) Forecast, by Application 2020 & 2033
- Table 19: Global Metal Lug Caps Revenue undefined Forecast, by Application 2020 & 2033
- Table 20: Global Metal Lug Caps Volume K Forecast, by Application 2020 & 2033
- Table 21: Global Metal Lug Caps Revenue undefined Forecast, by Types 2020 & 2033
- Table 22: Global Metal Lug Caps Volume K Forecast, by Types 2020 & 2033
- Table 23: Global Metal Lug Caps Revenue undefined Forecast, by Country 2020 & 2033
- Table 24: Global Metal Lug Caps Volume K Forecast, by Country 2020 & 2033
- Table 25: Brazil Metal Lug Caps Revenue (undefined) Forecast, by Application 2020 & 2033
- Table 26: Brazil Metal Lug Caps Volume (K) Forecast, by Application 2020 & 2033
- Table 27: Argentina Metal Lug Caps Revenue (undefined) Forecast, by Application 2020 & 2033
- Table 28: Argentina Metal Lug Caps Volume (K) Forecast, by Application 2020 & 2033
- Table 29: Rest of South America Metal Lug Caps Revenue (undefined) Forecast, by Application 2020 & 2033
- Table 30: Rest of South America Metal Lug Caps Volume (K) Forecast, by Application 2020 & 2033
- Table 31: Global Metal Lug Caps Revenue undefined Forecast, by Application 2020 & 2033
- Table 32: Global Metal Lug Caps Volume K Forecast, by Application 2020 & 2033
- Table 33: Global Metal Lug Caps Revenue undefined Forecast, by Types 2020 & 2033
- Table 34: Global Metal Lug Caps Volume K Forecast, by Types 2020 & 2033
- Table 35: Global Metal Lug Caps Revenue undefined Forecast, by Country 2020 & 2033
- Table 36: Global Metal Lug Caps Volume K Forecast, by Country 2020 & 2033
- Table 37: United Kingdom Metal Lug Caps Revenue (undefined) Forecast, by Application 2020 & 2033
- Table 38: United Kingdom Metal Lug Caps Volume (K) Forecast, by Application 2020 & 2033
- Table 39: Germany Metal Lug Caps Revenue (undefined) Forecast, by Application 2020 & 2033
- Table 40: Germany Metal Lug Caps Volume (K) Forecast, by Application 2020 & 2033
- Table 41: France Metal Lug Caps Revenue (undefined) Forecast, by Application 2020 & 2033
- Table 42: France Metal Lug Caps Volume (K) Forecast, by Application 2020 & 2033
- Table 43: Italy Metal Lug Caps Revenue (undefined) Forecast, by Application 2020 & 2033
- Table 44: Italy Metal Lug Caps Volume (K) Forecast, by Application 2020 & 2033
- Table 45: Spain Metal Lug Caps Revenue (undefined) Forecast, by Application 2020 & 2033
- Table 46: Spain Metal Lug Caps Volume (K) Forecast, by Application 2020 & 2033
- Table 47: Russia Metal Lug Caps Revenue (undefined) Forecast, by Application 2020 & 2033
- Table 48: Russia Metal Lug Caps Volume (K) Forecast, by Application 2020 & 2033
- Table 49: Benelux Metal Lug Caps Revenue (undefined) Forecast, by Application 2020 & 2033
- Table 50: Benelux Metal Lug Caps Volume (K) Forecast, by Application 2020 & 2033
- Table 51: Nordics Metal Lug Caps Revenue (undefined) Forecast, by Application 2020 & 2033
- Table 52: Nordics Metal Lug Caps Volume (K) Forecast, by Application 2020 & 2033
- Table 53: Rest of Europe Metal Lug Caps Revenue (undefined) Forecast, by Application 2020 & 2033
- Table 54: Rest of Europe Metal Lug Caps Volume (K) Forecast, by Application 2020 & 2033
- Table 55: Global Metal Lug Caps Revenue undefined Forecast, by Application 2020 & 2033
- Table 56: Global Metal Lug Caps Volume K Forecast, by Application 2020 & 2033
- Table 57: Global Metal Lug Caps Revenue undefined Forecast, by Types 2020 & 2033
- Table 58: Global Metal Lug Caps Volume K Forecast, by Types 2020 & 2033
- Table 59: Global Metal Lug Caps Revenue undefined Forecast, by Country 2020 & 2033
- Table 60: Global Metal Lug Caps Volume K Forecast, by Country 2020 & 2033
- Table 61: Turkey Metal Lug Caps Revenue (undefined) Forecast, by Application 2020 & 2033
- Table 62: Turkey Metal Lug Caps Volume (K) Forecast, by Application 2020 & 2033
- Table 63: Israel Metal Lug Caps Revenue (undefined) Forecast, by Application 2020 & 2033
- Table 64: Israel Metal Lug Caps Volume (K) Forecast, by Application 2020 & 2033
- Table 65: GCC Metal Lug Caps Revenue (undefined) Forecast, by Application 2020 & 2033
- Table 66: GCC Metal Lug Caps Volume (K) Forecast, by Application 2020 & 2033
- Table 67: North Africa Metal Lug Caps Revenue (undefined) Forecast, by Application 2020 & 2033
- Table 68: North Africa Metal Lug Caps Volume (K) Forecast, by Application 2020 & 2033
- Table 69: South Africa Metal Lug Caps Revenue (undefined) Forecast, by Application 2020 & 2033
- Table 70: South Africa Metal Lug Caps Volume (K) Forecast, by Application 2020 & 2033
- Table 71: Rest of Middle East & Africa Metal Lug Caps Revenue (undefined) Forecast, by Application 2020 & 2033
- Table 72: Rest of Middle East & Africa Metal Lug Caps Volume (K) Forecast, by Application 2020 & 2033
- Table 73: Global Metal Lug Caps Revenue undefined Forecast, by Application 2020 & 2033
- Table 74: Global Metal Lug Caps Volume K Forecast, by Application 2020 & 2033
- Table 75: Global Metal Lug Caps Revenue undefined Forecast, by Types 2020 & 2033
- Table 76: Global Metal Lug Caps Volume K Forecast, by Types 2020 & 2033
- Table 77: Global Metal Lug Caps Revenue undefined Forecast, by Country 2020 & 2033
- Table 78: Global Metal Lug Caps Volume K Forecast, by Country 2020 & 2033
- Table 79: China Metal Lug Caps Revenue (undefined) Forecast, by Application 2020 & 2033
- Table 80: China Metal Lug Caps Volume (K) Forecast, by Application 2020 & 2033
- Table 81: India Metal Lug Caps Revenue (undefined) Forecast, by Application 2020 & 2033
- Table 82: India Metal Lug Caps Volume (K) Forecast, by Application 2020 & 2033
- Table 83: Japan Metal Lug Caps Revenue (undefined) Forecast, by Application 2020 & 2033
- Table 84: Japan Metal Lug Caps Volume (K) Forecast, by Application 2020 & 2033
- Table 85: South Korea Metal Lug Caps Revenue (undefined) Forecast, by Application 2020 & 2033
- Table 86: South Korea Metal Lug Caps Volume (K) Forecast, by Application 2020 & 2033
- Table 87: ASEAN Metal Lug Caps Revenue (undefined) Forecast, by Application 2020 & 2033
- Table 88: ASEAN Metal Lug Caps Volume (K) Forecast, by Application 2020 & 2033
- Table 89: Oceania Metal Lug Caps Revenue (undefined) Forecast, by Application 2020 & 2033
- Table 90: Oceania Metal Lug Caps Volume (K) Forecast, by Application 2020 & 2033
- Table 91: Rest of Asia Pacific Metal Lug Caps Revenue (undefined) Forecast, by Application 2020 & 2033
- Table 92: Rest of Asia Pacific Metal Lug Caps Volume (K) Forecast, by Application 2020 & 2033
Frequently Asked Questions
1. What is the projected Compound Annual Growth Rate (CAGR) of the Metal Lug Caps?
The projected CAGR is approximately 5%.
2. Which companies are prominent players in the Metal Lug Caps?
Key companies in the market include Silgan Closures, Massilly, Crown Holdings, Nippon Closures, Tecnocap, SACMI, CSl Closures, Berlin Packaging EMEA, TOKK, ZTI METALPAK, Sarıbekir Ambalaj, JN Pack, Continental Crown & Closures, DECA Packaging Group, Alucaps Mexicana, BLEMA Kircheis, Pelliconi, Origin Pharma Packaging, Oriental Containers, Tin Cap, Continental Crowns And Closures, Suzhou Hycan Holdings, CPMC Holdings, Yangzhou Daming Packing Products, Shengxing Group.
3. What are the main segments of the Metal Lug Caps?
The market segments include Application, Types.
4. Can you provide details about the market size?
The market size is estimated to be USD XXX N/A as of 2022.
5. What are some drivers contributing to market growth?
N/A
6. What are the notable trends driving market growth?
N/A
7. Are there any restraints impacting market growth?
N/A
8. Can you provide examples of recent developments in the market?
N/A
9. What pricing options are available for accessing the report?
Pricing options include single-user, multi-user, and enterprise licenses priced at USD 3950.00, USD 5925.00, and USD 7900.00 respectively.
10. Is the market size provided in terms of value or volume?
The market size is provided in terms of value, measured in N/A and volume, measured in K.
11. Are there any specific market keywords associated with the report?
Yes, the market keyword associated with the report is "Metal Lug Caps," which aids in identifying and referencing the specific market segment covered.
12. How do I determine which pricing option suits my needs best?
The pricing options vary based on user requirements and access needs. Individual users may opt for single-user licenses, while businesses requiring broader access may choose multi-user or enterprise licenses for cost-effective access to the report.
13. Are there any additional resources or data provided in the Metal Lug Caps report?
While the report offers comprehensive insights, it's advisable to review the specific contents or supplementary materials provided to ascertain if additional resources or data are available.
14. How can I stay updated on further developments or reports in the Metal Lug Caps?
To stay informed about further developments, trends, and reports in the Metal Lug Caps, consider subscribing to industry newsletters, following relevant companies and organizations, or regularly checking reputable industry news sources and publications.
Methodology
Step 1 - Identification of Relevant Samples Size from Population Database


Step 2 - Approaches for Defining Global Market Size (Value, Volume* & Price*)

Note*: In applicable scenarios
Step 3 - Data Sources
Primary Research
- Web Analytics
- Survey Reports
- Research Institute
- Latest Research Reports
- Opinion Leaders
Secondary Research
- Annual Reports
- White Paper
- Latest Press Release
- Industry Association
- Paid Database
- Investor Presentations

Step 4 - Data Triangulation
Involves using different sources of information in order to increase the validity of a study
These sources are likely to be stakeholders in a program - participants, other researchers, program staff, other community members, and so on.
Then we put all data in single framework & apply various statistical tools to find out the dynamic on the market.
During the analysis stage, feedback from the stakeholder groups would be compared to determine areas of agreement as well as areas of divergence