

Key Insights
The global beer can market is projected for robust expansion, anticipated to reach $65.9 billion by 2025, with a Compound Annual Growth Rate (CAGR) of 5.3% through 2033. This growth is driven by shifting consumer preferences and dynamic industry forces. The inherent convenience, portability, and environmental advantages of aluminum and steel cans continue to appeal to global beer consumers, boosting demand across both traditional and craft segments. Technological advancements, including enhanced barrier properties and sophisticated printing for aesthetic appeal, further cement the can's status as a preferred packaging choice for brewers. The rise of single-serve formats and growing consumer emphasis on packaging recyclability are also significant market drivers.
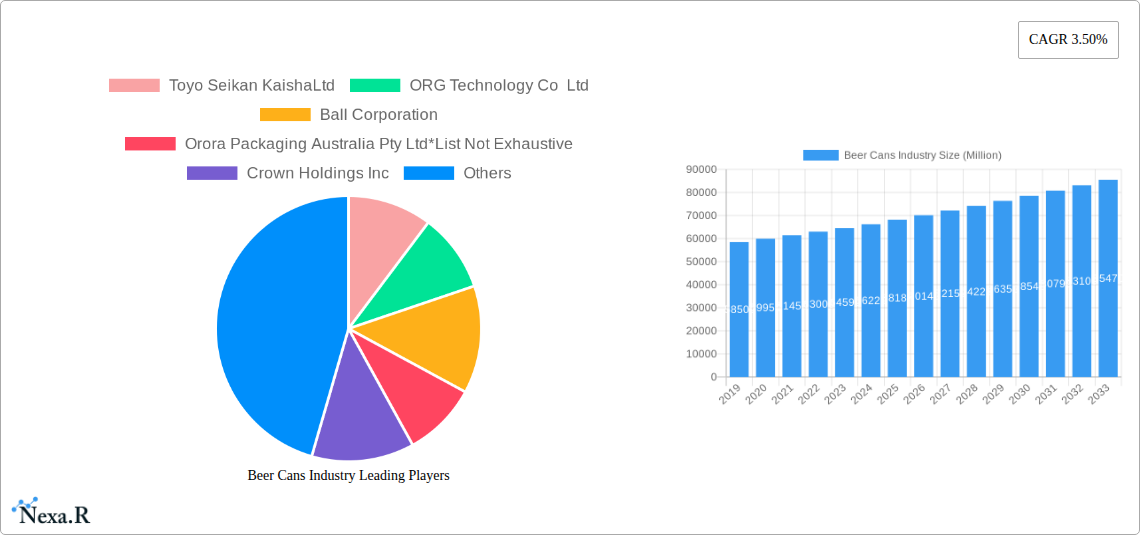
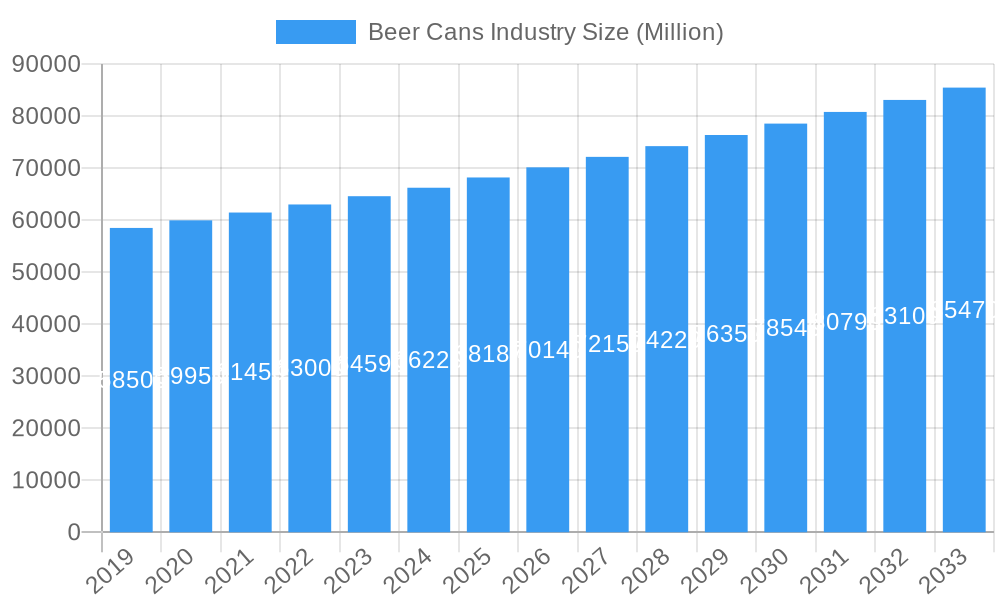
Beer Cans Industry Market Size (In Billion)
The beer can industry is segmented into Aluminum Cans and Steel/Tin Cans. Aluminum cans currently lead the market due to their lightweight nature, superior recyclability, and cost-effectiveness, making them ideal for large-scale breweries. Steel/Tin cans maintain a niche for specific craft beer applications where material properties or brand identity are paramount. Leading industry players, including Toyo Seikan Kaisha Ltd., Ball Corporation, and Crown Holdings Inc., influence market trends through innovation, strategic alliances, and global reach. Market challenges include volatile raw material costs for aluminum and steel, and increasing competition from alternative packaging like glass bottles and novel containers. However, the global shift towards a circular economy and the inherent product protection and shelf-life benefits of metal cans are expected to sustain market growth.
Beer Cans Industry Company Market Share
Beer Cans Industry: Comprehensive Market Analysis and Future Outlook (2019-2033)
This in-depth report provides a comprehensive analysis of the global Beer Cans Industry, meticulously examining market dynamics, growth trends, regional dominance, product landscapes, key drivers, challenges, opportunities, and the influential players shaping its future. Leveraging the latest data from the Base Year 2025 and extending through the Forecast Period 2025–2033, with insights from the Historical Period 2019–2024, this report offers actionable intelligence for industry stakeholders. The analysis includes market size evolution in million units, CAGR estimations, and detailed segment breakdowns, focusing on the significant contribution of Aluminum Cans and Steel/Tin Cans. We present a nuanced view of both parent and child markets, crucial for strategic decision-making.
Beer Cans Industry Market Dynamics & Structure
The global Beer Cans Industry exhibits a moderately concentrated market structure, with a few key players dominating production and innovation. Technological advancements, particularly in lightweighting and sustainable materials, are significant drivers. Regulatory frameworks focusing on recyclability and environmental impact are increasingly influencing manufacturing processes and material choices. Competitive product substitutes, such as glass bottles and PET containers, continue to pose a challenge, though the inherent sustainability and superior shelf-life properties of metal cans offer a distinct advantage. End-user demographics are shifting towards younger, environmentally conscious consumers, demanding more sustainable packaging solutions. Mergers and acquisitions (M&A) activity is observed, driven by the pursuit of increased market share, technological integration, and economies of scale.
- Market Concentration: Dominated by a few large-scale manufacturers, but with room for niche players.
- Technological Innovation Drivers: Lightweighting, advanced barrier coatings, improved recyclability, and smart packaging solutions.
- Regulatory Frameworks: Increasing emphasis on Extended Producer Responsibility (EPR) schemes and recycled content mandates.
- Competitive Product Substitutes: Glass bottles, PET bottles, and emerging bio-based packaging materials.
- End-User Demographics: Growing demand for convenience, sustainability, and aesthetic appeal from millennial and Gen Z consumers.
- M&A Trends: Strategic acquisitions to enhance production capacity, expand product portfolios, and secure market access. For instance, M&A deal volumes are projected to increase by approximately 10-15% in the forecast period driven by consolidation.
Beer Cans Industry Growth Trends & Insights
The Beer Cans Industry is poised for robust growth driven by escalating global beer consumption, a strong preference for convenient and portable packaging, and a significant shift towards sustainable materials. The market size evolution is projected to witness a Compound Annual Growth Rate (CAGR) of approximately 4.5% from 2025 to 2033, reaching an estimated market value of $XX Billion units by the end of the forecast period. Adoption rates for aluminum cans, in particular, are soaring due to their infinitely recyclable nature and superior performance characteristics. Technological disruptions, such as advancements in can manufacturing efficiency and the development of novel coating technologies, are further enhancing the appeal of metal cans. Consumer behavior shifts are playing a pivotal role, with a growing awareness of environmental issues fueling demand for packaging with higher recycled content and a lower carbon footprint. The industry's ability to adapt to these evolving preferences will be critical for sustained growth.
- Market Size Evolution: From an estimated $XX Billion units in 2025, the market is projected to grow steadily.
- CAGR: An estimated 4.5% from 2025 to 2033.
- Adoption Rates: Increasing adoption of aluminum cans by over 70% of the beer packaging market.
- Technological Disruptions: Innovations in 360-degree printing, easy-open closures, and specialized can coatings.
- Consumer Behavior Shifts: Growing preference for single-serve, portable packaging and a strong emphasis on brand sustainability credentials.
- Market Penetration: High penetration in developed markets, with significant growth potential in emerging economies.
Dominant Regions, Countries, or Segments in Beer Cans Industry
The Aluminum Can segment is undeniably the dominant force driving growth within the global Beer Cans Industry. Its superior recyclability, lightweight nature, and excellent barrier properties make it the preferred choice for brewers worldwide. North America and Europe currently lead in terms of market share and consumption, driven by established brewing industries, strong consumer demand for premium and craft beers, and robust recycling infrastructure. However, the Asia-Pacific region is emerging as a high-growth area, fueled by rapid economic development, a burgeoning middle class, and increasing urbanization leading to higher beer consumption. Government initiatives promoting sustainable packaging and the expansion of the craft beer movement in these regions are key growth accelerators for aluminum cans.
- Dominant Segment: Aluminum Can, accounting for approximately 75% of the global beer can market share.
- Key Drivers:
- Sustainability: Infinitely recyclable and has a lower carbon footprint compared to other packaging materials when recycled effectively.
- Lightweighting: Reduced material usage leading to lower transportation costs and environmental impact.
- Brand Perception: Often associated with premium and craft beer products.
- Recycling Infrastructure: Well-established and efficient recycling systems in developed markets.
- Key Drivers:
- Leading Regions:
- North America: Strong demand for both mass-market and craft beers, coupled with stringent recycling regulations. Market share estimated at 30%.
- Europe: High per capita beer consumption and a strong focus on environmental sustainability. Market share estimated at 28%.
- Asia-Pacific: Rapidly growing market with increasing beer consumption and a growing middle class. Projected CAGR of 6%.
- Key Drivers:
- Economic growth and increasing disposable income.
- Urbanization and changing lifestyle trends.
- Government initiatives promoting recycling and waste reduction.
- Expansion of the beverage industry.
- Key Drivers:
Beer Cans Industry Product Landscape
The Beer Cans Industry's product landscape is characterized by continuous innovation focused on enhanced functionality, sustainability, and aesthetic appeal. Aluminum cans dominate due to their lightweight nature, excellent recyclability, and ability to maintain product freshness. Steel/tin cans, while historically significant, are seeing a gradual decline in market share for beer packaging due to their heavier weight and lower recycling rates compared to aluminum. Innovations include advancements in can wall thinning for reduced material usage, development of advanced internal and external coatings for improved product protection and branding, and the introduction of novel closure systems for enhanced consumer convenience. The focus is increasingly on cans with higher recycled content, aligning with global sustainability trends and consumer preferences for eco-friendly packaging.
- Aluminum Can: Lightweight, durable, infinitely recyclable, and offers excellent product protection, making it the preferred choice.
- Steel/Tin Can: Historically used but facing challenges due to weight and recyclability compared to aluminum.
- Product Innovations: Lightweighting initiatives, advanced coating technologies for flavor preservation, and innovative can shapes and designs.
- Applications: Primary packaging for a wide range of beer types, including lagers, ales, stouts, and craft beers.
- Performance Metrics: Focus on structural integrity, barrier properties, thermal conductivity, and recyclability.
Key Drivers, Barriers & Challenges in Beer Cans Industry
Key Drivers:
- Growing Global Beer Consumption: An expanding global population and increasing disposable incomes are fueling higher beer consumption, directly impacting demand for beer cans.
- Sustainability Mandates and Consumer Preferences: Growing environmental consciousness is driving demand for infinitely recyclable packaging like aluminum cans, pushing brands to adopt sustainable solutions.
- Convenience and Portability: The consumer preference for convenient, single-serve, and portable packaging solutions strongly favors cans over glass bottles for on-the-go consumption.
- Technological Advancements: Innovations in lightweighting, material efficiency, and printing technologies are improving the cost-effectiveness and appeal of beer cans.
- Growth of Craft Beer Market: The burgeoning craft beer segment often utilizes cans for their portability, preservation qualities, and ability to protect beer from light.
Barriers & Challenges:
- Raw Material Price Volatility: Fluctuations in the prices of aluminum and steel can impact manufacturing costs and profit margins. For instance, a 5% increase in aluminum prices can directly increase production costs by 2-3%.
- Competition from Alternative Packaging: Glass bottles and PET packaging continue to offer competitive alternatives, particularly in specific market segments or regions.
- Recycling Infrastructure Gaps: Inconsistent or underdeveloped recycling infrastructure in certain regions can hinder the circular economy efforts for metal cans.
- Energy-Intensive Production: The production of aluminum, in particular, is energy-intensive, presenting a challenge for achieving carbon neutrality goals without significant investment in renewable energy sources.
- Regulatory Compliance: Navigating diverse and evolving environmental regulations across different geographies can be complex and costly.
Emerging Opportunities in Beer Cans Industry
Emerging opportunities in the Beer Cans Industry are centered around enhanced sustainability, innovative product features, and untapped market potential. The development and widespread adoption of cans made from 100% recycled aluminum represent a significant opportunity to reduce environmental impact and meet consumer demand for truly circular packaging. Innovations in smart packaging, such as embedded QR codes or NFC tags for supply chain traceability and consumer engagement, offer new avenues for brand differentiation. Furthermore, the expansion of the craft and premium beer segments into emerging economies presents substantial growth potential, with a rising middle class increasingly adopting Western consumption habits. The development of specialized can formats for niche beverage categories, beyond traditional beer, also offers diversification opportunities.
- 100% Recycled Content Cans: Meeting growing demand for circular economy solutions.
- Smart Packaging Integration: Enhancing traceability, consumer engagement, and brand experience.
- Emerging Market Expansion: Tapping into the growing demand in Asia-Pacific, Africa, and Latin America.
- Niche Beverage Segments: Diversifying applications beyond traditional beer into RTDs (Ready-to-Drink) and other beverages.
Growth Accelerators in the Beer Cans Industry Industry
The Beer Cans Industry is experiencing significant growth acceleration driven by a confluence of technological breakthroughs, strategic partnerships, and targeted market expansion strategies. The continuous pursuit of lightweighting in aluminum cans, reducing material usage without compromising structural integrity, directly translates to cost savings and a lower environmental footprint, making them more attractive. Strategic partnerships between can manufacturers and breweries are becoming crucial for co-developing innovative packaging solutions tailored to specific brand needs and consumer preferences. Furthermore, the expansion of the global beer market, particularly in developing regions with a growing middle class and increasing urbanization, provides a substantial runway for growth. Investments in advanced recycling technologies and the promotion of deposit return schemes are also accelerating the circularity of aluminum cans, bolstering their appeal.
- Lightweighting Technology: Continuous improvements in can wall thickness reduce material consumption and costs.
- Strategic Partnerships: Collaboration between can manufacturers and breweries to create bespoke packaging solutions.
- Global Market Expansion: Targeting high-growth emerging economies with increasing beer consumption.
- Investment in Recycling Infrastructure: Enhanced recycling capabilities and deposit return schemes promote material circularity.
Key Players Shaping the Beer Cans Industry Market
Toyo Seikan Kaisha Ltd ORG Technology Co Ltd Ball Corporation Orora Packaging Australia Pty Ltd Crown Holdings Inc Shenzhen Xin Yuheng Can Co Ltd Kaufman Container Daiwa Can Co Can-Pack S A
Notable Milestones in Beer Cans Industry Sector
- October 2022: Ball Corporation announced the portfolio expansion of its infinitely recyclable Ball Aluminum Cup with the launch of two new, smaller sizes (9-ounce and 12-ounce cup sizes). The Ball Aluminum Cup available for food service customers is now composed of 90% recycled content, making it the cup with the highest recycled content rate of any beverage packaging in its category.
- September 2022: Crown Holdings, Inc announced the company Research & Development (R&D) achieved a 4% global average reduction in its standard 12 oz. (330 ml) can weight. Lightweighting efforts add to metal's superior properties in terms of recyclability. The benefits are compounded as the material circulates through the process repeatedly. Weight reductions allow us to produce more cans with the same aluminum used previously for standard cans. It includes a positive impact on GHG emissions through energy savings as part of the Twenty by 30 sustainability strategy to enhance sustainability and reduce greenhouse gas (GHG) emissions.
In-Depth Beer Cans Industry Market Outlook
The Beer Cans Industry is set for a dynamic and promising future, driven by a persistent focus on sustainability and consumer-centric innovations. The transition towards a circular economy, with an increasing reliance on recycled materials, will be a defining characteristic of the coming years. Growth accelerators such as advanced lightweighting technologies in aluminum cans will continue to improve cost-effectiveness and environmental performance. Strategic collaborations between key players will foster the development of novel packaging solutions and streamline supply chains, while the expansion into underserved emerging markets will unlock significant untapped potential. The industry's agility in responding to evolving consumer preferences for convenience, eco-friendliness, and premiumization will be paramount to capitalizing on its substantial future market potential.
Beer Cans Industry Segmentation
-
1. Product Type
- 1.1. Aluminum Can
- 1.2. Steel/Tin Can
Beer Cans Industry Segmentation By Geography
-
1. North America
- 1.1. United States
- 1.2. Canada
-
2. Europe
- 2.1. Germany
- 2.2. France
- 2.3. United Kingdom
- 2.4. Spain
- 2.5. Rest of Europe
-
3. Asia Pacific
- 3.1. China
- 3.2. Japan
- 3.3. India
- 3.4. Australia
- 3.5. Rest of Asia Pacific
-
4. Latin America
- 4.1. Brazil
- 4.2. Rest of Latin America
- 5. Middle East
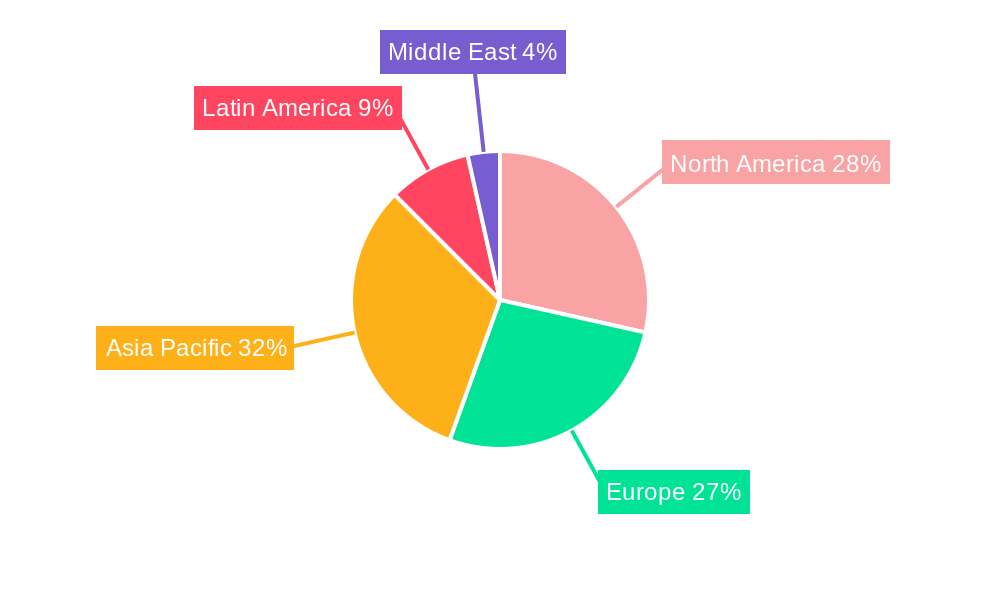
Beer Cans Industry Regional Market Share
Geographic Coverage of Beer Cans Industry
Beer Cans Industry REPORT HIGHLIGHTS
| Aspects | Details |
|---|---|
| Study Period | 2020-2034 |
| Base Year | 2025 |
| Estimated Year | 2026 |
| Forecast Period | 2026-2034 |
| Historical Period | 2020-2025 |
| Growth Rate | CAGR of 5.3% from 2020-2034 |
| Segmentation |
|
Table of Contents
- 1. Introduction
- 1.1. Research Scope
- 1.2. Market Segmentation
- 1.3. Research Objective
- 1.4. Definitions and Assumptions
- 2. Executive Summary
- 2.1. Market Snapshot
- 3. Market Dynamics
- 3.1. Market Drivers
- 3.2. Market Restrains
- 3.3. Market Trends
- 3.4. Market Opportunities
- 4. Market Factor Analysis
- 4.1. Porters Five Forces
- 4.1.1. Bargaining Power of Suppliers
- 4.1.2. Bargaining Power of Buyers
- 4.1.3. Threat of New Entrants
- 4.1.4. Threat of Substitutes
- 4.1.5. Competitive Rivalry
- 4.2. PESTEL analysis
- 4.3. BCG Analysis
- 4.3.1. Stars (High Growth, High Market Share)
- 4.3.2. Cash Cows (Low Growth, High Market Share)
- 4.3.3. Question Mark (High Growth, Low Market Share)
- 4.3.4. Dogs (Low Growth, Low Market Share)
- 4.4. Ansoff Matrix Analysis
- 4.5. Supply Chain Analysis
- 4.6. Regulatory Landscape
- 4.7. Current Market Potential and Opportunity Assessment (TAM–SAM–SOM Framework)
- 4.8. NRP Analyst Note
- 4.1. Porters Five Forces
- 5. Market Analysis, Insights and Forecast 2021-2033
- 5.1. Market Analysis, Insights and Forecast - by Product Type
- 5.1.1. Aluminum Can
- 5.1.2. Steel/Tin Can
- 5.2. Market Analysis, Insights and Forecast - by Region
- 5.2.1. North America
- 5.2.2. Europe
- 5.2.3. Asia Pacific
- 5.2.4. Latin America
- 5.2.5. Middle East
- 5.1. Market Analysis, Insights and Forecast - by Product Type
- 6. Global Beer Cans Industry Analysis, Insights and Forecast, 2021-2033
- 6.1. Market Analysis, Insights and Forecast - by Product Type
- 6.1.1. Aluminum Can
- 6.1.2. Steel/Tin Can
- 6.1. Market Analysis, Insights and Forecast - by Product Type
- 7. North America Beer Cans Industry Analysis, Insights and Forecast, 2020-2032
- 7.1. Market Analysis, Insights and Forecast - by Product Type
- 7.1.1. Aluminum Can
- 7.1.2. Steel/Tin Can
- 7.1. Market Analysis, Insights and Forecast - by Product Type
- 8. Europe Beer Cans Industry Analysis, Insights and Forecast, 2020-2032
- 8.1. Market Analysis, Insights and Forecast - by Product Type
- 8.1.1. Aluminum Can
- 8.1.2. Steel/Tin Can
- 8.1. Market Analysis, Insights and Forecast - by Product Type
- 9. Asia Pacific Beer Cans Industry Analysis, Insights and Forecast, 2020-2032
- 9.1. Market Analysis, Insights and Forecast - by Product Type
- 9.1.1. Aluminum Can
- 9.1.2. Steel/Tin Can
- 9.1. Market Analysis, Insights and Forecast - by Product Type
- 10. Latin America Beer Cans Industry Analysis, Insights and Forecast, 2020-2032
- 10.1. Market Analysis, Insights and Forecast - by Product Type
- 10.1.1. Aluminum Can
- 10.1.2. Steel/Tin Can
- 10.1. Market Analysis, Insights and Forecast - by Product Type
- 11. Middle East Beer Cans Industry Analysis, Insights and Forecast, 2020-2032
- 11.1. Market Analysis, Insights and Forecast - by Product Type
- 11.1.1. Aluminum Can
- 11.1.2. Steel/Tin Can
- 11.1. Market Analysis, Insights and Forecast - by Product Type
- 12. Competitive Analysis
- 12.1. Company Profiles
- 12.1.1 Toyo Seikan KaishaLtd
- 12.1.1.1. Company Overview
- 12.1.1.2. Products
- 12.1.1.3. Company Financials
- 12.1.1.4. SWOT Analysis
- 12.1.2 ORG Technology Co Ltd
- 12.1.2.1. Company Overview
- 12.1.2.2. Products
- 12.1.2.3. Company Financials
- 12.1.2.4. SWOT Analysis
- 12.1.3 Ball Corporation
- 12.1.3.1. Company Overview
- 12.1.3.2. Products
- 12.1.3.3. Company Financials
- 12.1.3.4. SWOT Analysis
- 12.1.4 Orora Packaging Australia Pty Ltd*List Not Exhaustive
- 12.1.4.1. Company Overview
- 12.1.4.2. Products
- 12.1.4.3. Company Financials
- 12.1.4.4. SWOT Analysis
- 12.1.5 Crown Holdings Inc
- 12.1.5.1. Company Overview
- 12.1.5.2. Products
- 12.1.5.3. Company Financials
- 12.1.5.4. SWOT Analysis
- 12.1.6 Shenzhen Xin Yuheng Can Co Ltd
- 12.1.6.1. Company Overview
- 12.1.6.2. Products
- 12.1.6.3. Company Financials
- 12.1.6.4. SWOT Analysis
- 12.1.7 Kaufman Container
- 12.1.7.1. Company Overview
- 12.1.7.2. Products
- 12.1.7.3. Company Financials
- 12.1.7.4. SWOT Analysis
- 12.1.8 Daiwa Can Co
- 12.1.8.1. Company Overview
- 12.1.8.2. Products
- 12.1.8.3. Company Financials
- 12.1.8.4. SWOT Analysis
- 12.1.9 Can-Pack S A
- 12.1.9.1. Company Overview
- 12.1.9.2. Products
- 12.1.9.3. Company Financials
- 12.1.9.4. SWOT Analysis
- 12.1.1 Toyo Seikan KaishaLtd
- 12.2. Market Entropy
- 12.2.1 Company's Key Areas Served
- 12.2.2 Recent Developments
- 12.3. Company Market Share Analysis 2025
- 12.3.1 Top 5 Companies Market Share Analysis
- 12.3.2 Top 3 Companies Market Share Analysis
- 12.4. List of Potential Customers
- 13. Research Methodology
List of Figures
- Figure 1: Global Beer Cans Industry Revenue Breakdown (billion, %) by Region 2025 & 2033
- Figure 2: North America Beer Cans Industry Revenue (billion), by Product Type 2025 & 2033
- Figure 3: North America Beer Cans Industry Revenue Share (%), by Product Type 2025 & 2033
- Figure 4: North America Beer Cans Industry Revenue (billion), by Country 2025 & 2033
- Figure 5: North America Beer Cans Industry Revenue Share (%), by Country 2025 & 2033
- Figure 6: Europe Beer Cans Industry Revenue (billion), by Product Type 2025 & 2033
- Figure 7: Europe Beer Cans Industry Revenue Share (%), by Product Type 2025 & 2033
- Figure 8: Europe Beer Cans Industry Revenue (billion), by Country 2025 & 2033
- Figure 9: Europe Beer Cans Industry Revenue Share (%), by Country 2025 & 2033
- Figure 10: Asia Pacific Beer Cans Industry Revenue (billion), by Product Type 2025 & 2033
- Figure 11: Asia Pacific Beer Cans Industry Revenue Share (%), by Product Type 2025 & 2033
- Figure 12: Asia Pacific Beer Cans Industry Revenue (billion), by Country 2025 & 2033
- Figure 13: Asia Pacific Beer Cans Industry Revenue Share (%), by Country 2025 & 2033
- Figure 14: Latin America Beer Cans Industry Revenue (billion), by Product Type 2025 & 2033
- Figure 15: Latin America Beer Cans Industry Revenue Share (%), by Product Type 2025 & 2033
- Figure 16: Latin America Beer Cans Industry Revenue (billion), by Country 2025 & 2033
- Figure 17: Latin America Beer Cans Industry Revenue Share (%), by Country 2025 & 2033
- Figure 18: Middle East Beer Cans Industry Revenue (billion), by Product Type 2025 & 2033
- Figure 19: Middle East Beer Cans Industry Revenue Share (%), by Product Type 2025 & 2033
- Figure 20: Middle East Beer Cans Industry Revenue (billion), by Country 2025 & 2033
- Figure 21: Middle East Beer Cans Industry Revenue Share (%), by Country 2025 & 2033
List of Tables
- Table 1: Global Beer Cans Industry Revenue billion Forecast, by Product Type 2020 & 2033
- Table 2: Global Beer Cans Industry Revenue billion Forecast, by Region 2020 & 2033
- Table 3: Global Beer Cans Industry Revenue billion Forecast, by Product Type 2020 & 2033
- Table 4: Global Beer Cans Industry Revenue billion Forecast, by Country 2020 & 2033
- Table 5: United States Beer Cans Industry Revenue (billion) Forecast, by Application 2020 & 2033
- Table 6: Canada Beer Cans Industry Revenue (billion) Forecast, by Application 2020 & 2033
- Table 7: Global Beer Cans Industry Revenue billion Forecast, by Product Type 2020 & 2033
- Table 8: Global Beer Cans Industry Revenue billion Forecast, by Country 2020 & 2033
- Table 9: Germany Beer Cans Industry Revenue (billion) Forecast, by Application 2020 & 2033
- Table 10: France Beer Cans Industry Revenue (billion) Forecast, by Application 2020 & 2033
- Table 11: United Kingdom Beer Cans Industry Revenue (billion) Forecast, by Application 2020 & 2033
- Table 12: Spain Beer Cans Industry Revenue (billion) Forecast, by Application 2020 & 2033
- Table 13: Rest of Europe Beer Cans Industry Revenue (billion) Forecast, by Application 2020 & 2033
- Table 14: Global Beer Cans Industry Revenue billion Forecast, by Product Type 2020 & 2033
- Table 15: Global Beer Cans Industry Revenue billion Forecast, by Country 2020 & 2033
- Table 16: China Beer Cans Industry Revenue (billion) Forecast, by Application 2020 & 2033
- Table 17: Japan Beer Cans Industry Revenue (billion) Forecast, by Application 2020 & 2033
- Table 18: India Beer Cans Industry Revenue (billion) Forecast, by Application 2020 & 2033
- Table 19: Australia Beer Cans Industry Revenue (billion) Forecast, by Application 2020 & 2033
- Table 20: Rest of Asia Pacific Beer Cans Industry Revenue (billion) Forecast, by Application 2020 & 2033
- Table 21: Global Beer Cans Industry Revenue billion Forecast, by Product Type 2020 & 2033
- Table 22: Global Beer Cans Industry Revenue billion Forecast, by Country 2020 & 2033
- Table 23: Brazil Beer Cans Industry Revenue (billion) Forecast, by Application 2020 & 2033
- Table 24: Rest of Latin America Beer Cans Industry Revenue (billion) Forecast, by Application 2020 & 2033
- Table 25: Global Beer Cans Industry Revenue billion Forecast, by Product Type 2020 & 2033
- Table 26: Global Beer Cans Industry Revenue billion Forecast, by Country 2020 & 2033
Frequently Asked Questions
1. What is the projected Compound Annual Growth Rate (CAGR) of the Beer Cans Industry?
The projected CAGR is approximately 5.3%.
2. Which companies are prominent players in the Beer Cans Industry?
Key companies in the market include Toyo Seikan KaishaLtd, ORG Technology Co Ltd, Ball Corporation, Orora Packaging Australia Pty Ltd*List Not Exhaustive, Crown Holdings Inc, Shenzhen Xin Yuheng Can Co Ltd, Kaufman Container, Daiwa Can Co, Can-Pack S A.
3. What are the main segments of the Beer Cans Industry?
The market segments include Product Type.
4. Can you provide details about the market size?
The market size is estimated to be USD 65.9 billion as of 2022.
5. What are some drivers contributing to market growth?
Growing Consumption of Craft Beer Across Various Regions; Recreational and Environmental Benefits.
6. What are the notable trends driving market growth?
Aluminium is Expected to Hold the Largest Market Share.
7. Are there any restraints impacting market growth?
Changing Consumer Preferences.
8. Can you provide examples of recent developments in the market?
October 2022 - Ball Corporation announced the portfolio expansion of its infinitely recyclable ball aluminum cup with the launch of two new, smaller sizes (9-ounce and 12-ounce cup sizes). The Ball Aluminum Cup available for food service customers is now composed of 90% recycled content, making it the cup with the highest recycled content rate of any beverage packaging in its category.
9. What pricing options are available for accessing the report?
Pricing options include single-user, multi-user, and enterprise licenses priced at USD 4750, USD 5250, and USD 8750 respectively.
10. Is the market size provided in terms of value or volume?
The market size is provided in terms of value, measured in billion.
11. Are there any specific market keywords associated with the report?
Yes, the market keyword associated with the report is "Beer Cans Industry," which aids in identifying and referencing the specific market segment covered.
12. How do I determine which pricing option suits my needs best?
The pricing options vary based on user requirements and access needs. Individual users may opt for single-user licenses, while businesses requiring broader access may choose multi-user or enterprise licenses for cost-effective access to the report.
13. Are there any additional resources or data provided in the Beer Cans Industry report?
While the report offers comprehensive insights, it's advisable to review the specific contents or supplementary materials provided to ascertain if additional resources or data are available.
14. How can I stay updated on further developments or reports in the Beer Cans Industry?
To stay informed about further developments, trends, and reports in the Beer Cans Industry, consider subscribing to industry newsletters, following relevant companies and organizations, or regularly checking reputable industry news sources and publications.
Methodology
Step 1 - Identification of Relevant Samples Size from Population Database


Step 2 - Approaches for Defining Global Market Size (Value, Volume* & Price*)

Note*: In applicable scenarios
Step 3 - Data Sources
Primary Research
- Web Analytics
- Survey Reports
- Research Institute
- Latest Research Reports
- Opinion Leaders
Secondary Research
- Annual Reports
- White Paper
- Latest Press Release
- Industry Association
- Paid Database
- Investor Presentations

Step 4 - Data Triangulation
Involves using different sources of information in order to increase the validity of a study
These sources are likely to be stakeholders in a program - participants, other researchers, program staff, other community members, and so on.
Then we put all data in single framework & apply various statistical tools to find out the dynamic on the market.
During the analysis stage, feedback from the stakeholder groups would be compared to determine areas of agreement as well as areas of divergence