

Key Insights
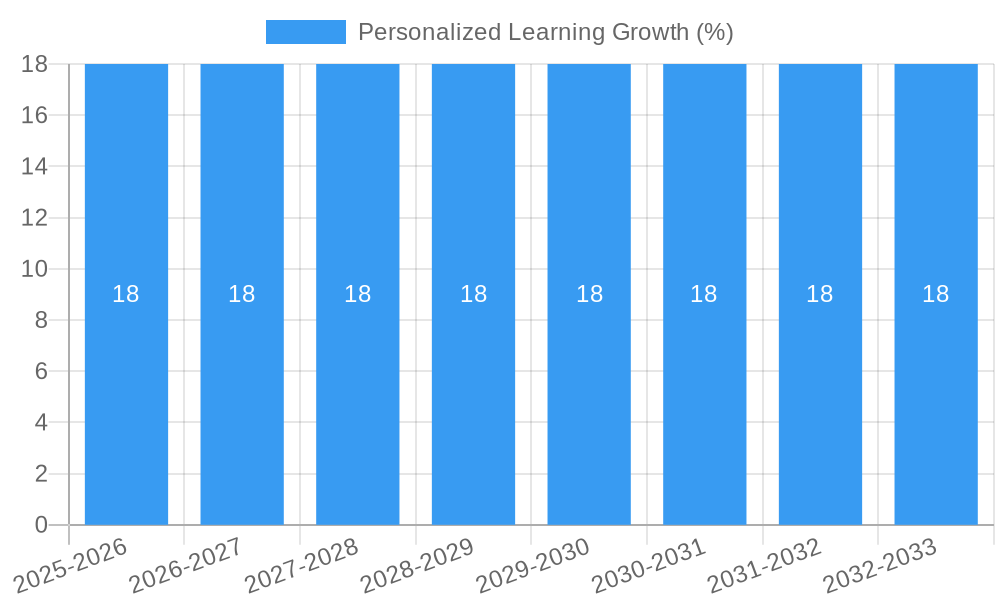
The Personalized Learning market is poised for significant expansion, projected to reach approximately $15 billion by 2025, with a robust Compound Annual Growth Rate (CAGR) of 18% over the forecast period of 2025-2033. This growth is fueled by an increasing recognition of the limitations of one-size-fits-all educational approaches and the rising demand for tailored learning experiences that cater to individual student needs, paces, and learning styles. Key drivers include the widespread adoption of digital technologies in education, advancements in Artificial Intelligence (AI) and machine learning for adaptive content delivery, and a growing emphasis on student-centric pedagogical models. The market's evolution is characterized by a shift from traditional classroom settings to more flexible and accessible online and blended learning environments.
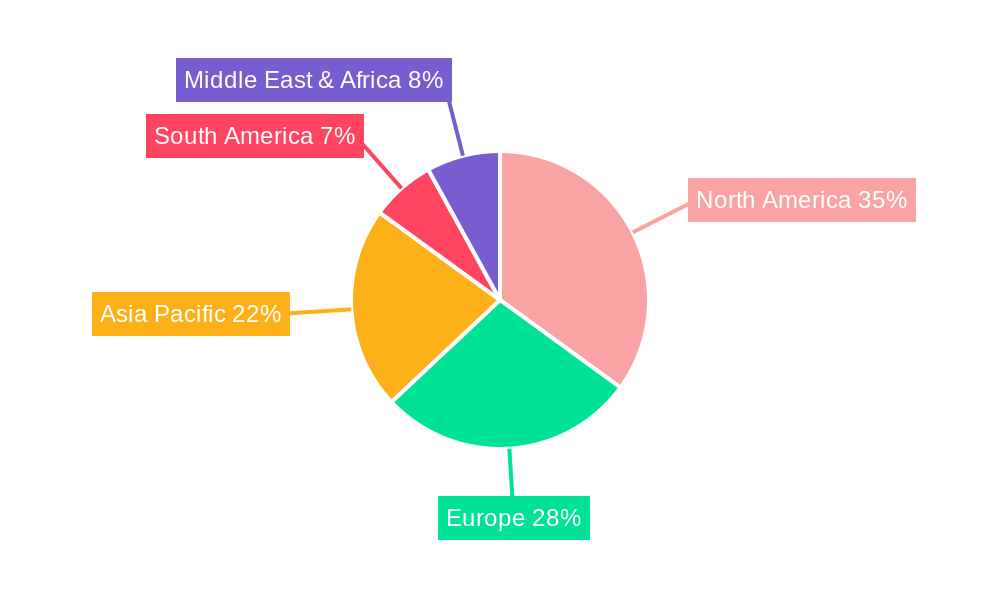
The market is segmented by application into Personal and Commercial, with the Commercial segment, encompassing educational institutions and corporate training programs, expected to dominate due to its scale and integration efforts. Within types, Online Courses and Software & Apps are anticipated to be the most dynamic segments, driven by the accessibility and scalability they offer. While the market is experiencing rapid growth, certain restraints, such as concerns about data privacy and security, the initial investment cost for advanced personalized learning platforms, and the need for comprehensive teacher training and digital literacy, need to be strategically addressed. Geographically, North America is expected to lead the market, followed closely by Europe and the rapidly expanding Asia Pacific region, driven by increasing digitalization and government initiatives supporting educational technology.
Personalized Learning Market: A Comprehensive Report on Global Trends, Opportunities, and Key Players
Unlock the future of education with this in-depth analysis of the global Personalized Learning market. This report provides critical insights for edtech leaders, investors, and policymakers, covering market dynamics, growth trajectories, regional dominance, product innovation, and emerging opportunities. With a forecast period extending to 2033 and a focus on key segments and companies, this research is essential for navigating the evolving educational landscape.
Personalized Learning Market Dynamics & Structure
The Personalized Learning market exhibits a moderately concentrated structure, driven by significant investments in technological innovation and evolving pedagogical approaches. Key players are continuously investing in research and development to enhance adaptive learning algorithms, AI-powered feedback systems, and data analytics capabilities that personalize the educational experience. Regulatory frameworks, while evolving, are increasingly focusing on data privacy and student well-being, influencing how personalized learning solutions are designed and implemented. Competitive product substitutes include traditional one-size-fits-all educational models and other digital learning platforms, but personalized approaches are gaining traction due to their demonstrated effectiveness. End-user demographics span from K-12 students and higher education institutions to corporate training programs and individual lifelong learners, each with unique needs and adoption patterns. Merger and acquisition (M&A) trends are evident, as larger edtech companies seek to acquire innovative startups to expand their portfolios and market reach. For instance, recent years have seen an estimated 15-20 M&A deal volumes annually within the broader edtech space, with a significant portion targeting personalized learning solutions. Barriers to innovation include the high cost of developing sophisticated AI and adaptive learning systems, as well as the need for widespread digital literacy and reliable internet access across diverse populations.
- Market Concentration: Moderately concentrated with key players investing heavily in R&D.
- Technological Innovation Drivers: Adaptive learning algorithms, AI-powered feedback, data analytics.
- Regulatory Frameworks: Focus on data privacy, student well-being, and accessibility.
- Competitive Product Substitutes: Traditional education, generic digital learning platforms.
- End-User Demographics: K-12, higher education, corporate training, lifelong learners.
- M&A Trends: Strategic acquisitions for portfolio expansion and market consolidation. Estimated 15-20 M&A deals annually.
- Innovation Barriers: High development costs, digital literacy gaps, infrastructure limitations.
Personalized Learning Growth Trends & Insights
The global Personalized Learning market is poised for robust expansion, fueled by a growing recognition of its efficacy in improving student outcomes and engagement. Our analysis, leveraging comprehensive market intelligence, indicates a significant market size evolution from $15.5 billion in 2019 to an estimated $25.8 billion in 2025. This growth is projected to continue at a Compound Annual Growth Rate (CAGR) of 12.5% during the forecast period of 2025–2033, reaching an estimated $60.2 billion by 2033. Adoption rates are accelerating across all educational levels, driven by the desire for more effective and tailored learning experiences. Technological disruptions, including advancements in artificial intelligence, machine learning, and natural language processing, are central to this growth, enabling more sophisticated personalization. Consumer behavior shifts are also playing a crucial role, with learners and educators increasingly demanding flexible, on-demand, and individualized learning pathways. The market penetration of personalized learning solutions is expected to rise significantly as institutions and individuals embrace digital transformation in education.
- Market Size Evolution: From $15.5 billion (2019) to an estimated $25.8 billion (2025).
- CAGR Projection: 12.5% for the forecast period (2025–2033).
- Projected Market Value (2033): Estimated $60.2 billion.
- Adoption Rates: Accelerating across K-12, higher education, and professional development.
- Technological Disruptions: AI, ML, NLP are key enablers of advanced personalization.
- Consumer Behavior Shifts: Demand for flexible, on-demand, and individualized learning.
- Market Penetration: Increasing as digital transformation in education gains momentum.
Dominant Regions, Countries, or Segments in Personalized Learning
The Commercial segment, particularly within the Online Courses and Software & App types, is currently the dominant force driving growth in the Personalized Learning market. This dominance is fueled by the widespread adoption of these solutions in corporate training and professional development, where the need for upskilling and reskilling is high. The United States stands out as a leading country, driven by its significant investment in edtech innovation, a strong entrepreneurial ecosystem, and a large addressable market. Economic policies that encourage R&D and digital infrastructure development further bolster its position.
The Application of Commercial is projected to account for an estimated 55% of the total market share in 2025, with a growth potential that outpaces the Personal segment. Within Types, Online Courses and Software & Apps collectively represent an estimated 70% market share, catering to both individual learners and institutional needs for flexible and scalable digital learning solutions. Key drivers for this dominance include the tangible return on investment demonstrated by personalized corporate training programs, leading to increased productivity and employee retention. Furthermore, the scalability of online platforms allows for rapid deployment and customization to meet diverse organizational needs.
Asia Pacific, particularly China and India, is emerging as a high-growth region due to a burgeoning student population, increasing internet penetration, and government initiatives promoting digital education. While the Personal application segment is growing, its market share is currently smaller, estimated at 45% in 2025, but it presents significant long-term potential as individual learners increasingly seek personalized skill development and lifelong learning opportunities. The infrastructure in developed nations supports a higher adoption rate for both online and offline personalized learning resources, contributing to the dominance of these segments and regions.
- Dominant Segment (Application): Commercial (estimated 55% market share in 2025).
- Dominant Segments (Types): Online Courses and Software & App (collectively estimated 70% market share).
- Leading Country: United States, driven by innovation, investment, and market size.
- Emerging High-Growth Region: Asia Pacific (China, India), due to population and government support.
- Drivers of Commercial Dominance: ROI in corporate training, scalability of online platforms.
- Personal Application Growth Potential: Significant long-term potential for lifelong learning.
- Infrastructure Impact: Developed nations' infrastructure supports higher adoption rates.
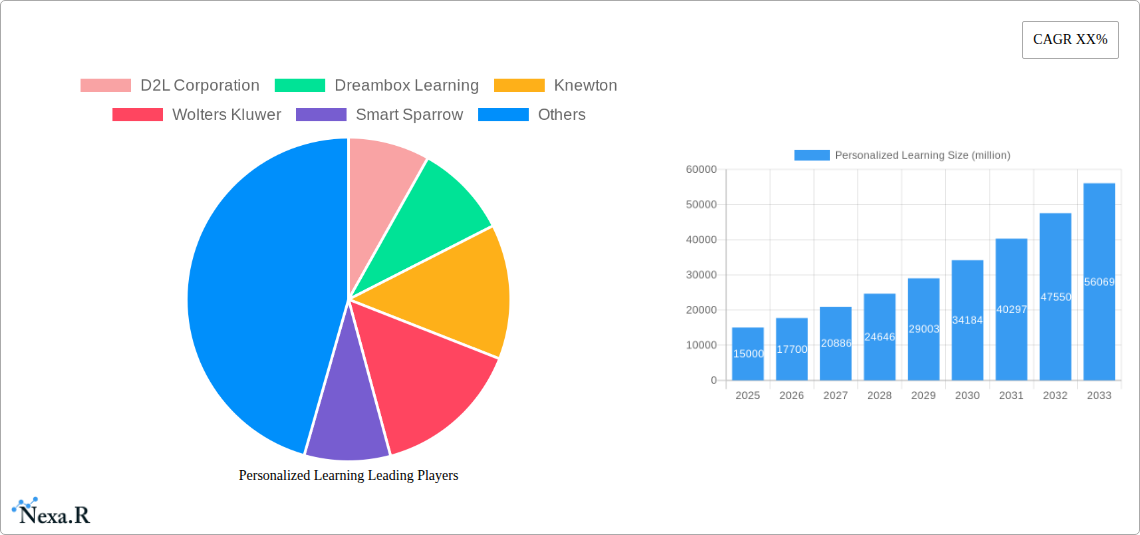
Personalized Learning Product Landscape
The Personalized Learning product landscape is characterized by a wave of innovative solutions designed to cater to diverse learning needs. Companies like D2L Corporation, Dreambox Learning, Knewton, Wolters Kluwer, Smart Sparrow, Edgenuity, Agile Education, and Intel are at the forefront, offering platforms that leverage adaptive algorithms, AI, and robust analytics to tailor content, pace, and feedback for individual learners. Unique selling propositions include real-time progress tracking, automated remediation for struggling students, and personalized recommendations for enrichment activities. Technological advancements are evident in the integration of gamification elements to boost engagement, the development of AI-powered tutors, and the creation of immersive learning experiences through virtual and augmented reality. Performance metrics focus on improved learning outcomes, increased student retention rates, and enhanced user satisfaction, with many platforms demonstrating an estimated 15-20% improvement in learning efficiency compared to traditional methods.
Key Drivers, Barriers & Challenges in Personalized Learning
Key Drivers:
- Technological Advancements: AI, machine learning, and data analytics are enabling more sophisticated and effective personalization.
- Demand for Improved Learning Outcomes: Educators and learners are seeking solutions that demonstrably enhance comprehension and retention.
- Shift Towards Lifelong Learning: Growing emphasis on continuous skill development and reskilling.
- Government Initiatives & Funding: Increased investment in digital education and edtech innovation.
- Flexibility and Accessibility: Demand for on-demand, self-paced learning experiences.
Barriers & Challenges:
- High Implementation Costs: Developing and deploying advanced personalized learning systems can be expensive.
- Digital Divide & Infrastructure Gaps: Unequal access to reliable internet and devices limits adoption in certain regions.
- Teacher Training and Adoption: Educators require training and support to effectively integrate personalized learning tools.
- Data Privacy and Security Concerns: Managing sensitive student data requires robust security measures.
- Algorithmic Bias: Ensuring fairness and equity in AI-driven personalization is crucial.
- Scalability of Human Support: Maintaining personalized human interaction alongside scalable technology remains a challenge. The estimated cost of developing a comprehensive personalized learning platform can range from $5 million to $15 million, posing a significant barrier for smaller institutions.
Emerging Opportunities in Personalized Learning
Emerging opportunities in Personalized Learning lie in the hyper-personalization of content through advanced AI and the integration of emerging technologies like extended reality (XR). Untapped markets include vocational training for specific industries and the growing demand for personalized mental health and well-being support integrated into educational platforms. Evolving consumer preferences are leaning towards micro-learning modules, adaptive assessment tools that provide immediate feedback, and platforms that foster collaborative, personalized learning experiences. The potential to create AI-driven career path guidance and personalized learning roadmaps for individuals is immense, offering a unique value proposition.
Growth Accelerators in the Personalized Learning Industry
Growth in the Personalized Learning industry is being accelerated by strategic partnerships between edtech providers and educational institutions, fostering wider adoption and tailored solutions. Technological breakthroughs in AI, particularly in natural language understanding and predictive analytics, are continuously enhancing the efficacy and scalability of personalized platforms. Market expansion strategies, including the development of localized content and multilingual support, are opening up new geographical markets. Furthermore, the increasing focus on data-driven decision-making by educational stakeholders is driving demand for platforms that provide actionable insights into student performance and learning patterns. The estimated investment in edtech R&D by leading companies is projected to exceed $3 billion annually by 2027, further fueling this acceleration.
Key Players Shaping the Personalized Learning Market
- D2L Corporation
- Dreambox Learning
- Knewton
- Wolters Kluwer
- Smart Sparrow
- Edgenuity
- Intel
- Agile Education
Notable Milestones in Personalized Learning Sector
- 2019: Rise of AI-powered adaptive learning platforms gaining significant traction in higher education.
- 2020: Increased adoption of personalized learning solutions for remote and hybrid K-12 education due to the global pandemic.
- 2021: Major edtech companies announce significant investments in AI and data analytics for personalized learning.
- 2022: Emergence of XR-integrated personalized learning experiences, offering immersive educational content.
- 2023: Growing emphasis on personalized learning for corporate reskilling and upskilling initiatives.
- 2024: Advancements in AI leading to more nuanced and effective student progress prediction and intervention strategies.
In-Depth Personalized Learning Market Outlook
The future outlook for the Personalized Learning market is exceptionally promising, driven by the sustained integration of advanced AI and data analytics. Growth accelerators such as strategic partnerships between technology providers and educational bodies, coupled with increasing global demand for flexible and effective learning solutions, will continue to propel the market forward. The expansion into emerging markets, particularly in developing regions with a growing youth population and increasing internet access, presents significant untapped potential. The market is expected to witness further innovation in areas like personalized career guidance, adaptive assessment, and XR-enhanced learning environments, solidifying its position as a transformative force in education. The estimated total market size is projected to reach over $100 billion by 2030, highlighting substantial long-term strategic opportunities.
Personalized Learning Segmentation
-
1. Application
- 1.1. Personal
- 1.2. Commercial
-
2. Types
- 2.1. Online Courses
- 2.2. Software & APP
- 2.3. Offline Guide
- 2.4. Other
Personalized Learning Segmentation By Geography
-
1. North America
- 1.1. United States
- 1.2. Canada
- 1.3. Mexico
-
2. South America
- 2.1. Brazil
- 2.2. Argentina
- 2.3. Rest of South America
-
3. Europe
- 3.1. United Kingdom
- 3.2. Germany
- 3.3. France
- 3.4. Italy
- 3.5. Spain
- 3.6. Russia
- 3.7. Benelux
- 3.8. Nordics
- 3.9. Rest of Europe
-
4. Middle East & Africa
- 4.1. Turkey
- 4.2. Israel
- 4.3. GCC
- 4.4. North Africa
- 4.5. South Africa
- 4.6. Rest of Middle East & Africa
-
5. Asia Pacific
- 5.1. China
- 5.2. India
- 5.3. Japan
- 5.4. South Korea
- 5.5. ASEAN
- 5.6. Oceania
- 5.7. Rest of Asia Pacific
Personalized Learning REPORT HIGHLIGHTS
| Aspects | Details |
|---|---|
| Study Period | 2019-2033 |
| Base Year | 2024 |
| Estimated Year | 2025 |
| Forecast Period | 2025-2033 |
| Historical Period | 2019-2024 |
| Growth Rate | CAGR of XX% from 2019-2033 |
| Segmentation |
|
Table of Contents
- 1. Introduction
- 1.1. Research Scope
- 1.2. Market Segmentation
- 1.3. Research Methodology
- 1.4. Definitions and Assumptions
- 2. Executive Summary
- 2.1. Introduction
- 3. Market Dynamics
- 3.1. Introduction
- 3.2. Market Drivers
- 3.3. Market Restrains
- 3.4. Market Trends
- 4. Market Factor Analysis
- 4.1. Porters Five Forces
- 4.2. Supply/Value Chain
- 4.3. PESTEL analysis
- 4.4. Market Entropy
- 4.5. Patent/Trademark Analysis
- 5. Global Personalized Learning Analysis, Insights and Forecast, 2019-2031
- 5.1. Market Analysis, Insights and Forecast - by Application
- 5.1.1. Personal
- 5.1.2. Commercial
- 5.2. Market Analysis, Insights and Forecast - by Types
- 5.2.1. Online Courses
- 5.2.2. Software & APP
- 5.2.3. Offline Guide
- 5.2.4. Other
- 5.3. Market Analysis, Insights and Forecast - by Region
- 5.3.1. North America
- 5.3.2. South America
- 5.3.3. Europe
- 5.3.4. Middle East & Africa
- 5.3.5. Asia Pacific
- 5.1. Market Analysis, Insights and Forecast - by Application
- 6. North America Personalized Learning Analysis, Insights and Forecast, 2019-2031
- 6.1. Market Analysis, Insights and Forecast - by Application
- 6.1.1. Personal
- 6.1.2. Commercial
- 6.2. Market Analysis, Insights and Forecast - by Types
- 6.2.1. Online Courses
- 6.2.2. Software & APP
- 6.2.3. Offline Guide
- 6.2.4. Other
- 6.1. Market Analysis, Insights and Forecast - by Application
- 7. South America Personalized Learning Analysis, Insights and Forecast, 2019-2031
- 7.1. Market Analysis, Insights and Forecast - by Application
- 7.1.1. Personal
- 7.1.2. Commercial
- 7.2. Market Analysis, Insights and Forecast - by Types
- 7.2.1. Online Courses
- 7.2.2. Software & APP
- 7.2.3. Offline Guide
- 7.2.4. Other
- 7.1. Market Analysis, Insights and Forecast - by Application
- 8. Europe Personalized Learning Analysis, Insights and Forecast, 2019-2031
- 8.1. Market Analysis, Insights and Forecast - by Application
- 8.1.1. Personal
- 8.1.2. Commercial
- 8.2. Market Analysis, Insights and Forecast - by Types
- 8.2.1. Online Courses
- 8.2.2. Software & APP
- 8.2.3. Offline Guide
- 8.2.4. Other
- 8.1. Market Analysis, Insights and Forecast - by Application
- 9. Middle East & Africa Personalized Learning Analysis, Insights and Forecast, 2019-2031
- 9.1. Market Analysis, Insights and Forecast - by Application
- 9.1.1. Personal
- 9.1.2. Commercial
- 9.2. Market Analysis, Insights and Forecast - by Types
- 9.2.1. Online Courses
- 9.2.2. Software & APP
- 9.2.3. Offline Guide
- 9.2.4. Other
- 9.1. Market Analysis, Insights and Forecast - by Application
- 10. Asia Pacific Personalized Learning Analysis, Insights and Forecast, 2019-2031
- 10.1. Market Analysis, Insights and Forecast - by Application
- 10.1.1. Personal
- 10.1.2. Commercial
- 10.2. Market Analysis, Insights and Forecast - by Types
- 10.2.1. Online Courses
- 10.2.2. Software & APP
- 10.2.3. Offline Guide
- 10.2.4. Other
- 10.1. Market Analysis, Insights and Forecast - by Application
- 11. Competitive Analysis
- 11.1. Global Market Share Analysis 2024
- 11.2. Company Profiles
- 11.2.1 D2L Corporation
- 11.2.1.1. Overview
- 11.2.1.2. Products
- 11.2.1.3. SWOT Analysis
- 11.2.1.4. Recent Developments
- 11.2.1.5. Financials (Based on Availability)
- 11.2.2 Dreambox Learning
- 11.2.2.1. Overview
- 11.2.2.2. Products
- 11.2.2.3. SWOT Analysis
- 11.2.2.4. Recent Developments
- 11.2.2.5. Financials (Based on Availability)
- 11.2.3 Knewton
- 11.2.3.1. Overview
- 11.2.3.2. Products
- 11.2.3.3. SWOT Analysis
- 11.2.3.4. Recent Developments
- 11.2.3.5. Financials (Based on Availability)
- 11.2.4 Wolters Kluwer
- 11.2.4.1. Overview
- 11.2.4.2. Products
- 11.2.4.3. SWOT Analysis
- 11.2.4.4. Recent Developments
- 11.2.4.5. Financials (Based on Availability)
- 11.2.5 Smart Sparrow
- 11.2.5.1. Overview
- 11.2.5.2. Products
- 11.2.5.3. SWOT Analysis
- 11.2.5.4. Recent Developments
- 11.2.5.5. Financials (Based on Availability)
- 11.2.6 Edgenuity
- 11.2.6.1. Overview
- 11.2.6.2. Products
- 11.2.6.3. SWOT Analysis
- 11.2.6.4. Recent Developments
- 11.2.6.5. Financials (Based on Availability)
- 11.2.7 Intel
- 11.2.7.1. Overview
- 11.2.7.2. Products
- 11.2.7.3. SWOT Analysis
- 11.2.7.4. Recent Developments
- 11.2.7.5. Financials (Based on Availability)
- 11.2.8 Agile Education
- 11.2.8.1. Overview
- 11.2.8.2. Products
- 11.2.8.3. SWOT Analysis
- 11.2.8.4. Recent Developments
- 11.2.8.5. Financials (Based on Availability)
- 11.2.1 D2L Corporation
List of Figures
- Figure 1: Global Personalized Learning Revenue Breakdown (million, %) by Region 2024 & 2032
- Figure 2: North America Personalized Learning Revenue (million), by Application 2024 & 2032
- Figure 3: North America Personalized Learning Revenue Share (%), by Application 2024 & 2032
- Figure 4: North America Personalized Learning Revenue (million), by Types 2024 & 2032
- Figure 5: North America Personalized Learning Revenue Share (%), by Types 2024 & 2032
- Figure 6: North America Personalized Learning Revenue (million), by Country 2024 & 2032
- Figure 7: North America Personalized Learning Revenue Share (%), by Country 2024 & 2032
- Figure 8: South America Personalized Learning Revenue (million), by Application 2024 & 2032
- Figure 9: South America Personalized Learning Revenue Share (%), by Application 2024 & 2032
- Figure 10: South America Personalized Learning Revenue (million), by Types 2024 & 2032
- Figure 11: South America Personalized Learning Revenue Share (%), by Types 2024 & 2032
- Figure 12: South America Personalized Learning Revenue (million), by Country 2024 & 2032
- Figure 13: South America Personalized Learning Revenue Share (%), by Country 2024 & 2032
- Figure 14: Europe Personalized Learning Revenue (million), by Application 2024 & 2032
- Figure 15: Europe Personalized Learning Revenue Share (%), by Application 2024 & 2032
- Figure 16: Europe Personalized Learning Revenue (million), by Types 2024 & 2032
- Figure 17: Europe Personalized Learning Revenue Share (%), by Types 2024 & 2032
- Figure 18: Europe Personalized Learning Revenue (million), by Country 2024 & 2032
- Figure 19: Europe Personalized Learning Revenue Share (%), by Country 2024 & 2032
- Figure 20: Middle East & Africa Personalized Learning Revenue (million), by Application 2024 & 2032
- Figure 21: Middle East & Africa Personalized Learning Revenue Share (%), by Application 2024 & 2032
- Figure 22: Middle East & Africa Personalized Learning Revenue (million), by Types 2024 & 2032
- Figure 23: Middle East & Africa Personalized Learning Revenue Share (%), by Types 2024 & 2032
- Figure 24: Middle East & Africa Personalized Learning Revenue (million), by Country 2024 & 2032
- Figure 25: Middle East & Africa Personalized Learning Revenue Share (%), by Country 2024 & 2032
- Figure 26: Asia Pacific Personalized Learning Revenue (million), by Application 2024 & 2032
- Figure 27: Asia Pacific Personalized Learning Revenue Share (%), by Application 2024 & 2032
- Figure 28: Asia Pacific Personalized Learning Revenue (million), by Types 2024 & 2032
- Figure 29: Asia Pacific Personalized Learning Revenue Share (%), by Types 2024 & 2032
- Figure 30: Asia Pacific Personalized Learning Revenue (million), by Country 2024 & 2032
- Figure 31: Asia Pacific Personalized Learning Revenue Share (%), by Country 2024 & 2032
List of Tables
- Table 1: Global Personalized Learning Revenue million Forecast, by Region 2019 & 2032
- Table 2: Global Personalized Learning Revenue million Forecast, by Application 2019 & 2032
- Table 3: Global Personalized Learning Revenue million Forecast, by Types 2019 & 2032
- Table 4: Global Personalized Learning Revenue million Forecast, by Region 2019 & 2032
- Table 5: Global Personalized Learning Revenue million Forecast, by Application 2019 & 2032
- Table 6: Global Personalized Learning Revenue million Forecast, by Types 2019 & 2032
- Table 7: Global Personalized Learning Revenue million Forecast, by Country 2019 & 2032
- Table 8: United States Personalized Learning Revenue (million) Forecast, by Application 2019 & 2032
- Table 9: Canada Personalized Learning Revenue (million) Forecast, by Application 2019 & 2032
- Table 10: Mexico Personalized Learning Revenue (million) Forecast, by Application 2019 & 2032
- Table 11: Global Personalized Learning Revenue million Forecast, by Application 2019 & 2032
- Table 12: Global Personalized Learning Revenue million Forecast, by Types 2019 & 2032
- Table 13: Global Personalized Learning Revenue million Forecast, by Country 2019 & 2032
- Table 14: Brazil Personalized Learning Revenue (million) Forecast, by Application 2019 & 2032
- Table 15: Argentina Personalized Learning Revenue (million) Forecast, by Application 2019 & 2032
- Table 16: Rest of South America Personalized Learning Revenue (million) Forecast, by Application 2019 & 2032
- Table 17: Global Personalized Learning Revenue million Forecast, by Application 2019 & 2032
- Table 18: Global Personalized Learning Revenue million Forecast, by Types 2019 & 2032
- Table 19: Global Personalized Learning Revenue million Forecast, by Country 2019 & 2032
- Table 20: United Kingdom Personalized Learning Revenue (million) Forecast, by Application 2019 & 2032
- Table 21: Germany Personalized Learning Revenue (million) Forecast, by Application 2019 & 2032
- Table 22: France Personalized Learning Revenue (million) Forecast, by Application 2019 & 2032
- Table 23: Italy Personalized Learning Revenue (million) Forecast, by Application 2019 & 2032
- Table 24: Spain Personalized Learning Revenue (million) Forecast, by Application 2019 & 2032
- Table 25: Russia Personalized Learning Revenue (million) Forecast, by Application 2019 & 2032
- Table 26: Benelux Personalized Learning Revenue (million) Forecast, by Application 2019 & 2032
- Table 27: Nordics Personalized Learning Revenue (million) Forecast, by Application 2019 & 2032
- Table 28: Rest of Europe Personalized Learning Revenue (million) Forecast, by Application 2019 & 2032
- Table 29: Global Personalized Learning Revenue million Forecast, by Application 2019 & 2032
- Table 30: Global Personalized Learning Revenue million Forecast, by Types 2019 & 2032
- Table 31: Global Personalized Learning Revenue million Forecast, by Country 2019 & 2032
- Table 32: Turkey Personalized Learning Revenue (million) Forecast, by Application 2019 & 2032
- Table 33: Israel Personalized Learning Revenue (million) Forecast, by Application 2019 & 2032
- Table 34: GCC Personalized Learning Revenue (million) Forecast, by Application 2019 & 2032
- Table 35: North Africa Personalized Learning Revenue (million) Forecast, by Application 2019 & 2032
- Table 36: South Africa Personalized Learning Revenue (million) Forecast, by Application 2019 & 2032
- Table 37: Rest of Middle East & Africa Personalized Learning Revenue (million) Forecast, by Application 2019 & 2032
- Table 38: Global Personalized Learning Revenue million Forecast, by Application 2019 & 2032
- Table 39: Global Personalized Learning Revenue million Forecast, by Types 2019 & 2032
- Table 40: Global Personalized Learning Revenue million Forecast, by Country 2019 & 2032
- Table 41: China Personalized Learning Revenue (million) Forecast, by Application 2019 & 2032
- Table 42: India Personalized Learning Revenue (million) Forecast, by Application 2019 & 2032
- Table 43: Japan Personalized Learning Revenue (million) Forecast, by Application 2019 & 2032
- Table 44: South Korea Personalized Learning Revenue (million) Forecast, by Application 2019 & 2032
- Table 45: ASEAN Personalized Learning Revenue (million) Forecast, by Application 2019 & 2032
- Table 46: Oceania Personalized Learning Revenue (million) Forecast, by Application 2019 & 2032
- Table 47: Rest of Asia Pacific Personalized Learning Revenue (million) Forecast, by Application 2019 & 2032
Frequently Asked Questions
1. What is the projected Compound Annual Growth Rate (CAGR) of the Personalized Learning?
The projected CAGR is approximately XX%.
2. Which companies are prominent players in the Personalized Learning?
Key companies in the market include D2L Corporation, Dreambox Learning, Knewton, Wolters Kluwer, Smart Sparrow, Edgenuity, Intel, Agile Education.
3. What are the main segments of the Personalized Learning?
The market segments include Application, Types.
4. Can you provide details about the market size?
The market size is estimated to be USD XXX million as of 2022.
5. What are some drivers contributing to market growth?
N/A
6. What are the notable trends driving market growth?
N/A
7. Are there any restraints impacting market growth?
N/A
8. Can you provide examples of recent developments in the market?
N/A
9. What pricing options are available for accessing the report?
Pricing options include single-user, multi-user, and enterprise licenses priced at USD 4900.00, USD 7350.00, and USD 9800.00 respectively.
10. Is the market size provided in terms of value or volume?
The market size is provided in terms of value, measured in million.
11. Are there any specific market keywords associated with the report?
Yes, the market keyword associated with the report is "Personalized Learning," which aids in identifying and referencing the specific market segment covered.
12. How do I determine which pricing option suits my needs best?
The pricing options vary based on user requirements and access needs. Individual users may opt for single-user licenses, while businesses requiring broader access may choose multi-user or enterprise licenses for cost-effective access to the report.
13. Are there any additional resources or data provided in the Personalized Learning report?
While the report offers comprehensive insights, it's advisable to review the specific contents or supplementary materials provided to ascertain if additional resources or data are available.
14. How can I stay updated on further developments or reports in the Personalized Learning?
To stay informed about further developments, trends, and reports in the Personalized Learning, consider subscribing to industry newsletters, following relevant companies and organizations, or regularly checking reputable industry news sources and publications.
Methodology
Step 1 - Identification of Relevant Samples Size from Population Database


Step 2 - Approaches for Defining Global Market Size (Value, Volume* & Price*)

Note*: In applicable scenarios
Step 3 - Data Sources
Primary Research
- Web Analytics
- Survey Reports
- Research Institute
- Latest Research Reports
- Opinion Leaders
Secondary Research
- Annual Reports
- White Paper
- Latest Press Release
- Industry Association
- Paid Database
- Investor Presentations

Step 4 - Data Triangulation
Involves using different sources of information in order to increase the validity of a study
These sources are likely to be stakeholders in a program - participants, other researchers, program staff, other community members, and so on.
Then we put all data in single framework & apply various statistical tools to find out the dynamic on the market.
During the analysis stage, feedback from the stakeholder groups would be compared to determine areas of agreement as well as areas of divergence
