

Key Insights
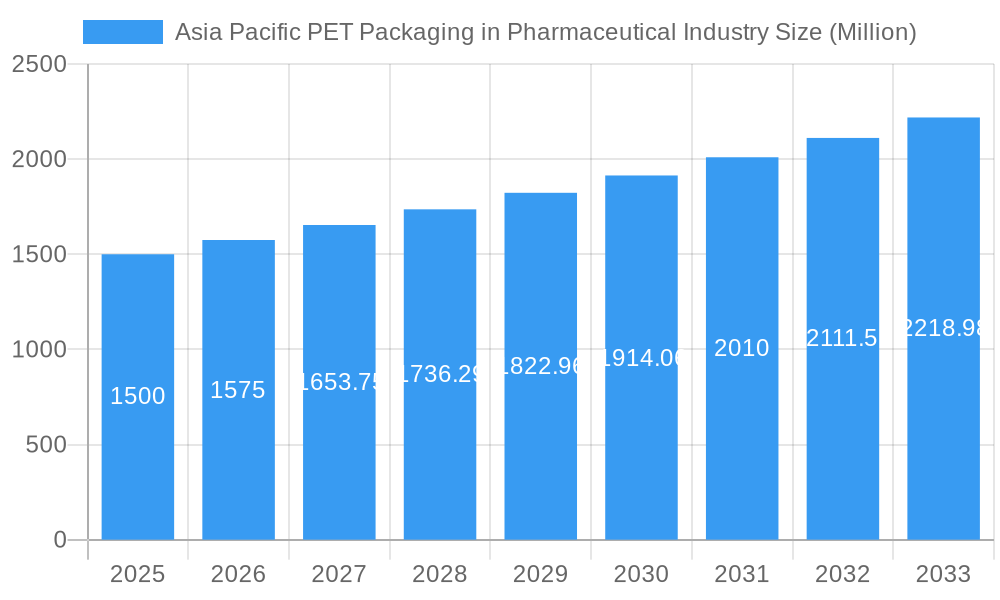
The Asia-Pacific pharmaceutical PET packaging market is projected for substantial expansion, anticipated to reach $4.12 billion by 2025, with a Compound Annual Growth Rate (CAGR) of 6.81% from 2025 to 2033. This growth is primarily driven by the escalating prevalence of chronic diseases, increasing pharmaceutical consumption, and a discernible shift towards lightweight, shatter-resistant, and recyclable PET packaging over traditional glass. Innovations in PET technology, enhancing barrier properties and enabling specialized designs such as dropper bottles and blister packs, further stimulate demand. Tablet and syrup bottles are identified as high-growth segments due to the widespread use of oral medications. Key markets include China, India, and Japan, supported by robust pharmaceutical industries and expanding healthcare infrastructure. Potential restraints include stringent regulatory compliance and raw material price volatility.
Asia Pacific PET Packaging in Pharmaceutical Industry Market Size (In Billion)
The competitive landscape features multinational corporations and regional players focused on global reach, technological expertise, and localized market needs. Consolidation through acquisitions, strategic partnerships, and technological collaborations are key trends. Manufacturers prioritizing sustainable packaging solutions and specialized formats are poised for a competitive advantage, underpinned by the consistent demand for pharmaceuticals and the inherent benefits of PET packaging within the industry.
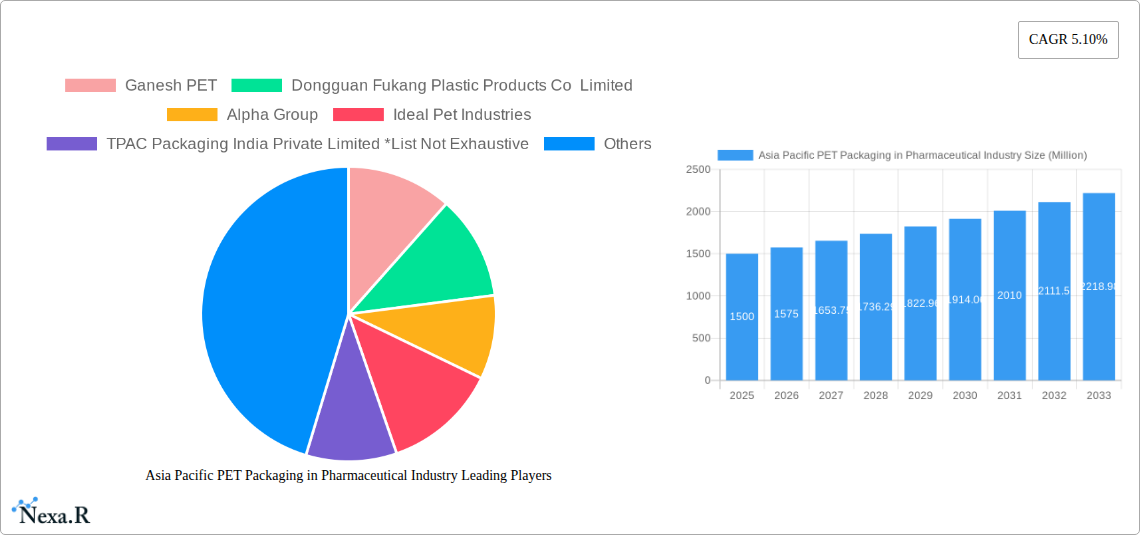
Asia Pacific PET Packaging in Pharmaceutical Industry Company Market Share
Asia Pacific PET Packaging in Pharmaceutical Industry: A Comprehensive Market Report (2019-2033)
This in-depth report provides a comprehensive analysis of the Asia Pacific PET packaging market within the pharmaceutical industry, offering invaluable insights for industry professionals, investors, and strategic decision-makers. The report covers the period from 2019 to 2033, with a focus on the forecast period of 2025-2033 and a base year of 2025. Market values are presented in million units.
Asia Pacific PET Packaging in Pharmaceutical Industry Market Dynamics & Structure
This section analyzes the market's competitive landscape, technological advancements, regulatory environment, and key trends influencing growth. The analysis incorporates quantitative data on market share and M&A activity, alongside qualitative insights into innovation challenges and market dynamics.
- Market Concentration: The Asia Pacific pharmaceutical PET packaging market exhibits a moderately consolidated structure, with several major players and a significant number of smaller regional companies. The top five players hold an estimated xx% market share in 2025.
- Technological Innovation: Technological advancements in PET resin production, barrier technologies (e.g., oxygen scavengers), and lightweighting are driving innovation. However, high upfront investment costs and stringent regulatory requirements pose significant barriers to entry for smaller players.
- Regulatory Frameworks: Stringent regulatory requirements concerning material safety and packaging integrity vary across different countries in the Asia Pacific region, creating complexities for manufacturers. Compliance costs and varying standards impact operational efficiency and market expansion strategies.
- Competitive Product Substitutes: While PET remains dominant, competition exists from alternative packaging materials like glass, HDPE, and other polymers. The choice depends on factors like cost, barrier properties, and sustainability considerations.
- End-User Demographics & M&A Trends: The increasing demand for pharmaceutical products, driven by a growing and aging population, fuels the growth of the PET packaging market. The number of M&A deals in this sector averaged xx annually during 2019-2024, signaling consolidation trends.
Asia Pacific PET Packaging in Pharmaceutical Industry Growth Trends & Insights
This section delivers a detailed analysis of market size evolution, adoption rates, technological disruptions, and consumer behavior shifts, providing a comprehensive understanding of the market's growth trajectory. The analysis utilizes various quantitative metrics to underpin the qualitative observations.
The Asia Pacific pharmaceutical PET packaging market experienced substantial growth between 2019 and 2024, registering a CAGR of xx%. This growth is attributable to several factors, including increasing pharmaceutical production, rising consumer preference for convenient packaging, and the cost-effectiveness of PET compared to alternatives. The market is expected to maintain a robust growth trajectory throughout the forecast period (2025-2033), driven by factors such as the expanding pharmaceutical sector, increasing adoption of PET in diverse pharmaceutical applications, and ongoing technological advancements enhancing PET's performance characteristics. Further analysis reveals that the market penetration rate for PET packaging in the pharmaceutical industry in the Asia Pacific region stands at approximately xx% in 2025, with significant potential for future expansion.
Dominant Regions, Countries, or Segments in Asia Pacific PET Packaging in Pharmaceutical Industry
This section identifies the leading regions, countries, and segments within the market, explaining their dominance factors. It leverages detailed analysis to highlight key growth drivers and market potential.
- China and India: These two countries are the largest markets, representing xx% and yy% of the total market in 2025 respectively. The robust growth in their pharmaceutical industries and increasing demand for cost-effective packaging drive their dominance.
- Product Type: Tablet bottles and syrup bottles constitute the largest segments, accounting for xx% of the total market in 2025, driven by their widespread usage in pharmaceutical product packaging.
- Color: Transparent PET remains the most prevalent color due to its ease of inspection and product visibility, holding over xx% market share in 2025.
- Growth Drivers: Strong economic growth in several Asian economies, expanding healthcare infrastructure, and increasing government initiatives supporting the pharmaceutical industry are key drivers for market growth.
Asia Pacific PET Packaging in Pharmaceutical Industry Product Landscape
This section offers a concise overview of product innovations, applications, and performance characteristics. It also highlights unique selling propositions and technological advancements that are shaping the product landscape.
The Asia Pacific pharmaceutical PET packaging market showcases a diverse range of products tailored to specific pharmaceutical applications. Innovations include lightweight designs for reduced material costs, improved barrier technologies for enhanced product protection, and the integration of tamper-evident features to enhance security. The focus on sustainability is driving the development of recycled PET (rPET) packaging options. Furthermore, specialized coatings and surface treatments are being developed to improve PET's compatibility with various pharmaceutical formulations.
Key Drivers, Barriers & Challenges in Asia Pacific PET Packaging in Pharmaceutical Industry
This section outlines the primary growth drivers, challenges, and restraints impacting the market.
Key Drivers:
- Increasing demand for pharmaceutical products.
- Cost-effectiveness of PET compared to alternatives.
- Technological advancements in PET resin production.
Key Challenges:
- Fluctuations in raw material prices.
- Stringent regulatory requirements.
- Competition from alternative packaging materials. Supply chain disruptions due to geopolitical instability and the COVID-19 pandemic added further complexity and cost.
Emerging Opportunities in Asia Pacific PET Packaging in Pharmaceutical Industry
This section highlights emerging opportunities within the market.
- Growing demand for sustainable and eco-friendly packaging solutions.
- Expanding use of PET in specialized pharmaceutical applications (e.g., injectables).
- Opportunities in untapped markets within the Asia Pacific region.
Growth Accelerators in the Asia Pacific PET Packaging in Pharmaceutical Industry Industry
This section discusses long-term growth catalysts.
The long-term growth of the Asia Pacific pharmaceutical PET packaging market is expected to be fueled by continued technological innovation, strategic partnerships between packaging companies and pharmaceutical manufacturers, and increased adoption of PET in emerging markets across the region. Expansion into new product applications and the rising focus on sustainable packaging practices will also contribute significantly to future market growth.
Key Players Shaping the Asia Pacific PET Packaging in Pharmaceutical Industry Market
- Ganesh PET
- Dongguan Fukang Plastic Products Co Limited
- Alpha Group
- Ideal Pet Industries
- TPAC Packaging India Private Limited
- Senpet Polymers LLP
- Total PET (Radico Khaitan Ltd)
- Takemoto Packaging Inc
- AG Poly Packs Private Limited
- Gerresheimer AG
- Kang-Jia Co Ltd
Notable Milestones in Asia Pacific PET Packaging in Pharmaceutical Industry Sector
- 2020: Introduction of several new PET packaging designs incorporating barrier technologies by leading manufacturers.
- 2022: Successful launch of recycled PET (rPET) packaging options by several key players in India.
- 2023: Several significant M&A transactions involving key players in China and Japan. (Specific details are confidential and can be provided in the full report).
In-Depth Asia Pacific PET Packaging in Pharmaceutical Industry Market Outlook
The Asia Pacific pharmaceutical PET packaging market is poised for significant growth over the next decade. Continued innovations in PET technology, the growing pharmaceutical sector, and the rising emphasis on sustainable packaging solutions will create a favorable environment for market expansion. Strategic partnerships, investments in advanced manufacturing capabilities, and market diversification strategies will be crucial for players seeking to gain a competitive edge.
Asia Pacific PET Packaging in Pharmaceutical Industry Segmentation
-
1. Product Type
- 1.1. Tablet Bottles
- 1.2. Syrup Bottles
- 1.3. Vials
- 1.4. Dropper Bottles
- 1.5. Handwash and Hand Sanitizer Bottles
- 1.6. Mouthwash Bottles
- 1.7. Other Product Types
-
2. Color
- 2.1. Transparent
- 2.2. Green
- 2.3. Amber
Asia Pacific PET Packaging in Pharmaceutical Industry Segmentation By Geography
-
1. Asia Pacific
- 1.1. China
- 1.2. Japan
- 1.3. South Korea
- 1.4. India
- 1.5. Australia
- 1.6. New Zealand
- 1.7. Indonesia
- 1.8. Malaysia
- 1.9. Singapore
- 1.10. Thailand
- 1.11. Vietnam
- 1.12. Philippines
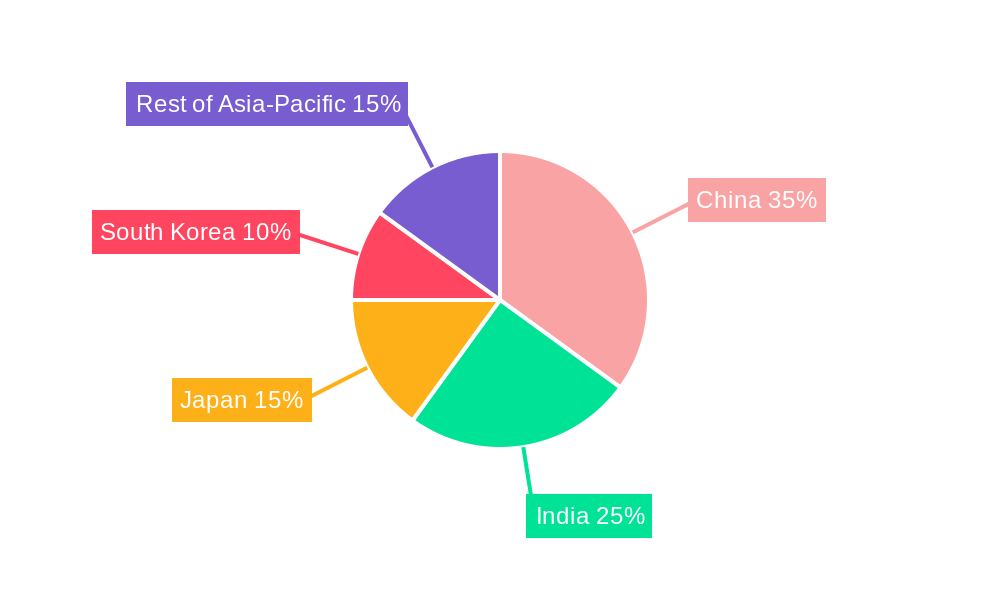
Asia Pacific PET Packaging in Pharmaceutical Industry Regional Market Share
Geographic Coverage of Asia Pacific PET Packaging in Pharmaceutical Industry
Asia Pacific PET Packaging in Pharmaceutical Industry REPORT HIGHLIGHTS
| Aspects | Details |
|---|---|
| Study Period | 2020-2034 |
| Base Year | 2025 |
| Estimated Year | 2026 |
| Forecast Period | 2026-2034 |
| Historical Period | 2020-2025 |
| Growth Rate | CAGR of 6.81% from 2020-2034 |
| Segmentation |
|
Table of Contents
- 1. Introduction
- 1.1. Research Scope
- 1.2. Market Segmentation
- 1.3. Research Objective
- 1.4. Definitions and Assumptions
- 2. Executive Summary
- 2.1. Market Snapshot
- 3. Market Dynamics
- 3.1. Market Drivers
- 3.2. Market Restrains
- 3.3. Market Trends
- 3.4. Market Opportunities
- 4. Market Factor Analysis
- 4.1. Porters Five Forces
- 4.1.1. Bargaining Power of Suppliers
- 4.1.2. Bargaining Power of Buyers
- 4.1.3. Threat of New Entrants
- 4.1.4. Threat of Substitutes
- 4.1.5. Competitive Rivalry
- 4.2. PESTEL analysis
- 4.3. BCG Analysis
- 4.3.1. Stars (High Growth, High Market Share)
- 4.3.2. Cash Cows (Low Growth, High Market Share)
- 4.3.3. Question Mark (High Growth, Low Market Share)
- 4.3.4. Dogs (Low Growth, Low Market Share)
- 4.4. Ansoff Matrix Analysis
- 4.5. Supply Chain Analysis
- 4.6. Regulatory Landscape
- 4.7. Current Market Potential and Opportunity Assessment (TAM–SAM–SOM Framework)
- 4.8. NRP Analyst Note
- 4.1. Porters Five Forces
- 5. Market Analysis, Insights and Forecast 2021-2033
- 5.1. Market Analysis, Insights and Forecast - by Product Type
- 5.1.1. Tablet Bottles
- 5.1.2. Syrup Bottles
- 5.1.3. Vials
- 5.1.4. Dropper Bottles
- 5.1.5. Handwash and Hand Sanitizer Bottles
- 5.1.6. Mouthwash Bottles
- 5.1.7. Other Product Types
- 5.2. Market Analysis, Insights and Forecast - by Color
- 5.2.1. Transparent
- 5.2.2. Green
- 5.2.3. Amber
- 5.3. Market Analysis, Insights and Forecast - by Region
- 5.3.1. Asia Pacific
- 5.1. Market Analysis, Insights and Forecast - by Product Type
- 6. Asia Pacific PET Packaging in Pharmaceutical Industry Analysis, Insights and Forecast, 2021-2033
- 6.1. Market Analysis, Insights and Forecast - by Product Type
- 6.1.1. Tablet Bottles
- 6.1.2. Syrup Bottles
- 6.1.3. Vials
- 6.1.4. Dropper Bottles
- 6.1.5. Handwash and Hand Sanitizer Bottles
- 6.1.6. Mouthwash Bottles
- 6.1.7. Other Product Types
- 6.2. Market Analysis, Insights and Forecast - by Color
- 6.2.1. Transparent
- 6.2.2. Green
- 6.2.3. Amber
- 6.1. Market Analysis, Insights and Forecast - by Product Type
- 7. Competitive Analysis
- 7.1. Company Profiles
- 7.1.1 Ganesh PET
- 7.1.1.1. Company Overview
- 7.1.1.2. Products
- 7.1.1.3. Company Financials
- 7.1.1.4. SWOT Analysis
- 7.1.2 Dongguan Fukang Plastic Products Co Limited
- 7.1.2.1. Company Overview
- 7.1.2.2. Products
- 7.1.2.3. Company Financials
- 7.1.2.4. SWOT Analysis
- 7.1.3 Alpha Group
- 7.1.3.1. Company Overview
- 7.1.3.2. Products
- 7.1.3.3. Company Financials
- 7.1.3.4. SWOT Analysis
- 7.1.4 Ideal Pet Industries
- 7.1.4.1. Company Overview
- 7.1.4.2. Products
- 7.1.4.3. Company Financials
- 7.1.4.4. SWOT Analysis
- 7.1.5 TPAC Packaging India Private Limited *List Not Exhaustive
- 7.1.5.1. Company Overview
- 7.1.5.2. Products
- 7.1.5.3. Company Financials
- 7.1.5.4. SWOT Analysis
- 7.1.6 Senpet Polymers LLP
- 7.1.6.1. Company Overview
- 7.1.6.2. Products
- 7.1.6.3. Company Financials
- 7.1.6.4. SWOT Analysis
- 7.1.7 Total PET (Radico Khaitan Ltd)
- 7.1.7.1. Company Overview
- 7.1.7.2. Products
- 7.1.7.3. Company Financials
- 7.1.7.4. SWOT Analysis
- 7.1.8 Takemoto Packaging Inc
- 7.1.8.1. Company Overview
- 7.1.8.2. Products
- 7.1.8.3. Company Financials
- 7.1.8.4. SWOT Analysis
- 7.1.9 AG Poly Packs Private Limited
- 7.1.9.1. Company Overview
- 7.1.9.2. Products
- 7.1.9.3. Company Financials
- 7.1.9.4. SWOT Analysis
- 7.1.10 Gerresheimer AG
- 7.1.10.1. Company Overview
- 7.1.10.2. Products
- 7.1.10.3. Company Financials
- 7.1.10.4. SWOT Analysis
- 7.1.11 Kang-Jia Co Ltd
- 7.1.11.1. Company Overview
- 7.1.11.2. Products
- 7.1.11.3. Company Financials
- 7.1.11.4. SWOT Analysis
- 7.1.1 Ganesh PET
- 7.2. Market Entropy
- 7.2.1 Company's Key Areas Served
- 7.2.2 Recent Developments
- 7.3. Company Market Share Analysis 2025
- 7.3.1 Top 5 Companies Market Share Analysis
- 7.3.2 Top 3 Companies Market Share Analysis
- 7.4. List of Potential Customers
- 8. Research Methodology
List of Figures
- Figure 1: Asia Pacific PET Packaging in Pharmaceutical Industry Revenue Breakdown (billion, %) by Product 2025 & 2033
- Figure 2: Asia Pacific PET Packaging in Pharmaceutical Industry Share (%) by Company 2025
List of Tables
- Table 1: Asia Pacific PET Packaging in Pharmaceutical Industry Revenue billion Forecast, by Product Type 2020 & 2033
- Table 2: Asia Pacific PET Packaging in Pharmaceutical Industry Revenue billion Forecast, by Color 2020 & 2033
- Table 3: Asia Pacific PET Packaging in Pharmaceutical Industry Revenue billion Forecast, by Region 2020 & 2033
- Table 4: Asia Pacific PET Packaging in Pharmaceutical Industry Revenue billion Forecast, by Product Type 2020 & 2033
- Table 5: Asia Pacific PET Packaging in Pharmaceutical Industry Revenue billion Forecast, by Color 2020 & 2033
- Table 6: Asia Pacific PET Packaging in Pharmaceutical Industry Revenue billion Forecast, by Country 2020 & 2033
- Table 7: China Asia Pacific PET Packaging in Pharmaceutical Industry Revenue (billion) Forecast, by Application 2020 & 2033
- Table 8: Japan Asia Pacific PET Packaging in Pharmaceutical Industry Revenue (billion) Forecast, by Application 2020 & 2033
- Table 9: South Korea Asia Pacific PET Packaging in Pharmaceutical Industry Revenue (billion) Forecast, by Application 2020 & 2033
- Table 10: India Asia Pacific PET Packaging in Pharmaceutical Industry Revenue (billion) Forecast, by Application 2020 & 2033
- Table 11: Australia Asia Pacific PET Packaging in Pharmaceutical Industry Revenue (billion) Forecast, by Application 2020 & 2033
- Table 12: New Zealand Asia Pacific PET Packaging in Pharmaceutical Industry Revenue (billion) Forecast, by Application 2020 & 2033
- Table 13: Indonesia Asia Pacific PET Packaging in Pharmaceutical Industry Revenue (billion) Forecast, by Application 2020 & 2033
- Table 14: Malaysia Asia Pacific PET Packaging in Pharmaceutical Industry Revenue (billion) Forecast, by Application 2020 & 2033
- Table 15: Singapore Asia Pacific PET Packaging in Pharmaceutical Industry Revenue (billion) Forecast, by Application 2020 & 2033
- Table 16: Thailand Asia Pacific PET Packaging in Pharmaceutical Industry Revenue (billion) Forecast, by Application 2020 & 2033
- Table 17: Vietnam Asia Pacific PET Packaging in Pharmaceutical Industry Revenue (billion) Forecast, by Application 2020 & 2033
- Table 18: Philippines Asia Pacific PET Packaging in Pharmaceutical Industry Revenue (billion) Forecast, by Application 2020 & 2033
Frequently Asked Questions
1. What is the projected Compound Annual Growth Rate (CAGR) of the Asia Pacific PET Packaging in Pharmaceutical Industry?
The projected CAGR is approximately 6.81%.
2. Which companies are prominent players in the Asia Pacific PET Packaging in Pharmaceutical Industry?
Key companies in the market include Ganesh PET, Dongguan Fukang Plastic Products Co Limited, Alpha Group, Ideal Pet Industries, TPAC Packaging India Private Limited *List Not Exhaustive, Senpet Polymers LLP, Total PET (Radico Khaitan Ltd), Takemoto Packaging Inc, AG Poly Packs Private Limited, Gerresheimer AG, Kang-Jia Co Ltd.
3. What are the main segments of the Asia Pacific PET Packaging in Pharmaceutical Industry?
The market segments include Product Type, Color.
4. Can you provide details about the market size?
The market size is estimated to be USD 4.12 billion as of 2022.
5. What are some drivers contributing to market growth?
; Increasing spending on healthcare and Pharmaceutical to augment the market growth.
6. What are the notable trends driving market growth?
Bottles to Witness Significant Growth Rate.
7. Are there any restraints impacting market growth?
Fluctuations in Raw Material Cost due to Suppliers’ Bargaining Power.
8. Can you provide examples of recent developments in the market?
N/A
9. What pricing options are available for accessing the report?
Pricing options include single-user, multi-user, and enterprise licenses priced at USD 3800, USD 4500, and USD 5800 respectively.
10. Is the market size provided in terms of value or volume?
The market size is provided in terms of value, measured in billion.
11. Are there any specific market keywords associated with the report?
Yes, the market keyword associated with the report is "Asia Pacific PET Packaging in Pharmaceutical Industry," which aids in identifying and referencing the specific market segment covered.
12. How do I determine which pricing option suits my needs best?
The pricing options vary based on user requirements and access needs. Individual users may opt for single-user licenses, while businesses requiring broader access may choose multi-user or enterprise licenses for cost-effective access to the report.
13. Are there any additional resources or data provided in the Asia Pacific PET Packaging in Pharmaceutical Industry report?
While the report offers comprehensive insights, it's advisable to review the specific contents or supplementary materials provided to ascertain if additional resources or data are available.
14. How can I stay updated on further developments or reports in the Asia Pacific PET Packaging in Pharmaceutical Industry?
To stay informed about further developments, trends, and reports in the Asia Pacific PET Packaging in Pharmaceutical Industry, consider subscribing to industry newsletters, following relevant companies and organizations, or regularly checking reputable industry news sources and publications.
Methodology
Step 1 - Identification of Relevant Samples Size from Population Database


Step 2 - Approaches for Defining Global Market Size (Value, Volume* & Price*)

Note*: In applicable scenarios
Step 3 - Data Sources
Primary Research
- Web Analytics
- Survey Reports
- Research Institute
- Latest Research Reports
- Opinion Leaders
Secondary Research
- Annual Reports
- White Paper
- Latest Press Release
- Industry Association
- Paid Database
- Investor Presentations

Step 4 - Data Triangulation
Involves using different sources of information in order to increase the validity of a study
These sources are likely to be stakeholders in a program - participants, other researchers, program staff, other community members, and so on.
Then we put all data in single framework & apply various statistical tools to find out the dynamic on the market.
During the analysis stage, feedback from the stakeholder groups would be compared to determine areas of agreement as well as areas of divergence