

Key Insights
The Blockchain in Sports market is experiencing substantial growth, propelled by the increasing adoption of Non-Fungible Tokens (NFTs) and the proliferation of blockchain platforms for fan engagement and revenue generation. The market is projected to reach a size of $155.423 billion by 2033, with a Compound Annual Growth Rate (CAGR) of 10.54% from the base year 2025. Primary revenue streams, including media rights, ticketing, merchandise, and sponsorships, are being significantly transformed by blockchain's innovative applications. NFTs are enabling unique digital collectibles and exclusive experiences, thereby bolstering fan loyalty and unlocking new revenue avenues for sports organizations. Platforms such as NBA Top Shot, Sorare, and Rarible exemplify blockchain's capacity to establish digital scarcity and verifiable ownership, increasing value for both fans and entities within the sports ecosystem. Despite ongoing challenges like regulatory uncertainties and the imperative for broader user adoption, the transformative potential of blockchain technology is consistently addressing these hurdles. The escalating demand for transparent, secure, and efficient transactions within sports is a key driver of market expansion, attracting considerable investment and fostering innovation. While North America currently leads the market, the Asia-Pacific region presents significant growth opportunities due to its burgeoning digital economies and highly engaged fan bases.

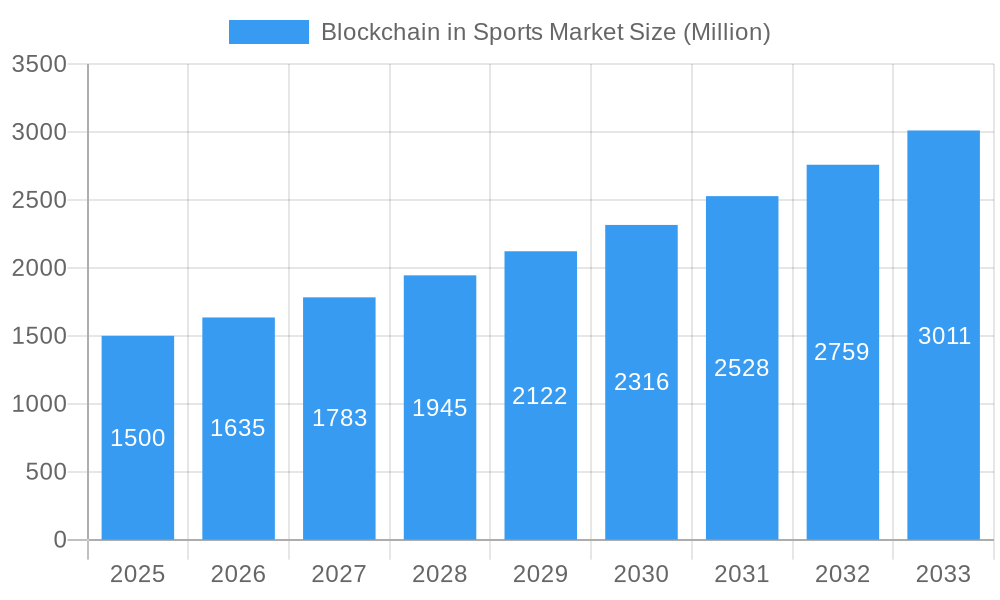
Blockchain in Sports Market Market Size (In Billion)
The successful integration of blockchain in sports necessitates a focus on user-friendly interfaces to mitigate technical barriers for fans and organizations alike. Educational initiatives are also vital for cultivating trust and understanding of blockchain's benefits. Addressing scalability for high-volume transactions and managing the volatility of cryptocurrency markets are critical considerations. Nevertheless, the prospective advantages are immense. By elevating fan engagement, optimizing operational processes, enhancing security, and facilitating the creation of novel revenue streams, blockchain technology is set to fundamentally redefine the sports industry. The forecast period from 2025 to 2033 will witness accelerated market penetration and diversification across diverse sports leagues and teams.
Blockchain in Sports Market Company Market Share
Blockchain in Sports Market: A Comprehensive Report (2019-2033)
This in-depth report provides a comprehensive analysis of the Blockchain in Sports Market, encompassing market dynamics, growth trends, regional dominance, product landscape, key players, and future outlook. The study period covers 2019-2033, with 2025 as the base and estimated year. The forecast period is 2025-2033, and the historical period is 2019-2024. This report is invaluable for investors, industry professionals, and strategists seeking to understand and capitalize on the burgeoning opportunities within this rapidly evolving market. The parent market is the broader Sports Market (valued at xx Million in 2025), with the Blockchain in Sports Market representing a dynamic child segment.
Blockchain in Sports Market Dynamics & Structure
The Blockchain in Sports Market is characterized by a relatively fragmented structure, with several key players vying for market share. However, consolidation is expected through mergers and acquisitions (M&A) as larger companies seek to expand their reach and offerings. Technological innovation, particularly in NFT (Non-Fungible Token) development and blockchain scalability, is a major driver. Regulatory frameworks, still evolving in many jurisdictions, represent a significant challenge, impacting the adoption rate and investment landscape. The market faces competition from traditional ticketing and merchandising systems, but the unique benefits of blockchain—enhanced security, transparency, and verifiable ownership—offer a compelling value proposition. End-user demographics are expanding beyond early adopters, with mainstream sports fans increasingly engaging with blockchain-based solutions.
- Market Concentration: Moderately fragmented, with increasing consolidation expected.
- M&A Activity: xx deals recorded in 2024, projected to increase to xx by 2033.
- Technological Innovation: Focus on NFT marketplaces, improved scalability, and interoperability.
- Regulatory Landscape: Evolving, with varying degrees of clarity across regions.
- Competitive Substitutes: Traditional ticketing, merchandising, and sponsorship models.
- Innovation Barriers: Regulatory uncertainty, technological complexities, and consumer education.
Blockchain in Sports Market Growth Trends & Insights
The Blockchain in Sports Market is experiencing substantial growth, driven by the increasing adoption of NFTs, improved blockchain technology, and the growing awareness of blockchain's potential to enhance fan engagement and create new revenue streams for sports organizations. The market size, estimated at xx Million in 2025, is projected to reach xx Million by 2033, exhibiting a Compound Annual Growth Rate (CAGR) of xx%. This growth is fueled by technological disruptions that offer secure and transparent digital asset management, and a shift in consumer behavior toward digital ownership and engagement with their favorite teams and athletes. Market penetration is steadily increasing, particularly within specific segments like NFT-based collectibles and fan tokens.
Dominant Regions, Countries, or Segments in Blockchain in Sports Market
North America currently holds the largest market share in the Blockchain in Sports Market, driven by early adoption of blockchain technology, a strong presence of tech companies, and a high level of fan engagement with digital platforms. However, Europe and Asia are demonstrating rapid growth. Within segments, Media Rights is a leading segment currently, followed by Merchandising and Sponsorship. Gate/Ticket sales revenues are expected to show high growth potential in coming years.
- North America: High adoption rates, strong tech infrastructure, and early investment.
- Europe: Increasing regulatory clarity and growing interest in blockchain technology.
- Asia: Rapid technological advancements and significant market potential.
- By Source Type:
- Media Rights: High demand for exclusive digital content and NFT collectibles.
- Merchandising: Growing interest in digital collectibles and unique fan experiences.
- Sponsorships: Brands leveraging blockchain for engagement and marketing campaigns.
- Gate/Ticket Sales Revenues: Potential for blockchain-based ticketing to enhance security and efficiency.
Blockchain in Sports Market Product Landscape
The market offers a range of blockchain-based products, including NFT marketplaces, fan tokens, digital collectibles, and blockchain-enabled ticketing platforms. These products offer unique selling propositions, such as enhanced security, verifiable ownership, and new avenues for fan engagement. Continuous technological advancements, focusing on improved scalability, interoperability, and user experience, are further enhancing the product offerings.
Key Drivers, Barriers & Challenges in Blockchain in Sports Market
Key Drivers:
- Increasing adoption of NFTs and digital collectibles.
- Growing interest in fan engagement through blockchain technology.
- Potential for new revenue streams for sports organizations.
- Technological advancements improving scalability and usability.
Key Challenges:
- Regulatory uncertainty and lack of standardized frameworks.
- Scalability issues with existing blockchain technologies.
- Concerns regarding security and consumer protection.
- Competition from traditional methods of ticketing and merchandising. This leads to a xx% reduction in market growth potential for the next 5 years.
Emerging Opportunities in Blockchain in Sports Market
- Untapped markets in developing economies.
- Integration of blockchain with metaverse platforms.
- Development of new applications in sports data analytics and prediction.
- Personalized fan experiences through blockchain-based loyalty programs.
Growth Accelerators in the Blockchain in Sports Market Industry
Strategic partnerships between sports organizations and blockchain technology providers, coupled with continuous technological innovation, are key catalysts for long-term market growth. Expansion into new markets and the development of innovative applications will further propel market expansion.
Notable Milestones in Blockchain in Sports Market Sector
- May 2022: FIFA and Algorand announced a sponsorship and technical partnership deal. Algorand becomes a FIFA World Cup Qatar 2022 Regional Supporter and an Official Sponsor of the FIFA Women's World Cup Australia and New Zealand 2023.
- September 2022: FIFA launched FIFA+ Collect, a platform for affordable digital collectibles powered by Algorand.
In-Depth Blockchain in Sports Market Market Outlook
The Blockchain in Sports Market is poised for significant growth, driven by technological advancements, strategic partnerships, and expanding adoption. Strategic investments in research and development, coupled with regulatory clarity, will unlock immense potential, creating new avenues for fan engagement, revenue generation, and improved transparency across the sports industry. The market is expected to continue its upward trajectory, offering substantial opportunities for investors and businesses alike.
Blockchain in Sports Market Segmentation
-
1. Source Type
- 1.1. Media Rights
- 1.2. Gate/Ticket Sales Revenues
- 1.3. Merchandising
- 1.4. Sponsorships
Blockchain in Sports Market Segmentation By Geography
- 1. North America
- 2. Europe
- 3. Asia Pacific
- 4. Latin America
- 5. Middle East and Africa

Blockchain in Sports Market Regional Market Share
Geographic Coverage of Blockchain in Sports Market
Blockchain in Sports Market REPORT HIGHLIGHTS
| Aspects | Details |
|---|---|
| Study Period | 2020-2034 |
| Base Year | 2025 |
| Estimated Year | 2026 |
| Forecast Period | 2026-2034 |
| Historical Period | 2020-2025 |
| Growth Rate | CAGR of 10.54% from 2020-2034 |
| Segmentation |
|
Table of Contents
- 1. Introduction
- 1.1. Research Scope
- 1.2. Market Segmentation
- 1.3. Research Methodology
- 1.4. Definitions and Assumptions
- 2. Executive Summary
- 2.1. Introduction
- 3. Market Dynamics
- 3.1. Introduction
- 3.2. Market Drivers
- 3.2.1. Aggressive Spending by Venture Capitalists
- 3.3. Market Restrains
- 3.3.1. Scalability Constraints
- 3.4. Market Trends
- 3.4.1. Managing fans engagment platfroms using blockchain is expected to dive growth for the market
- 4. Market Factor Analysis
- 4.1. Porters Five Forces
- 4.2. Supply/Value Chain
- 4.3. PESTEL analysis
- 4.4. Market Entropy
- 4.5. Patent/Trademark Analysis
- 5. Global Blockchain in Sports Market Analysis, Insights and Forecast, 2020-2032
- 5.1. Market Analysis, Insights and Forecast - by Source Type
- 5.1.1. Media Rights
- 5.1.2. Gate/Ticket Sales Revenues
- 5.1.3. Merchandising
- 5.1.4. Sponsorships
- 5.2. Market Analysis, Insights and Forecast - by Region
- 5.2.1. North America
- 5.2.2. Europe
- 5.2.3. Asia Pacific
- 5.2.4. Latin America
- 5.2.5. Middle East and Africa
- 5.1. Market Analysis, Insights and Forecast - by Source Type
- 6. North America Blockchain in Sports Market Analysis, Insights and Forecast, 2020-2032
- 6.1. Market Analysis, Insights and Forecast - by Source Type
- 6.1.1. Media Rights
- 6.1.2. Gate/Ticket Sales Revenues
- 6.1.3. Merchandising
- 6.1.4. Sponsorships
- 6.1. Market Analysis, Insights and Forecast - by Source Type
- 7. Europe Blockchain in Sports Market Analysis, Insights and Forecast, 2020-2032
- 7.1. Market Analysis, Insights and Forecast - by Source Type
- 7.1.1. Media Rights
- 7.1.2. Gate/Ticket Sales Revenues
- 7.1.3. Merchandising
- 7.1.4. Sponsorships
- 7.1. Market Analysis, Insights and Forecast - by Source Type
- 8. Asia Pacific Blockchain in Sports Market Analysis, Insights and Forecast, 2020-2032
- 8.1. Market Analysis, Insights and Forecast - by Source Type
- 8.1.1. Media Rights
- 8.1.2. Gate/Ticket Sales Revenues
- 8.1.3. Merchandising
- 8.1.4. Sponsorships
- 8.1. Market Analysis, Insights and Forecast - by Source Type
- 9. Latin America Blockchain in Sports Market Analysis, Insights and Forecast, 2020-2032
- 9.1. Market Analysis, Insights and Forecast - by Source Type
- 9.1.1. Media Rights
- 9.1.2. Gate/Ticket Sales Revenues
- 9.1.3. Merchandising
- 9.1.4. Sponsorships
- 9.1. Market Analysis, Insights and Forecast - by Source Type
- 10. Middle East and Africa Blockchain in Sports Market Analysis, Insights and Forecast, 2020-2032
- 10.1. Market Analysis, Insights and Forecast - by Source Type
- 10.1.1. Media Rights
- 10.1.2. Gate/Ticket Sales Revenues
- 10.1.3. Merchandising
- 10.1.4. Sponsorships
- 10.1. Market Analysis, Insights and Forecast - by Source Type
- 11. Competitive Analysis
- 11.1. Global Market Share Analysis 2025
- 11.2. Company Profiles
- 11.2.1 Rarible
- 11.2.1.1. Overview
- 11.2.1.2. Products
- 11.2.1.3. SWOT Analysis
- 11.2.1.4. Recent Developments
- 11.2.1.5. Financials (Based on Availability)
- 11.2.2 globatalent
- 11.2.2.1. Overview
- 11.2.2.2. Products
- 11.2.2.3. SWOT Analysis
- 11.2.2.4. Recent Developments
- 11.2.2.5. Financials (Based on Availability)
- 11.2.3 Nifty Gateway
- 11.2.3.1. Overview
- 11.2.3.2. Products
- 11.2.3.3. SWOT Analysis
- 11.2.3.4. Recent Developments
- 11.2.3.5. Financials (Based on Availability)
- 11.2.4 Blockasset
- 11.2.4.1. Overview
- 11.2.4.2. Products
- 11.2.4.3. SWOT Analysis
- 11.2.4.4. Recent Developments
- 11.2.4.5. Financials (Based on Availability)
- 11.2.5 NFT Stars
- 11.2.5.1. Overview
- 11.2.5.2. Products
- 11.2.5.3. SWOT Analysis
- 11.2.5.4. Recent Developments
- 11.2.5.5. Financials (Based on Availability)
- 11.2.6 Eternal
- 11.2.6.1. Overview
- 11.2.6.2. Products
- 11.2.6.3. SWOT Analysis
- 11.2.6.4. Recent Developments
- 11.2.6.5. Financials (Based on Availability)
- 11.2.7 Flow
- 11.2.7.1. Overview
- 11.2.7.2. Products
- 11.2.7.3. SWOT Analysis
- 11.2.7.4. Recent Developments
- 11.2.7.5. Financials (Based on Availability)
- 11.2.8 Sorare
- 11.2.8.1. Overview
- 11.2.8.2. Products
- 11.2.8.3. SWOT Analysis
- 11.2.8.4. Recent Developments
- 11.2.8.5. Financials (Based on Availability)
- 11.2.9 Algorand
- 11.2.9.1. Overview
- 11.2.9.2. Products
- 11.2.9.3. SWOT Analysis
- 11.2.9.4. Recent Developments
- 11.2.9.5. Financials (Based on Availability)
- 11.2.10 OpenSea
- 11.2.10.1. Overview
- 11.2.10.2. Products
- 11.2.10.3. SWOT Analysis
- 11.2.10.4. Recent Developments
- 11.2.10.5. Financials (Based on Availability)
- 11.2.11 NBA Top Shot
- 11.2.11.1. Overview
- 11.2.11.2. Products
- 11.2.11.3. SWOT Analysis
- 11.2.11.4. Recent Developments
- 11.2.11.5. Financials (Based on Availability)
- 11.2.12 Dappler Labs
- 11.2.12.1. Overview
- 11.2.12.2. Products
- 11.2.12.3. SWOT Analysis
- 11.2.12.4. Recent Developments
- 11.2.12.5. Financials (Based on Availability)
- 11.2.1 Rarible
List of Figures
- Figure 1: Global Blockchain in Sports Market Revenue Breakdown (billion, %) by Region 2025 & 2033
- Figure 2: North America Blockchain in Sports Market Revenue (billion), by Source Type 2025 & 2033
- Figure 3: North America Blockchain in Sports Market Revenue Share (%), by Source Type 2025 & 2033
- Figure 4: North America Blockchain in Sports Market Revenue (billion), by Country 2025 & 2033
- Figure 5: North America Blockchain in Sports Market Revenue Share (%), by Country 2025 & 2033
- Figure 6: Europe Blockchain in Sports Market Revenue (billion), by Source Type 2025 & 2033
- Figure 7: Europe Blockchain in Sports Market Revenue Share (%), by Source Type 2025 & 2033
- Figure 8: Europe Blockchain in Sports Market Revenue (billion), by Country 2025 & 2033
- Figure 9: Europe Blockchain in Sports Market Revenue Share (%), by Country 2025 & 2033
- Figure 10: Asia Pacific Blockchain in Sports Market Revenue (billion), by Source Type 2025 & 2033
- Figure 11: Asia Pacific Blockchain in Sports Market Revenue Share (%), by Source Type 2025 & 2033
- Figure 12: Asia Pacific Blockchain in Sports Market Revenue (billion), by Country 2025 & 2033
- Figure 13: Asia Pacific Blockchain in Sports Market Revenue Share (%), by Country 2025 & 2033
- Figure 14: Latin America Blockchain in Sports Market Revenue (billion), by Source Type 2025 & 2033
- Figure 15: Latin America Blockchain in Sports Market Revenue Share (%), by Source Type 2025 & 2033
- Figure 16: Latin America Blockchain in Sports Market Revenue (billion), by Country 2025 & 2033
- Figure 17: Latin America Blockchain in Sports Market Revenue Share (%), by Country 2025 & 2033
- Figure 18: Middle East and Africa Blockchain in Sports Market Revenue (billion), by Source Type 2025 & 2033
- Figure 19: Middle East and Africa Blockchain in Sports Market Revenue Share (%), by Source Type 2025 & 2033
- Figure 20: Middle East and Africa Blockchain in Sports Market Revenue (billion), by Country 2025 & 2033
- Figure 21: Middle East and Africa Blockchain in Sports Market Revenue Share (%), by Country 2025 & 2033
List of Tables
- Table 1: Global Blockchain in Sports Market Revenue billion Forecast, by Source Type 2020 & 2033
- Table 2: Global Blockchain in Sports Market Revenue billion Forecast, by Region 2020 & 2033
- Table 3: Global Blockchain in Sports Market Revenue billion Forecast, by Source Type 2020 & 2033
- Table 4: Global Blockchain in Sports Market Revenue billion Forecast, by Country 2020 & 2033
- Table 5: Global Blockchain in Sports Market Revenue billion Forecast, by Source Type 2020 & 2033
- Table 6: Global Blockchain in Sports Market Revenue billion Forecast, by Country 2020 & 2033
- Table 7: Global Blockchain in Sports Market Revenue billion Forecast, by Source Type 2020 & 2033
- Table 8: Global Blockchain in Sports Market Revenue billion Forecast, by Country 2020 & 2033
- Table 9: Global Blockchain in Sports Market Revenue billion Forecast, by Source Type 2020 & 2033
- Table 10: Global Blockchain in Sports Market Revenue billion Forecast, by Country 2020 & 2033
- Table 11: Global Blockchain in Sports Market Revenue billion Forecast, by Source Type 2020 & 2033
- Table 12: Global Blockchain in Sports Market Revenue billion Forecast, by Country 2020 & 2033
Frequently Asked Questions
1. What is the projected Compound Annual Growth Rate (CAGR) of the Blockchain in Sports Market?
The projected CAGR is approximately 10.54%.
2. Which companies are prominent players in the Blockchain in Sports Market?
Key companies in the market include Rarible, globatalent, Nifty Gateway, Blockasset, NFT Stars, Eternal, Flow, Sorare, Algorand, OpenSea, NBA Top Shot, Dappler Labs.
3. What are the main segments of the Blockchain in Sports Market?
The market segments include Source Type.
4. Can you provide details about the market size?
The market size is estimated to be USD 155.423 billion as of 2022.
5. What are some drivers contributing to market growth?
Aggressive Spending by Venture Capitalists.
6. What are the notable trends driving market growth?
Managing fans engagment platfroms using blockchain is expected to dive growth for the market.
7. Are there any restraints impacting market growth?
Scalability Constraints.
8. Can you provide examples of recent developments in the market?
September 2022 - FIFA is glad to announce the FIFA+ Collect introduction, allowing football fans worldwide to acquire unique digital collectibles inexpensively; Algorand powers FIFA+ Collect. FIFA+ Collect is a new platform allowing fans to own and collect FIFA World Cup and FIFA Women's World Cup moments.
9. What pricing options are available for accessing the report?
Pricing options include single-user, multi-user, and enterprise licenses priced at USD 4750, USD 5250, and USD 8750 respectively.
10. Is the market size provided in terms of value or volume?
The market size is provided in terms of value, measured in billion.
11. Are there any specific market keywords associated with the report?
Yes, the market keyword associated with the report is "Blockchain in Sports Market," which aids in identifying and referencing the specific market segment covered.
12. How do I determine which pricing option suits my needs best?
The pricing options vary based on user requirements and access needs. Individual users may opt for single-user licenses, while businesses requiring broader access may choose multi-user or enterprise licenses for cost-effective access to the report.
13. Are there any additional resources or data provided in the Blockchain in Sports Market report?
While the report offers comprehensive insights, it's advisable to review the specific contents or supplementary materials provided to ascertain if additional resources or data are available.
14. How can I stay updated on further developments or reports in the Blockchain in Sports Market?
To stay informed about further developments, trends, and reports in the Blockchain in Sports Market, consider subscribing to industry newsletters, following relevant companies and organizations, or regularly checking reputable industry news sources and publications.
Methodology
Step 1 - Identification of Relevant Samples Size from Population Database


Step 2 - Approaches for Defining Global Market Size (Value, Volume* & Price*)

Note*: In applicable scenarios
Step 3 - Data Sources
Primary Research
- Web Analytics
- Survey Reports
- Research Institute
- Latest Research Reports
- Opinion Leaders
Secondary Research
- Annual Reports
- White Paper
- Latest Press Release
- Industry Association
- Paid Database
- Investor Presentations

Step 4 - Data Triangulation
Involves using different sources of information in order to increase the validity of a study
These sources are likely to be stakeholders in a program - participants, other researchers, program staff, other community members, and so on.
Then we put all data in single framework & apply various statistical tools to find out the dynamic on the market.
During the analysis stage, feedback from the stakeholder groups would be compared to determine areas of agreement as well as areas of divergence